

Multi-generational SIR modeling: Determination of parameters, epidemiological forecasting and age-dependent vaccination policies
- PMID: 34127952
- PMCID: PMC8189834
- DOI: 10.1016/j.idm.2021.05.003
Multi-generational SIR modeling: Determination of parameters, epidemiological forecasting and age-dependent vaccination policies
Abstract
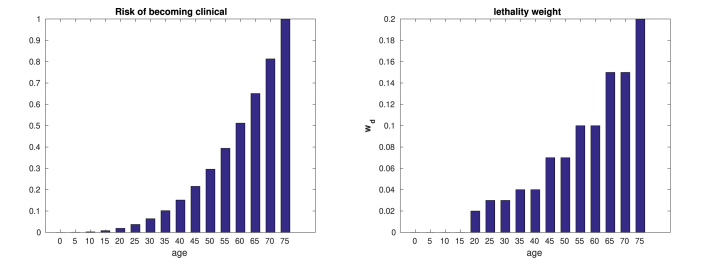
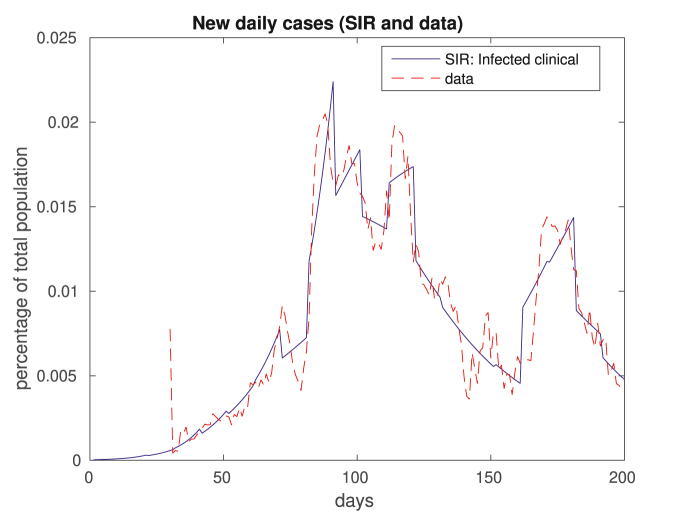
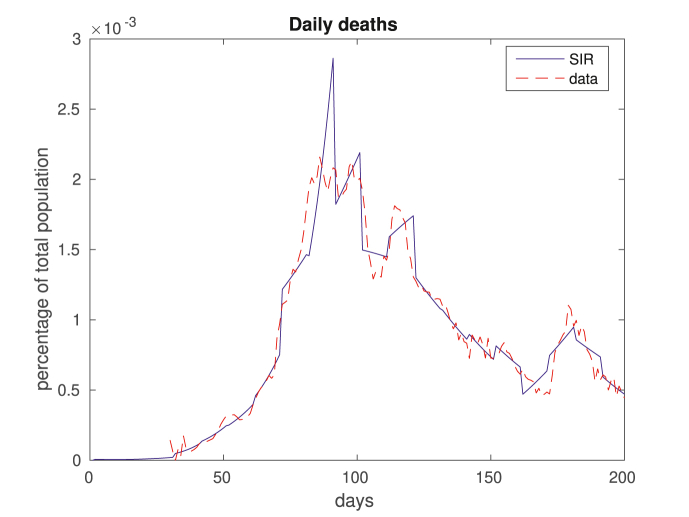
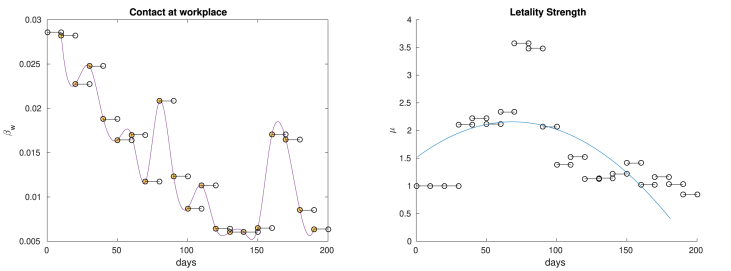
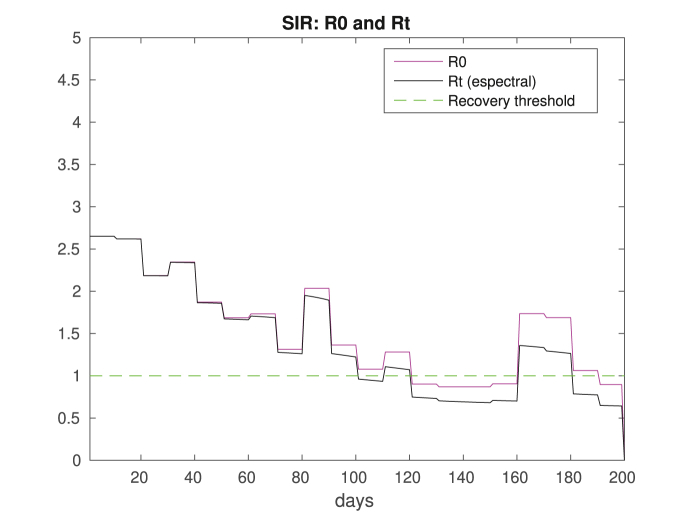
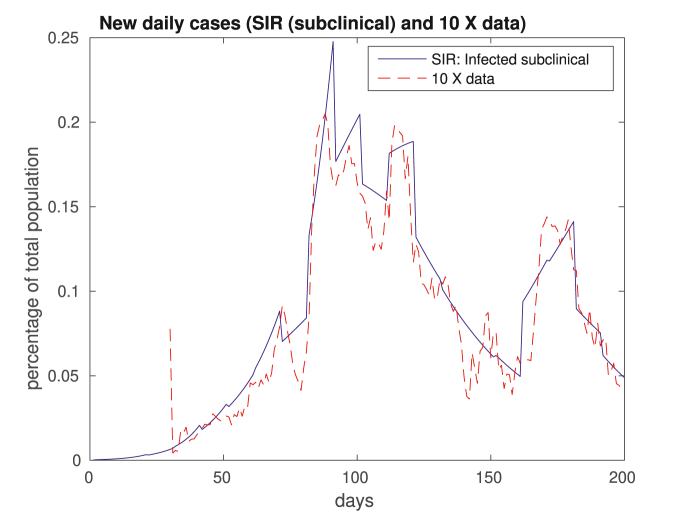
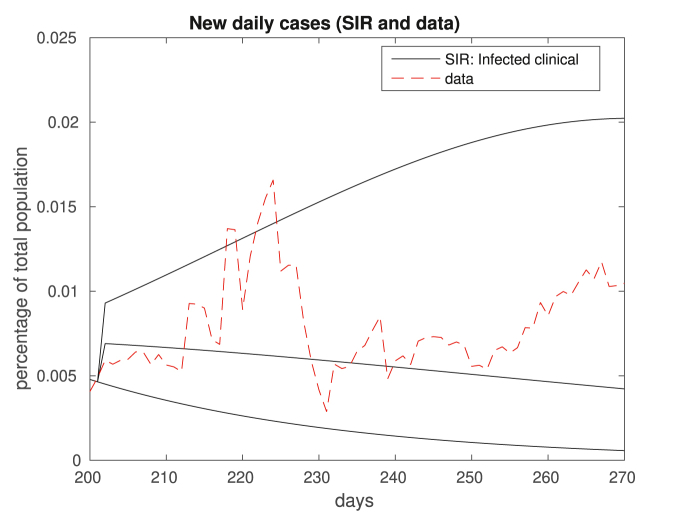
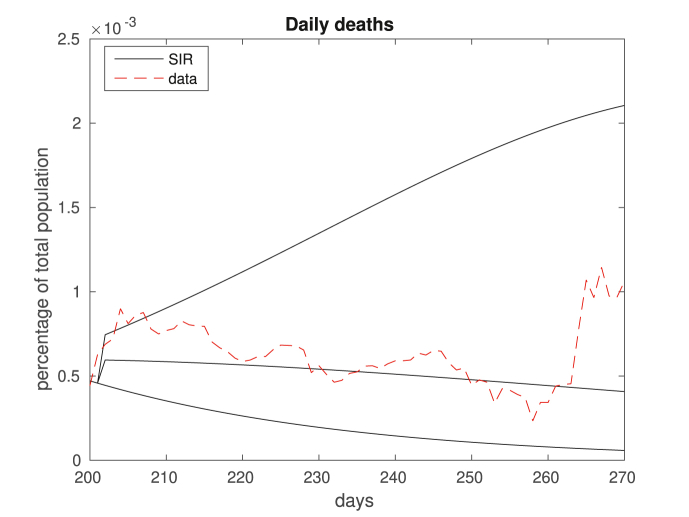
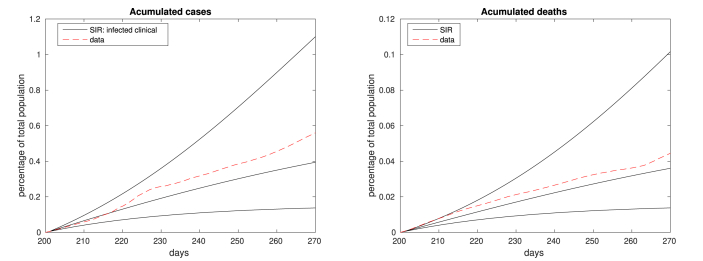
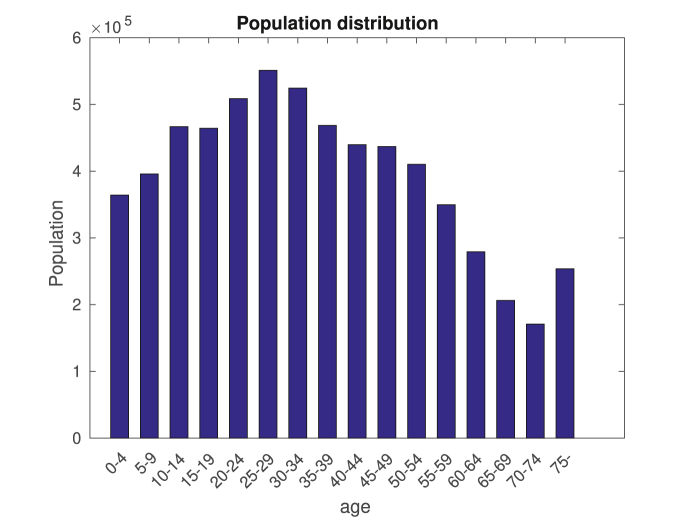
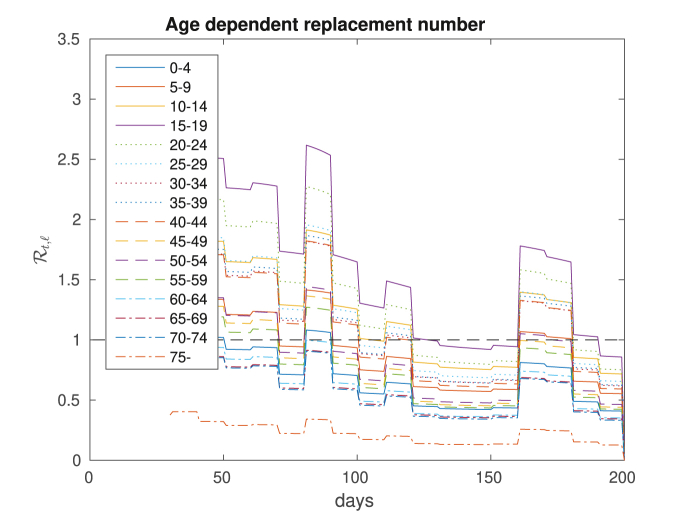
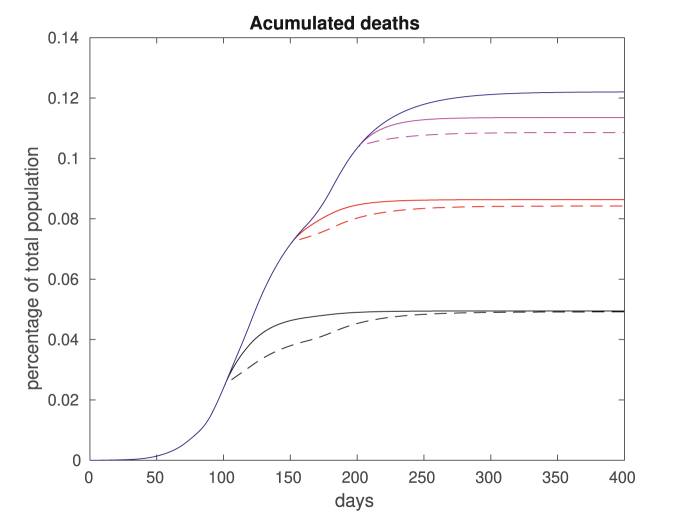
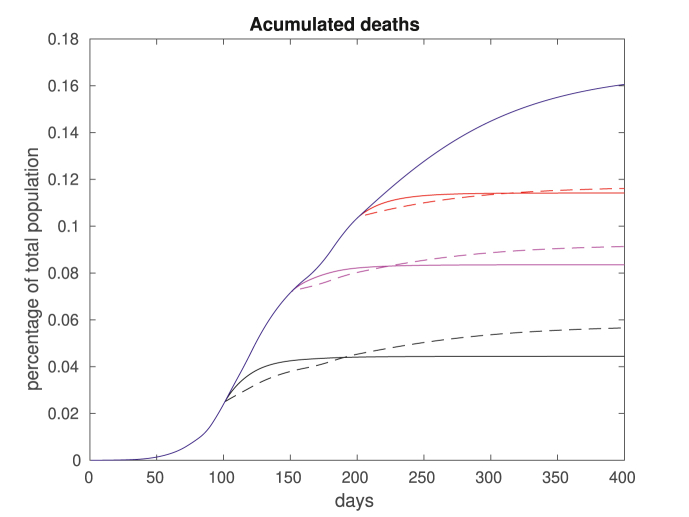
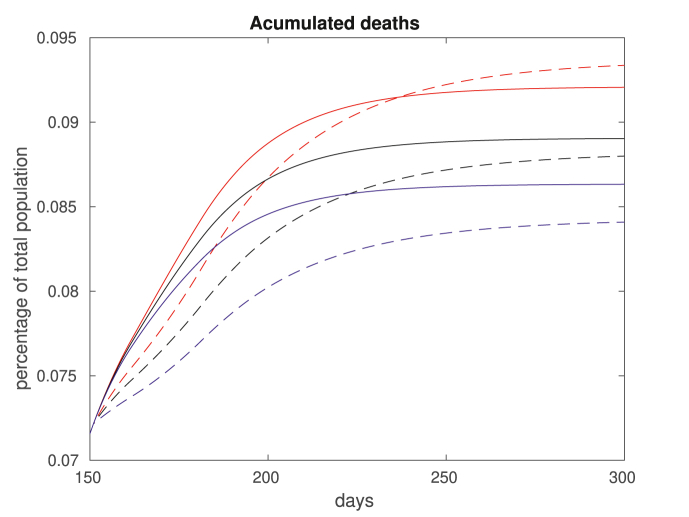
We use an age-dependent SIR system of equations to model the evolution of the COVID-19. Parameters that measure the amount of interaction in different locations (home, work, school, other) are approximated from in-sample data using a random optimization scheme, and indicate changes in social distancing along the course of the pandemic. That allows the estimation of the time evolution of classical and age-dependent reproduction numbers. With those parameters we predict the disease dynamics, and compare our results with out-of-sample data from the City of Rio de Janeiro. Finally, we provide a numerical investigation regarding age-based vaccination policies, shedding some light on whether is preferable to vaccinate those at most risk (the elderly) or those who spread the disease the most (the youngest). There is no clear upshot, as the results depend on the age of those immunized, contagious parameters, vaccination schedules and efficiency.
Keywords: COVID-19; Compartmental modeling; Epidemiology; SIR; Vaccination.
© 2021 The Authors.
Conflict of interest statement
The authors declare that they have no known competing financial interests or personal relationships that could have appeared to influence the work reported in this paper.
Figures
Similar articles
-
Revisiting classical SIR modelling in light of the COVID-19 pandemic.Infect Dis Model. 2023 Mar;8(1):72-83. doi: 10.1016/j.idm.2022.12.002. Epub 2022 Dec 16. Infect Dis Model. 2023. PMID: 36540893 Free PMC article.
-
Tracing day-zero and forecasting the COVID-19 outbreak in Lombardy, Italy: A compartmental modelling and numerical optimization approach.PLoS One. 2020 Oct 30;15(10):e0240649. doi: 10.1371/journal.pone.0240649. eCollection 2020. PLoS One. 2020. PMID: 33125393 Free PMC article.
-
COVID-19 spreading in Rio de Janeiro, Brazil: Do the policies of social isolation really work?Chaos Solitons Fractals. 2020 Jul;136:109930. doi: 10.1016/j.chaos.2020.109930. Epub 2020 May 23. Chaos Solitons Fractals. 2020. PMID: 32501374 Free PMC article.
-
A general modeling framework for quantitative tracking, accurate prediction of ICU, and assessing vaccination for COVID-19 in Chile.Front Public Health. 2023 Mar 31;11:1111641. doi: 10.3389/fpubh.2023.1111641. eCollection 2023. Front Public Health. 2023. PMID: 37064668 Free PMC article.
-
Usage of Compartmental Models in Predicting COVID-19 Outbreaks.AAPS J. 2022 Sep 2;24(5):98. doi: 10.1208/s12248-022-00743-9. AAPS J. 2022. PMID: 36056223 Free PMC article. Review.
Cited by
-
Study on the Global Stability for a Generalized SEIR Epidemic Model.Comput Intell Neurosci. 2022 Aug 8;2022:8215214. doi: 10.1155/2022/8215214. eCollection 2022. Comput Intell Neurosci. 2022. Retraction in: Comput Intell Neurosci. 2023 Jul 26;2023:9871807. doi: 10.1155/2023/9871807. PMID: 35978893 Free PMC article. Retracted.
-
Vaccination Schedule under Conditions of Limited Vaccine Production Rate.Vaccines (Basel). 2022 Jan 13;10(1):116. doi: 10.3390/vaccines10010116. Vaccines (Basel). 2022. PMID: 35062776 Free PMC article.
-
Predictive models for health outcomes due to SARS-CoV-2, including the effect of vaccination: a systematic review.Syst Rev. 2024 Jan 16;13(1):30. doi: 10.1186/s13643-023-02411-1. Syst Rev. 2024. PMID: 38229123 Free PMC article.
-
From pandemic to a new normal: Strategies to optimise governmental interventions in Indonesia based on an SVEIQHR-type mathematical model.Infect Dis Model. 2022 Sep;7(3):346-363. doi: 10.1016/j.idm.2022.06.004. Epub 2022 Jun 30. Infect Dis Model. 2022. PMID: 35789595 Free PMC article.
-
Learning from the COVID-19 pandemic: A systematic review of mathematical vaccine prioritization models.Infect Dis Model. 2024 May 15;9(4):1057-1080. doi: 10.1016/j.idm.2024.05.005. eCollection 2024 Dec. Infect Dis Model. 2024. PMID: 38988830 Free PMC article. Review.
References
-
- d'Onofrio A., Manfredi P. Springer International Publishing; Cham: 2020. The interplay between voluntary vaccination and reduction of risky behavior: A general behavior-implicit sir model for vaccine preventable infections. - DOI
-
- Acemoglu D., Chernozhukov V., Werning I., Whinston M.D. National Bureau of Economic Research; May 2020. A multi-risk sir model with optimally targeted lockdown.http://www.nber.org/papers/w27102 Working Paper 27102. - DOI
-
- Aguas R., Corder R.M., King J.G., Goncalves G., Ferreira M.U., Gomes M.G.M. Herd immunity thresholds for sars-cov-2 estimated from unfolding epidemics. https://www.medrxiv.org/content/early/2020/07/24/2020.07.23.20160762.ful...https://www.medrxiv.org/content/early/2020/07/24/2020.07.23.20160762 medRxivarXiv.
LinkOut - more resources
Full Text Sources
