. 2021 Jul 23;24(7):102711.
doi: 10.1016/j.isci.2021.102711. Epub 2021 Jun 10.

CD177, a specific marker of neutrophil activation, is associated with coronavirus disease 2019 severity and death

Affiliations

CD177, a specific marker of neutrophil activation, is associated with coronavirus disease 2019 severity and death

Yves Lévy et al. iScience. .

Erratum in

Abstract

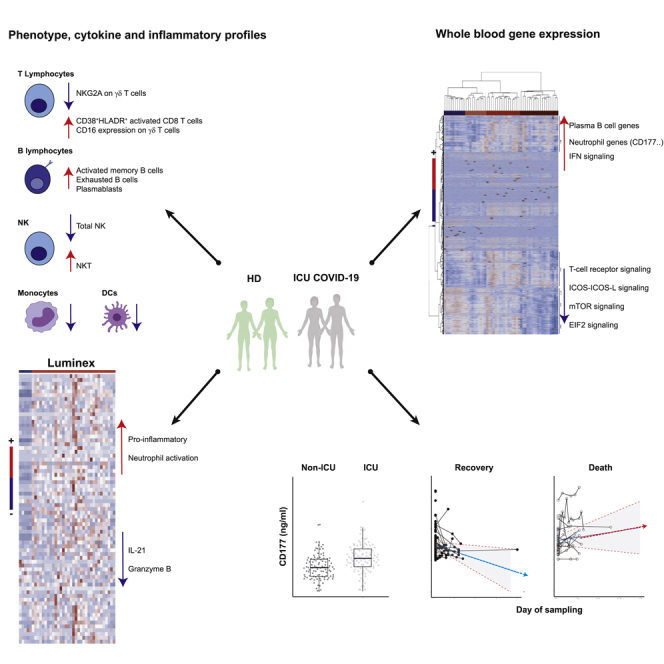
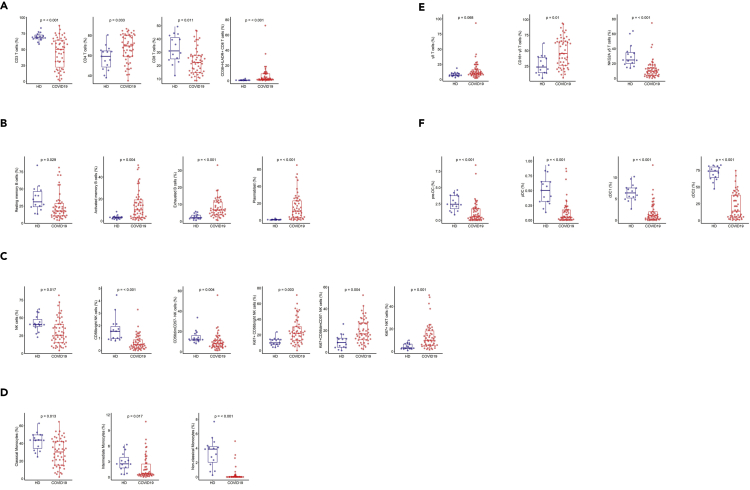
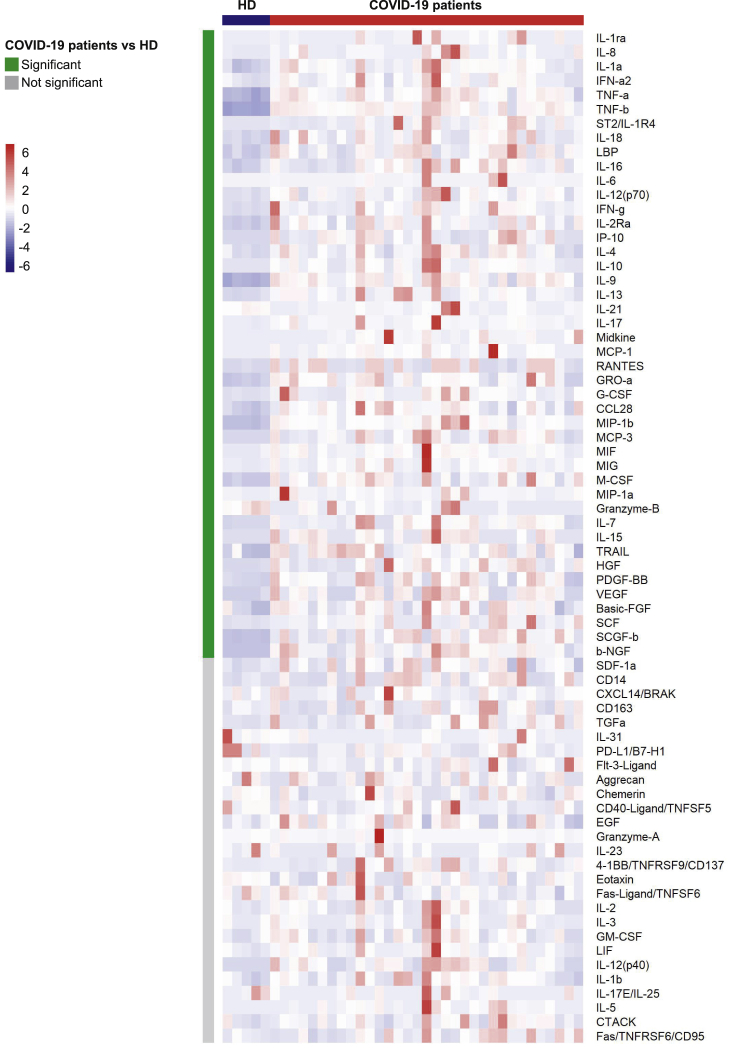
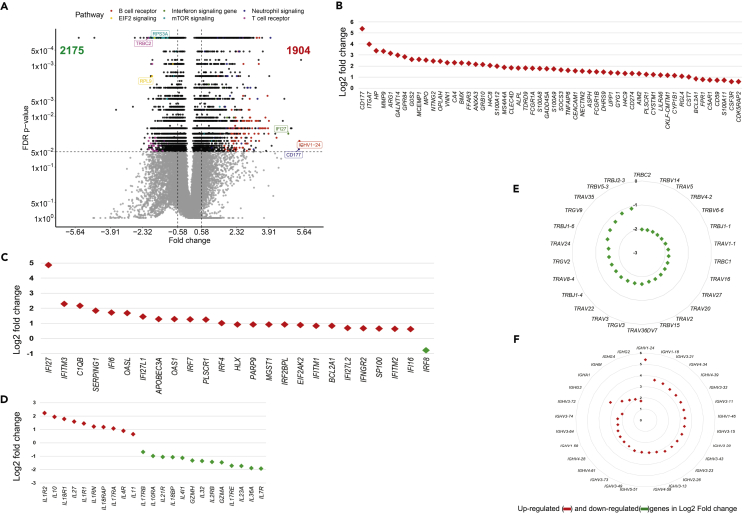
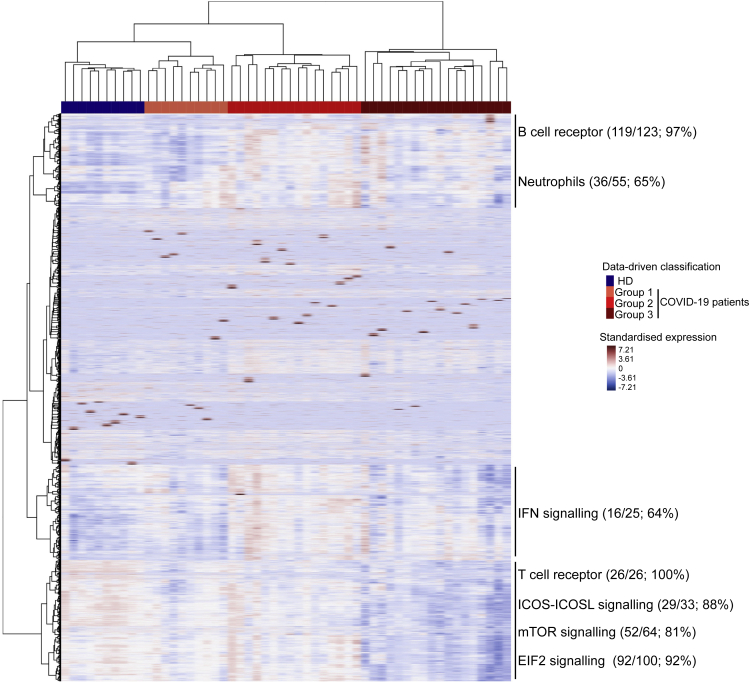
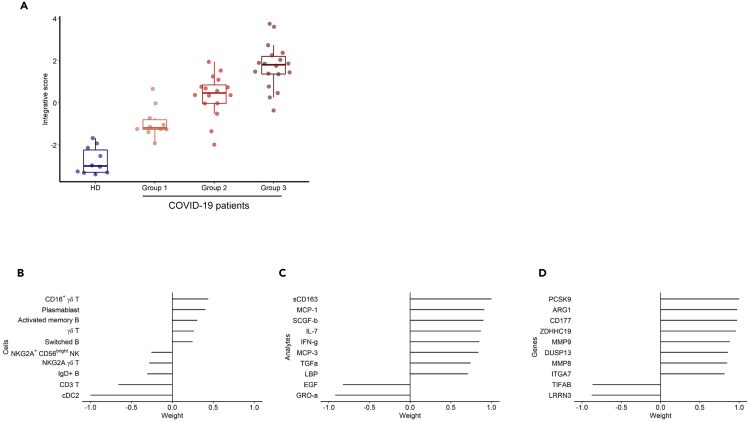
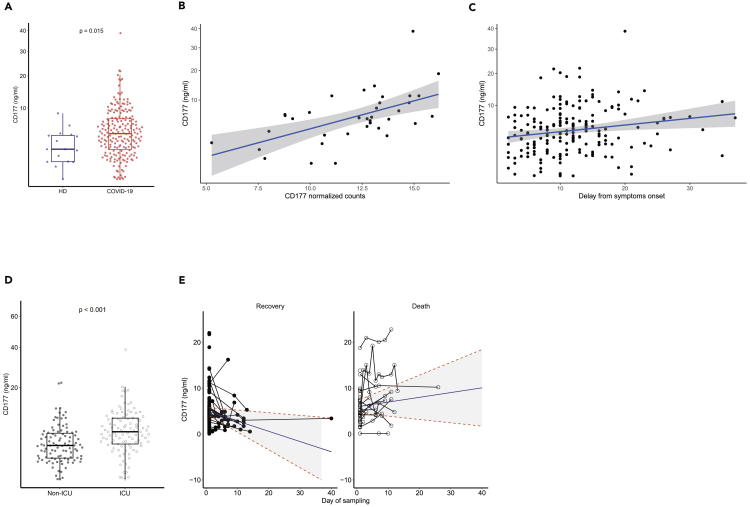
The identification of patients with coronavirus disease 2019 and high risk of severe disease is a challenge in routine care. We performed cell phenotypic, serum, and RNA sequencing gene expression analyses in severe hospitalized patients (n = 61). Relative to healthy donors, results showed abnormalities of 27 cell populations and an elevation of 42 cytokines, neutrophil chemo-attractants, and inflammatory components in patients. Supervised and unsupervised analyses revealed a high abundance of CD177, a specific neutrophil activation marker, contributing to the clustering of severe patients. Gene abundance correlated with high serum levels of CD177 in severe patients. Higher levels were confirmed in a second cohort and in intensive care unit (ICU) than non-ICU patients (P < 0.001). Longitudinal measurements discriminated between patients with the worst prognosis, leading to death, and those who recovered (P = 0.01). These results highlight neutrophil activation as a hallmark of severe disease and CD177 assessment as a reliable prognostic marker for routine care.

Keywords: immunology; virology.


Conflict of interest statement

None of the authors has any conflict of interest to declare.

Figures

None
Graphical abstract
Figure 1
Figure 1
Frequency of immune-cell subsets between HDs (n = 18) and patients with COVID-19 (n = 50) (A) Frequency of total CD3 T cells, CD4 and CD8 T cell subsets, and activated CD38+HLADR+ CD8 T cells. (B) Frequency of B cell subsets (CD21+CD27+: resting memory, CD21CD27+: activated memory, CD21CD27-: exhausted) and plasmablasts (CD38++CD27+) gated on CD19+ B cells. (C) Frequency of NK cell subsets (gated on CD3- CD14-) CD56Bright: CD56++CD16+, CD56dim: CD56+CD16++CD57+/−, differentiated Ki67+ NK cells (gated on CD56Bright or CD56dimCD57- NK cells) and differentiated Ki67+ NKT cells (gated on CD3+CD56+ cells). (D) Monocyte subsets (gated on CD3CD56-) (classical monocytes: CD14+CD16-, intermediate monocytes: CD16+CD14+, non-classical monocytes: CD14CD16+). (E) Frequency of γδ T cells (gated on CD3+ T cells) and CD16 and NKG2A expression (gated on γδ CD3 T cells). (F) Frequency of DC subsets (gated on HLADR+Lin) (pDC: CD45RA+CD33CD123+, pre-DC: CD123+CD45RA+, cDC1: CD33+CD123CD141+CD1clow, cDC2: CD33+CD123CD14+CD1c+) detected by flow cytometry in PBMCs from n = 50 patients with COVID-19 and n = 18 HDs. The differences between the two groups were evaluated using Wilcoxon rank sum statistical tests. The lower and upper boundaries of the box represent the 25% and 75% percentiles, the whiskers extend to the most extreme data point that is no more than 1.5 times the interquartile range away from the box. Median values (horizontal line in the boxplot) are shown. See also Figures S1 and S2.
Figure 2
Figure 2
Heatmap of analyte abundance in serum The colors represent standardized expression values centered around the mean, with variance equal to 1. HD: healthy donors (n = 5), COVID: patients with COVID-19 (n = 33). Each column represents a subject. Each line represents an analyte. See also Figure S3.
Figure 3
Figure 3
Whole blood gene expression in COVID-19 patients and HDs (A) Volcano plot showing differentially expressed genes (DEG) as per the log2 fold change (log2 FC) and Benjamini-Hocberg False Discovery Rate (FDR) with thresholds at absolute log2 FC ≥ log2(1.5) and FDR ≤0.05. (B) Main top DEG related to neutrophils. (C and D) Main DEG related to IFN and interleukin responses, respectively. (E) Main TCRV T cell repertoire DEG. (F) Main B-cell IGHV repertoire DEG. Red symbols represent overabundant genes in COVID-19 relative to HD, green symbols represent underabundant genes. See also Figure S4 and Table S2.
Figure 4
Figure 4
Heatmap of standardized gene expression The colors represent standardized expression values centered around 0, with variance equal to 1. Each column represents a subject. This heatmap was built by unsupervised hierarchical clustering of log2-counts-per-million RNA-seq transcriptomic data from whole blood (29,302 genes) and subjects (n = 54) using the Euclidean distance and Ward's method. Seven blocks are highlighted as per the features of gene expression across the groups of individuals. Enrichment (number and % of genes of a given pathway selected in the block) of pathways of interest are shown for each block. See also Table S1.
Figure 5
Figure 5
Integrative analysis. Integrative analysis of the data of RNA-seq (29,302 genes) from 44 patients with COVID-19, cell phenotype (52 types) from 45 patients with COVID-19, and serum analytes (71 analytes) from 33 patients with COVID-19 using a sparse principal component analysis approach, MOFA v2 (A–D)(A) Integrative score as per the patient groups defined by the hierarchical clustering of the RNA-seq data. Top 10 marker contributions (as per the weight from −1 to 1) of the cell phenotypes (B), serum analytes (C), and RNA-seq (D). The integrative score corresponds to the first factor of the analysis and allows the ordering of individuals along an axis centered at 0. Individuals with an opposite sign for the factor therefore have opposite characteristics. See also Figure S5.
Figure 6
Figure 6
Distribution of the CD177 marker and association with clinical outcomes of patients with COVID-19 (A) Measurement of CD177 (ng/mL). HD: Healthy donors (n = 16), patients with COVID-19 (n = 203). The difference between the two groups was evaluated using Wilcoxon rank sum statistical tests. The median values (horizontal line in the boxplot) are shown. The lower and upper boundaries of the box represent the 25% and 75% percentiles. (B) Correlation between normalized CD177 values of gene expression measured by RNA-seq and CD177 protein by ELISA (ng/mL) from 36 patients with COVID-19. The blue line represents the linear regression line and the gray area the 95% prediction confidence interval. (C) Association between CD177 serum concentration and time from symptom onset to the admission (n = 192). This association was tested using Spearman correlation tests. The blue line represents the linear regression line and the gray area the 95% confidence interval. (D) Measurement of CD177 serum concentration in patients hospitalized in an intensive care unit (ICU) or not (n = 196). Wilcoxon rank tests were used. The median values (horizontal line in the boxplot) are shown. The lower and upper boundaries of the box represent the 25% and 75% percentiles. (E) Change of CD177 concentration over time according to the occurrence of death for 172 patients with COVID-19 and a total of 248 measurements. Predictions were calculated using a mixed effect models for longitudinal data. See also Figure S6.

Similar articles

Cited by

References

    1. Ali S., Mann-Nüttel R., Schulze A., Richter L., Alferink J., Scheu S. Sources of type I interferons in infectious immunity: plasmacytoid dendritic cells not always in the driver's seat. Front. Immunol. 2019;10:778. - PMC - PubMed
    1. Argelaguet R., Clark S.J., Mohammed H., Stapel L.C., Krueger C., Kapourani C.A., Imaz-Rosshandler I., Lohoff T., Xiang Y.L., Hanna C.W. Multi-omics profiling of mouse gastrulation at single-cell resolution. Nature. 2019;576:487. - PMC - PubMed
    1. Arunachalam P.S., Wimmers F., Mok C.K.P., Perera R., Scott M., Hagan T., Sigal N., Feng Y., Bristow L., Tak-Yin Tsang O. Systems biological assessment of immunity to mild versus severe COVID-19 infection in humans. Science. 2020;369:1210–1220. - PMC - PubMed
    1. Aschenbrenner A.C., Mouktaroudi M., Krämer B., Oestreich M., Antonakos N., Nuesch-Germano M., Gkizeli K., Bonaguro L., Reusch N., Baßler K. Disease severity-specific neutrophil signatures in blood transcriptomes stratify COVID-19 patients. Genome Med. 2021;13:7. - PMC - PubMed
    1. Augustin A., Kubo R.T., Sim G.K. Resident pulmonary lymphocytes expressing the gamma/delta T-cell receptor. Nature. 1989;340:239–241. - PubMed