[Preprint]. 2021 Jun 8:rs.3.rs-133494.
doi: 10.21203/rs.3.rs-133494/v1.

Type I Interferon Transcriptional Network Regulates Expression of Coinhibitory Receptors in Human T cells

Affiliations

Type I Interferon Transcriptional Network Regulates Expression of Coinhibitory Receptors in Human T cells

David Hafler et al. Res Sq. .

Update in

Abstract

While inhibition of T cell co-inhibitory receptors has revolutionized cancer therapy, the mechanisms governing their expression on human T cells have not been elucidated. Type 1 interferon (IFN-I) modulates T cell immunity in viral infection, autoimmunity, and cancer, and may facilitate induction of T cell exhaustion in chronic viral infection. Here we show that IFN-I regulates co-inhibitory receptor expression on human T cells, inducing PD-1/TIM-3/LAG-3 while surprisingly inhibiting TIGIT expression. High-temporal-resolution mRNA profiling of IFN-I responses enabled the construction of dynamic transcriptional regulatory networks uncovering three temporal transcriptional waves. Perturbation of key transcription factors on human primary T cells revealed unique regulators that control expression of co-inhibitory receptors. We found that the dynamic IFN-I response in vitro closely mirrored T cell features with IFN-I linked acute SARS-CoV-2 infection in human, with high LAG3 and decreased TIGIT expression. Finally, our gene regulatory network identified SP140 as a key regulator for differential LAG3 and TIGIT expression, which were validated at the level of protein expression. The construction of IFN-I regulatory networks with identification of unique transcription factors controlling co-inhibitory receptor expression may provide targets for enhancement of immunotherapy in cancer, infectious diseases, and autoimmunity.


Figures
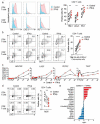
Figure 1
Figure 1
IFN-b differently regulates LAG-3, TIM-3, PD-1 and TIGIT in human T cells Effects of IFN-b on LAG-3, TIM-3, PD-1, and TIGIT expression on human naïve CD4+ and CD8+ T cells cultured with anti-CD3/CD28 for 96h in the absence (Control) or with 500 U/ml IFN-b (IFN-b). a, Representative histograms of flow cytometry analysis (left), quantitative expression for LAG-3, TIM-3, and PD-1 expression on naïve CD4+ T cells (n = 6 - 8) (right). b, Representative contour plots of flow cytometry analysis on surface LAG-3, TIM-3, and PD-1 (left), quantitative analysis for LAG-3, TIM-3, and PD-1 triple-positive cells in naïve CD4+ T cells (n = 8) (right). c, Gene expression kinetics of LAG3, HAVCR2, PDCD1, and TIGIT quantified by qPCR with 13 timepoints in naïve CD4+ T cells. Average expression values from two subjects are plotted. d, IFN-b induces LAG-3 but suppresses TIGIT expression on human naïve CD4+ and CD8+ T cells. Representative contour plots of flow cytometry analysis (left), quantitative analysis for TIGIT positive cells in naïve CD4+ T cells (n = 8) (right). e, Co-inhibitory receptors expression pattern under IFN-b treatment in naïve CD4+ T cells by qPCR (n = 4). Red and blue bars represent higher expression in IFN-b treatment and Control condition, respectively. Data was represented as mean +/− SD. **p < 0.01, ****p < 0.0001. Paired Student’s t test.
Figure 2
Figure 2
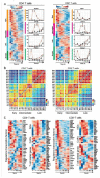
Three waves of dynamic transcriptomic changes by IFN-b in human T cells a, Gene expression profiles under IFN-b treatment in naïve CD4+ and CD8+ T cells. Differential expression of gene levels for eight time points with IFN-b stimulation (loq2(expression)) are shown in heatmap. Based on the expression kinetics, the genes are clustered into four categories: early, intermediate, late, and bimodal (up regulated at early and late phase). Representative individual gene expression kinetics from each cluster are shown (mean+/− SD). b, Correlation matrix of global gene expression representing three transcriptional waves on CD4+ (left) and CD8+ (right) T cells: early (1-2h), intermediate (4-16h), and late (48-96h). Eight timepoints with three replicates are shown. c, Temporal transcriptional profiles of differentially expressed genes for four categories are shown; transcriptional regulators (transcription factors), ISGs, co-inhibitory receptors, and key T cell associated factors for CD4+ (left) and CD8+ (right) T cells.
Figure 3
Figure 3
Perturbation of key transcription factors in quiescent human T cells a, Characterization of candidate TFs for perturbation. Perturbed TFs are listed based on overlap between differentially expressed TFs of CD4+ T cells and CD8+ T cells. Human ISG score (top; blue), human TIL co-inhibitory receptors score (green), HIV specific T cell signature genes in progressive patients (yellow), and IL-27 driven co-inhibitory receptor regulators (orange) are shown for each TFs. b, Experimental workflow of Vpx-VLP supported lentiviral shRNA perturbation. Ex vivo isolated naïve CD4 T cells were transduced with Vpx-VLPs, followed by two times of lentiviral particle transduction before starting T cell activation. T cells were stimulated with anti-CD3/CD28 in the absence or presence of IFN-b (500 U/ml) for 96h and GFP positive cells were sorted by FACS. RNAs were extracted from sorted cells and applied for mRNA-seq. Perturbation for all 21 shRNAs are performed with human CD4+ T cells isolated from the same individual as in Figure 2. c, Gene knockdown efficiency is shown as relative expression over scramble shRNA transduced controls. Dotted line represents 60% of gene knockdown. d-f, PCA plots and biplots based on differentially expressed genes by perturbation. d, PCA plot demonstrating the two modules of TF regulators on perturbation with 21 TFs. Characterization of shRNA-based gene knockdown for each TF being plotted. Labels represent perturbed TF gene names. ‘IFN-I regulator module 1’ is colored in green and ‘IFN-I regulator module 2’ is in orange. e, f, PCA biplot showing differential regulation by modules of regulator TFs; e, for ISGs and f, for co-inhibitory receptors. Orange and green arrows (vectors) are highlighting two groups of genes effected inversely by the different modules of TFs.
Figure 4
Figure 4
Transcriptional regulatory network under IFN-I response a, Overview of regulatory network generation. A scheme of the pipeline, in order to generate preliminary regulatory network is generated from integrating the gene expression kinetics data coupled with TF-target gene datasets. The key regulators’ perturbatioi data was further integrated to refine the preliminary network. b, In depth view of the transcriptional regulation at each wave. Top row; the representation of regulatory networks highlighting TFs interaction. The thicker and darker an edge is the more TF-target connections it represents. Target genes are represented by up and down hexagons, according to their regulatory response to IFN-b. Middle row; heatmaps representing a ranking of the TFs based on ‘Cent’ stands for centrality and ‘HG’ stands for hypergeometric test. Bottom row; hierarchical backbone networks. Red circles represent up-regulated TFs, blue circles represent down-regulated TFs. c, Dynamics of TFs regulation across the transcriptional waves. Each hexagon represents targets from each transcriptional wave. Green circles represent regulatory TFs which are differentially expressed only in one transcriptional wave they are connected to, while purple circles represent bridging TFs, which are DE in all transcriptional waves they are connected to. The thicker and darker an edge is, the more TF-target connections it represents.
Figure 5
Figure 5
Integration of IFN-I regulatory network with T cells signature in COVID-19 a, UMAP representation of T cells from healthy control samples (n = 13) and COVID-19 samples (n = 18). 13 subcluster were identified. b, IFN-I score for CD4+ and CD8+ T cells across the three disease conditions. c, Heatmaps for co-inhibitory receptors expression in CD4+ and CD8+ T cells across the three disease conditions. d, Expression of key co-inhibitory receptors between control vs COVID-19 for CD4+ and CD8+ T cells. Average expression per subject for each gene is shown. *p < 0.05, **p < 0.01, ***p < 0.001. Kruskal-Wallis test. e, Correlation matrix of ISGs (dark gray) and co-inhibitory receptors (light gray) in CD4+ and CD8+ T cells in COVID-19 patients. f, IFN-I score for subsets of CD4+ and CD8+ T cells between control vs COVID-19. g, Heatmap showing co-inhibitory receptors expression for subsets of CD4+ and CD8+ T cells in COVID-19. h, Computed three transcriptional waves (early, intermediate, and late) score for the subsets of CD4+ and CD8+ T cells in COVID-19 patients. Scores were calculated based on upregulated DEGs of CD4+ and CD8+ T cells for each transcriptional wave. i, Regulatory relationship between regulators in intermediate phase network for LAG3 and TIGIT are shown. Positive regulation (TF to target) is highlighted in red and negative regulations in blue. j, Box plots showing expression of key regulators between control vs COVID-19 for CD4+ T cells. Average expression per subject for each gene is shown. *p < 0.05, **p < 0.01, ***p < 0.001. Kruskal-Wallis test. k, Regulatory relationship between regulators in late phase network for LAG3, HAVCR2, and PDCD1 are shown. Positive regulation (TF to target) is highlighted in red.

Similar articles

References

    1. Wang Y. et al. Timing and magnitude of type I interferon responses by distinct sensors impact CD8 T cell exhaustion and chronic viral infection. Cell Host Microbe 11, 631–642, doi:10.1016/j.chom.2012.05.003 (2012). - DOI - PMC - PubMed
    1. McLane L. M., Abdel-Hakeem M. S. & Wherry E. J. CD8 T Cell Exhaustion During Chronic Viral Infection and Cancer. Annu Rev Immunol 37, 457–495, doi:10.1146/annurev-immunol-041015-055318 (2019). - DOI - PubMed
    1. Chihara N. et al. Induction and transcriptional regulation of the co-inhibitory gene module in T cells. Nature 558, 454–459, doi:10.1038/s41586-018-0206-z (2018). - DOI - PMC - PubMed
    1. DeLong J. H. et al. IL-27 and TCR Stimulation Promote T Cell Expression of Multiple Inhibitory Receptors. Immunohorizons 3, 13–25, doi:10.4049/immunohorizons.1800083 (2019). - DOI - PMC - PubMed
    1. Gonzalez-Navajas J. M., Lee J., David M. & Raz E. Immunomodulatory functions of type I interferons. Nat Rev Immunol 12, 125–135, doi:10.1038/nri3133 (2012). - DOI - PMC - PubMed

Publication types