[Preprint]. 2021 Jun 7:2021.06.06.446826.
doi: 10.1101/2021.06.06.446826.

Evolution of enhanced innate immune evasion by the SARS-CoV-2 B.1.1.7 UK variant

Affiliations

Evolution of enhanced innate immune evasion by the SARS-CoV-2 B.1.1.7 UK variant

Lucy G Thorne et al. bioRxiv. .

Update in

  • Evolution of enhanced innate immune evasion by SARS-CoV-2.
    Thorne LG, Bouhaddou M, Reuschl AK, Zuliani-Alvarez L, Polacco B, Pelin A, Batra J, Whelan MVX, Hosmillo M, Fossati A, Ragazzini R, Jungreis I, Ummadi M, Rojc A, Turner J, Bischof ML, Obernier K, Braberg H, Soucheray M, Richards A, Chen KH, Harjai B, Memon D, Hiatt J, Rosales R, McGovern BL, Jahun A, Fabius JM, White K, Goodfellow IG, Takeuchi Y, Bonfanti P, Shokat K, Jura N, Verba K, Noursadeghi M, Beltrao P, Kellis M, Swaney DL, García-Sastre A, Jolly C, Towers GJ, Krogan NJ. Thorne LG, et al. Nature. 2022 Feb;602(7897):487-495. doi: 10.1038/s41586-021-04352-y. Epub 2021 Dec 23. Nature. 2022. PMID: 34942634 Free PMC article.

Abstract

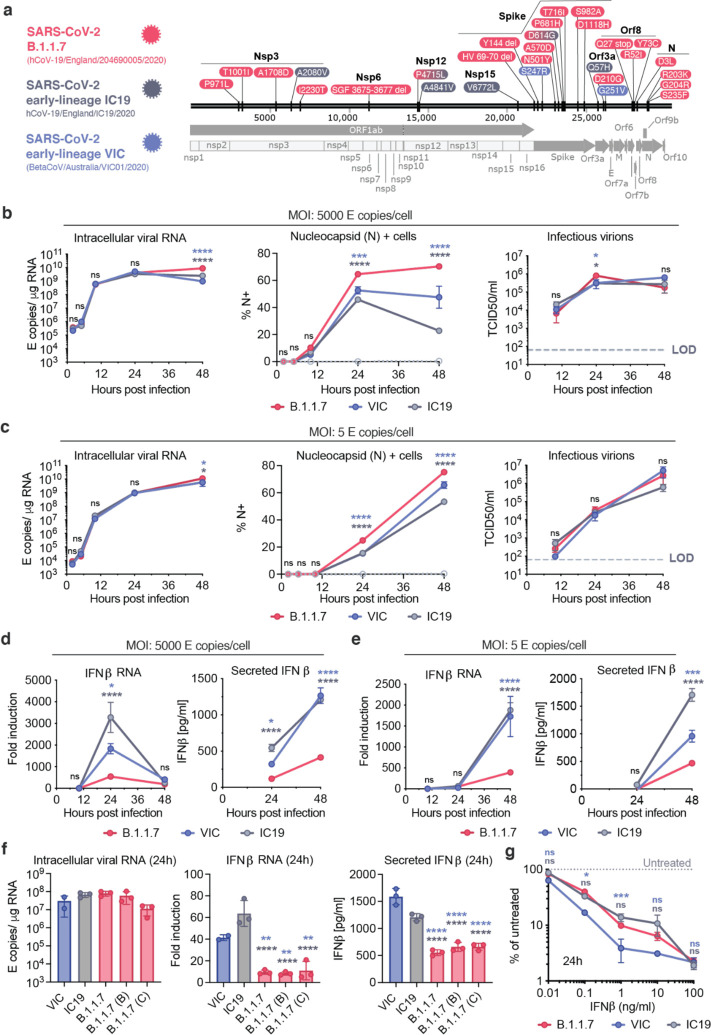
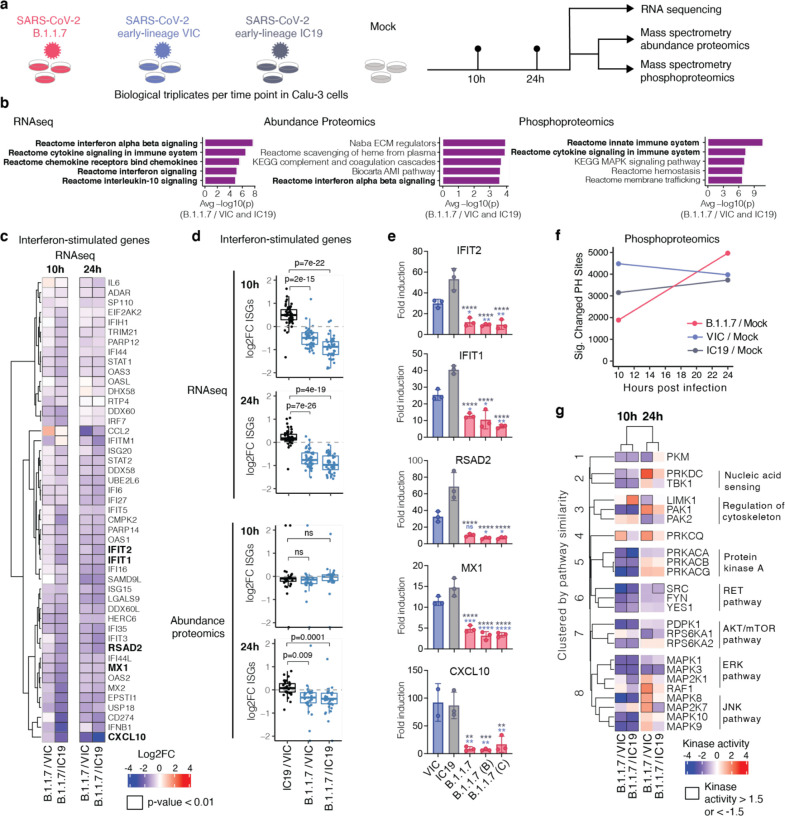
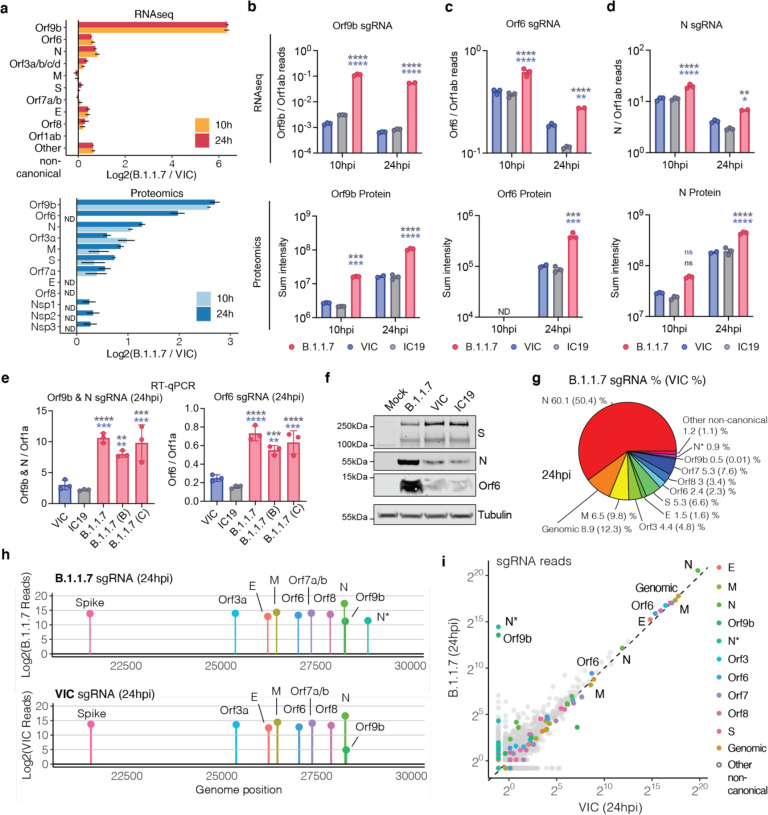
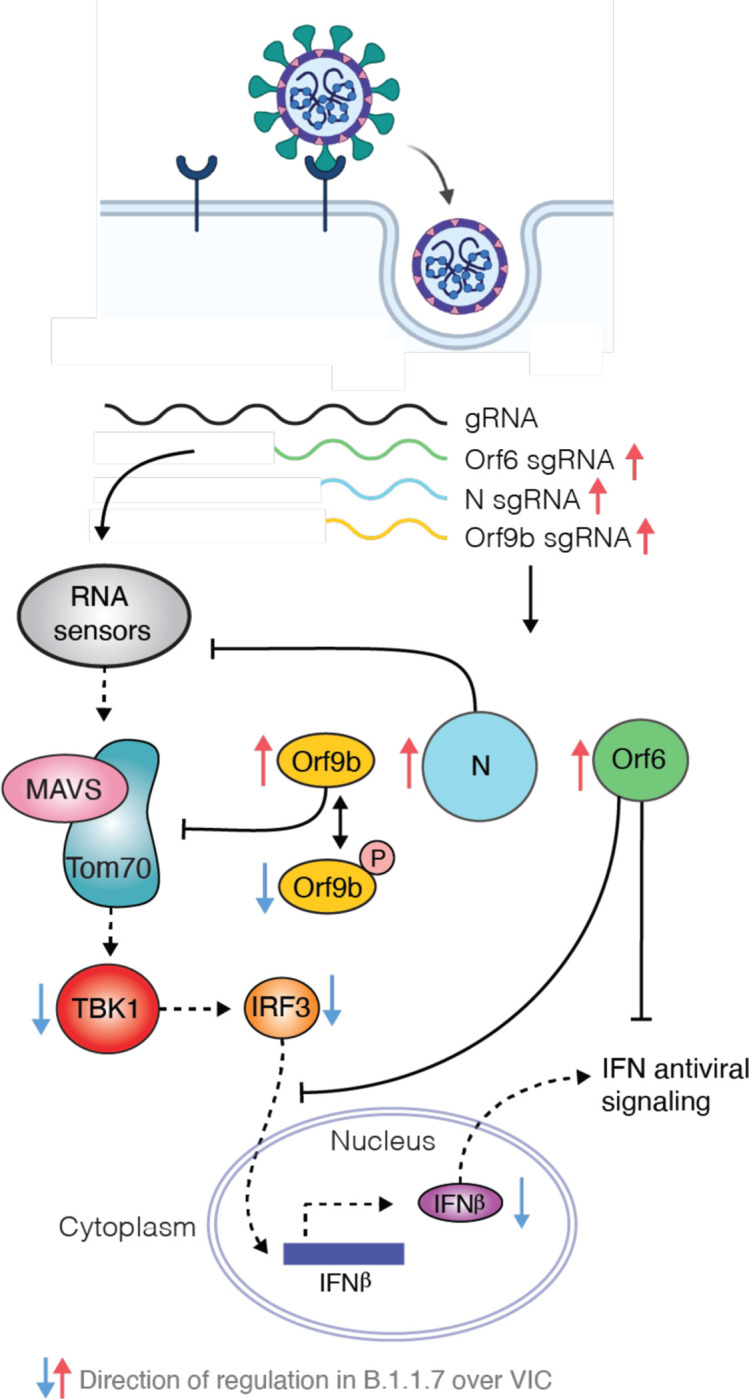
Emergence of SARS-CoV-2 variants, including the globally successful B.1.1.7 lineage, suggests viral adaptations to host selective pressures resulting in more efficient transmission. Although much effort has focused on Spike adaptation for viral entry and adaptive immune escape, B.1.1.7 mutations outside Spike likely contribute to enhance transmission. Here we used unbiased abundance proteomics, phosphoproteomics, mRNA sequencing and viral replication assays to show that B.1.1.7 isolates more effectively suppress host innate immune responses in airway epithelial cells. We found that B.1.1.7 isolates have dramatically increased subgenomic RNA and protein levels of Orf9b and Orf6, both known innate immune antagonists. Expression of Orf9b alone suppressed the innate immune response through interaction with TOM70, a mitochondrial protein required for RNA sensing adaptor MAVS activation, and Orf9b binding and activity was regulated via phosphorylation. We conclude that B.1.1.7 has evolved beyond the Spike coding region to more effectively antagonise host innate immune responses through upregulation of specific subgenomic RNA synthesis and increased protein expression of key innate immune antagonists. We propose that more effective innate immune antagonism increases the likelihood of successful B.1.1.7 transmission, and may increase in vivo replication and duration of infection.


Figures

Figure 1.
Figure 1.. SARS-CoV-2 B.1.1.7 antagonises innate immune activation more efficiently than early-lineage isolates.
a. SARS-CoV-2 viruses compared in this study. Protein coding changes in B.1.1.7 (red), IC19 (grey) and VIC (blue) are indicated in comparison to the Wuhan-Hu-1 reference genome (MN908947). B.1.1.7 changes include 23 lineage defining mutations, plus additional changes compared to Wuhan-Hu-1, totalling 29. b and c. Calu-3 cells were infected with either (b) 5000 E copies/cell or (c) 5 E copies/cell of B.1.1.7, VIC and IC19. Measurements of replication of SARS-CoV-2 genomic and subgenomic E RNAs (RT-qPCR) (left), % infection by intracellular nucleocapsid positivity (centre) or infectious virion production by TCID50/ml (right) over time are shown. d and e. Fold induction of IFNβ gene expression and protein secretion over time from cells in (b) and (c) respectively. f. Replication (24hpi), IFNβ induction (24hpi) and IFNβ secretion (48hpi) by multiple independent B.1.1.7 isolates compared to IC19 and VIC at 250 E copies/cell. g. SARS-CoV-2 infection at 2000 E copies/cell after 8h pre-treatment with IFNβ at the indicated concentrations. Infection is shown as intracellular N levels normalised to untreated controls at 24hpi. Data shown are mean +/− SEM of one of three representative experiments performed in triplicate. Statistical comparisons are performed by Two Way ANOVA (a,b,c,d,g) or One Way ANOVA with a Tukey post-comparison test (f). Blue stars indicate comparison between B.1.1.7 and VIC (blue lines and symbols), grey stars indicate comparison between B.1.1.7 and IC19 (grey lines and symbols). * (p<0.05), ** (p<0.01), *** (p<0.001), **** (p<0.0001). ns: non-significant. E: viral envelope gene. Hpi: hours post infection.
Figure 2.
Figure 2.. Global RNAseq and proteomics reveal innate immune suppression by B.1.1.7.
a. Calu-3 cells were infected with SARS-CoV-2 B.1.1.7 (red) or early lineages VIC (blue) and IC19 (grey) at 5000 E copies/cell or mock-infected. At 10 and 24hpi, samples were harvested for phosphoproteomics and abundance proteomics analysis using a data-independent acquisition (DIA) approach. Separate wells were harvested for total RNA-sequencing. b. Unbiased pathway enrichment analysis was performed to compare B.1.1.7 to VIC and IC19 (see Methods). The −log10(p-values) were averaged for enrichments using B.1.1.7/VIC and B.1.1.7 /IC19 at 10 and 24hpi (4 data points total) and used to rank terms. The top 5 terms for each data type are displayed. Terms associated with the innate immune system are bolded. c. Heatmap depicting log2 fold change (color) of interferon-stimulated genes (ISGs) comparing B.1.1.7 to VIC or IC19 at 10 and 24hpi (see Methods[RAK1] ). Squares outlined in black indicate a statistically significant fold change (p-value < 0.01). d. Box plots show log2 fold change of interferon stimulated genes (ISG) between B.1.1.7/VIC (blue), B.1.1.7/IC19 (blue) or IC19/VIC (black) in RNAseq and abundance proteomics dataset at 10 and 24hpi. Two-tailed student’s t-tests were performed for each comparison and p-values are displayed. e. Confirmatory RT-qPCR analysis of bolded ISGs from (a) expressed in Calu-3 cells infected with multiple B.1.1.7 isolates, VIC or IC19 at 2000 genomes/cell. f. The number of phosphorylation sites significantly dysregulated for B.1.1.7, VIC, or IC19 versus mock at 10 or 24hpi. Statistical significance was determined as absolute log2 FC > 1 and adjusted p-value < 0.05. g. Kinase activities for members of the top enriched terms for the phosphoproteomics dataset “Reactome innate immune system” (b, right), for each time point. Kinase activities were estimated from phosphoproteomics data using prior knowledge of kinase-substrate relationships. Kinases were clustered along the rows based on frequency of co-membership in pathway terms and manually annotated (see Methods). Data shown are mean +/− SEM (e). Statistical comparisons are performed by Two-tailed student’s t-tests (d) or Two Way ANOVA with a Tukey’s multiple comparisons post-test (e). Blue stars indicate comparison between B.1.1.7 and VIC (blue bars), grey stars indicate comparison between B.1.1.7 and IC19 (grey bars). * (p<0.05), ** (p<0.01), *** (p<0.001), **** (p<0.0001), or exact p-value are shown (d). ns: non-significant.
Figure 3.
Figure 3.. SARS-CoV-2 B.1.1.7 variant upregulates innate immune antagonists at the subgenomic RNA and protein level.
a. Log2 ratio of B.1.1.7 to VIC subgenomic RNA (sgRNA) containing a leader sequence normalised to total genomic RNA per time point and virus (top). Log2 ratio of B.1.1.7 to VIC viral proteins quantified as determined from the abundance proteomics dataset (bottom). Peptide intensities are summed per viral protein. Only peptides detected in both B.1.1.7 and VIC are used for quantification. Bars depict the mean of three biological replicates. ND: not detected. b. c. and d. Quantification of Orf9b (b), Orf6 (c) and N (d) sgRNA from RNAseq dataset. Counts are normalised to genomic RNA abundance at each time point and virus (top). Bottom panels show summed peptides per viral protein from proteomics dataset (no normalisation). e. Quantification of Orf9b & N (left) or Orf6 (right) sgRNA abundance via RT-qPCR in independent B.1.1.7 isolates, VIC, or IC19. f. Western blot of Orf6, N and S expression in Calu-3 cells infected with B.1.1.7, VIC, or IC19 at 24hpi. g. Pie chart depicting proportion of total sgRNA mapping to each viral sgRNA (containing leader sequence) for B.1.1.7. VIC percentages in parentheses. h. sgRNA log2 normalised counts (dot height) at 24hpi for B.1.1.7 (top) or VIC (bottom) projected onto their identified start sites on the SARS-CoV-2 genome. Only canonical and two non-canonical sgRNAs (Orf9b and N*) are depicted. All other non-canonical sgRNAs were excluded. i. Scatter plot of sgRNA abundance in B.1.1.7 or VIC at 24hpi. Grey dots indicated other non-canonical sgRNAs containing a leader sequence but no clear start codon. For (a-e), mean +/− SEM are shown. Statistical comparisons for (c-e) were performed by Two Way ANOVA with Tukey’s multiple comparisons post-test. * (p<0.05), ** (p<0.01), *** (p<0.001), **** (p<0.0001). ns: non-significant.
Figure 4.
Figure 4.. Orf9b binds TOM70 and antagonises innate immune activation downstream of RNA sensing.
a. Transcription factor (TF) activities in the 5 top enriched terms for the RNAseq dataset (Fig. 2b, left), for each time point. TFs are clustered hierarchically along rows based on activity magnitude. Squares outlined in black depict activities > 1.5 or < −1.5. b. IRF3 nuclear to cytoplasmic log2 ratio in cells infected with either B.1.1.7 of VIC at an MOI of 2000 E copies/cell at 24hpi measured by single cell immunofluorescence analysis. Shown are 1000 randomly sampled cells for each condition with a cut-off of 0.1>=<5. c. Cryogenic electron microscopy (Cryo-EM) of SARS-CoV-2 Orf9b (yellow) in complex with TOM70 (blue) from Gordon et al. (2020b). Highlighted in red are serines (S50 and S53) in Orf9b in the TOM70 binding site. d. Co-immunoprecipitation of streptavidin-tagged wild-type (WT) Orf9b, and various Orf9b point mutants expressed in HEK293T cells with Flag-TOM70. Forward slash indicates the presence of both mutations. e. ISG56-reporter activation by poly:IC in the presence of Orf9b WT, Orf9b S50/53E or empty vector (EV) expression in HEK293T cells. f. Model schematic depicting proposed mechanism of innate immune antagonism by Orf9b. (i) When S53 is unphosphorylated, Orf9b binds to TOM70 and inhibits its activity in innate immune signaling. Conversely, (ii) when Orf9b is phosphorylated on S53, it can no longer interact with TOM70 and is unable to antagonise innate immune activation. g. Ratio between the intensity of Orf9b peptide phosphorylated on S53 and total Orf9b (as calculated in Fig. 3b, bottom) from phospho- and abundance proteomics of Calu-3 cells infected with indicated viruses for either 10 or 24 hpi (as depicted in Fig. 2a). h. ISG56-reporter activation by poly:IC in the presence of N (VIC), N (B.1.1.7) or empty vector (EV) expression in HEK293T cells. Statistical comparisons are performed by Mann-Whitney Test comparison (b), Two Way ANOVA with Tukey’s multiple comparison post test (e,g,h). For (e) black stars indicate the comparison between ORF9b WT and ORF9b S50/53E, For (g), blue stars indicate comparison between B.1.1.7 and VIC (blue bars). For (h), blue stars indicate comparison between VIC and EV and red stars indicate comparison between B.1.1.7 and EV. * (p<0.05), ** (p<0.01), *** (p<0.001), **** (p<0.0001).
Figure 5.
Figure 5.. Model schematic depicting how B.1.1.7 antagonises innate immune activation.
Highly transmissible SARS-CoV-2 B.1.1.7 has evolved to more effectively antagonise the innate immune response. SARS-CoV-2 wave one isolates activate a delayed innate response in airway epithelial cells relative to rapid viral replication, indicative of viral antagonism of innate immune responses early in infection. It is known that Orf9b, Orf6 and N are innate immune antagonists, acting at different levels to inhibit RNA sensing. Orf6 inhibits IRF3 and STAT1 nuclear translocation,, N prevents activation of RNA sensor RIG-I and here we show that Orf9b inhibits RNA sensing through interaction with TOM70 regulated by phosphorylation. We find that B.1.1.7 has evolved to produce more sgRNA for these key innate immune antagonists leading to increased protein levels and enhanced innate immune antagonism as compared to first wave isolates.

References

    1. Galloway S. E. et al. Emergence of SARS-CoV-2 B.1.1.7 Lineage — United States, December 29, 2020–January 12, 2021. MMWR. Morbidity and Mortality Weekly Report vol. 70 95–99 (2021). - PMC - PubMed
    1. Volz E. et al. Assessing transmissibility of SARS-CoV-2 lineage B.1.1.7 in England. Nature 593, 266–269 (2021). - PubMed
    1. Davies N. G. et al. Estimated transmissibility and impact of SARS-CoV-2 lineage B.1.1.7 in England. Science 372, (2021). - PMC - PubMed
    1. Washington N. L. et al. Emergence and rapid transmission of SARS-CoV-2 B.1.1.7 in the United States. Cell 184, 2587–2594.e7 (2021). - PMC - PubMed
    1. Davies N. G. et al. Increased mortality in community-tested cases of SARS-CoV-2 lineage B.1.1.7. Nature 593, 270–274 (2021). - PMC - PubMed

Publication types