[Preprint]. 2021 Jun 16:2021.06.07.447287.
doi: 10.1101/2021.06.07.447287.

Implicating Gene and Cell Networks Responsible for Differential COVID-19 Host Responses via an Interactive Single Cell Web Portal

Affiliations

Implicating Gene and Cell Networks Responsible for Differential COVID-19 Host Responses via an Interactive Single Cell Web Portal

Kang Jin et al. bioRxiv. .

Update in

Abstract

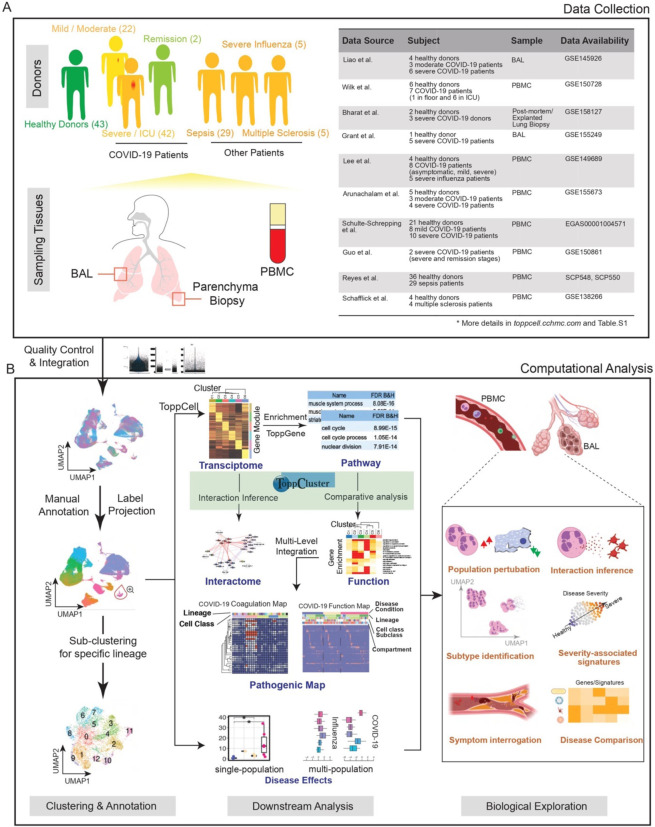
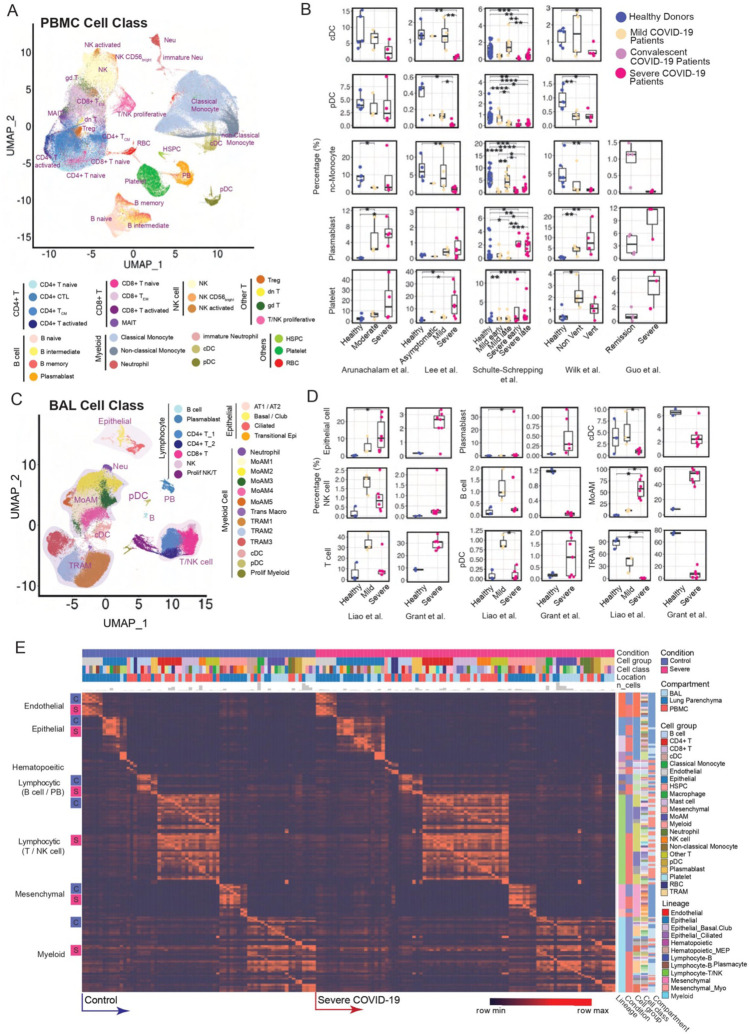
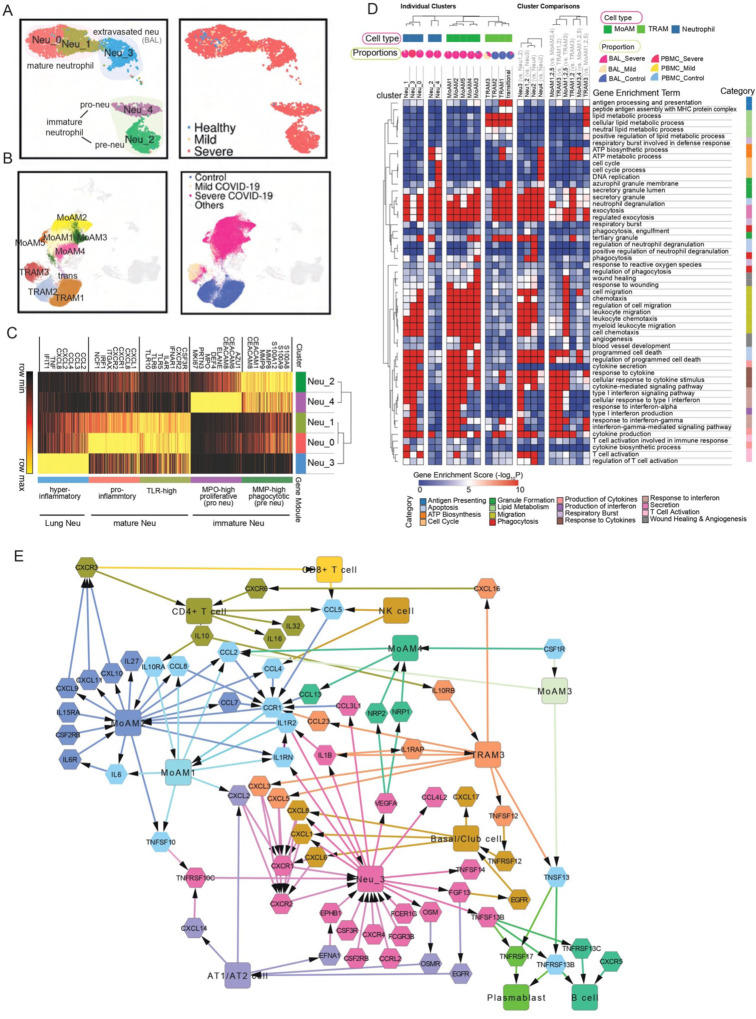
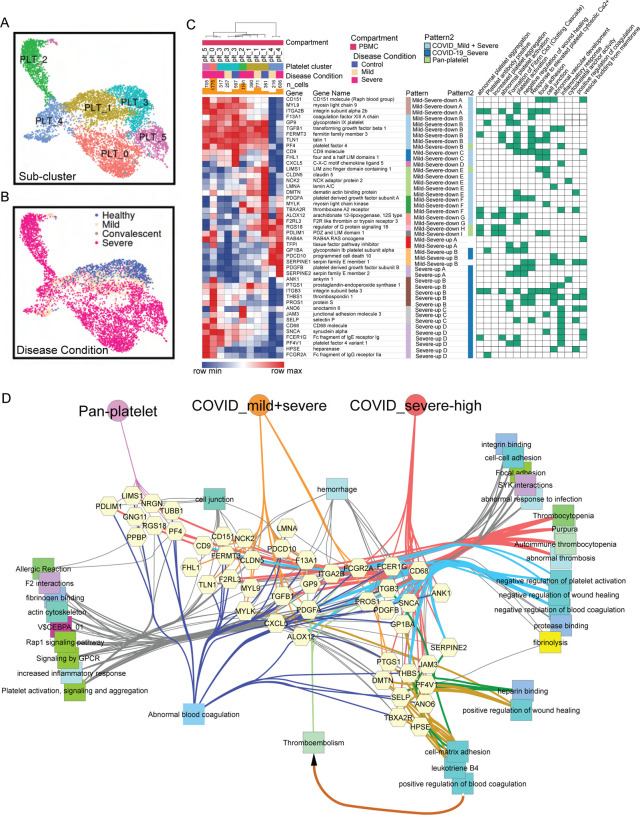
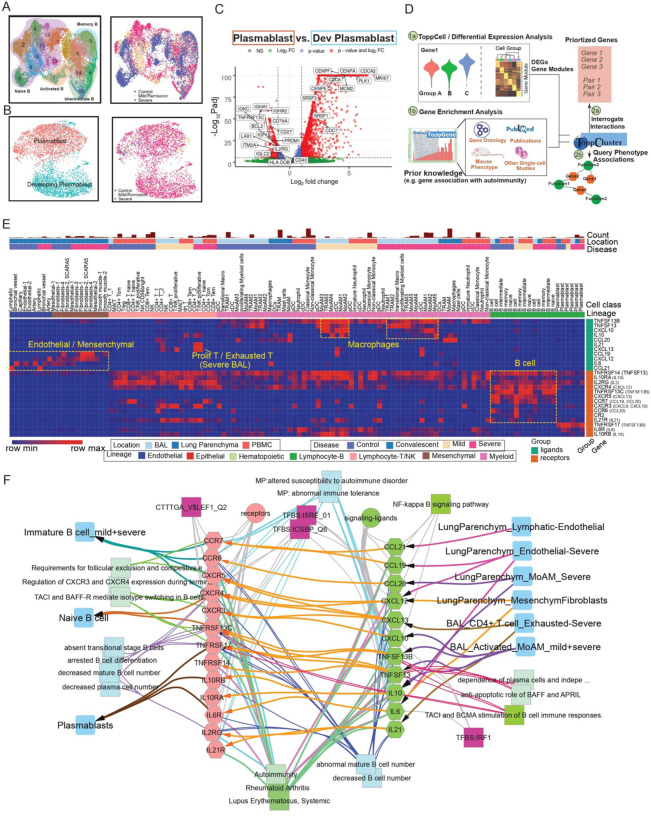
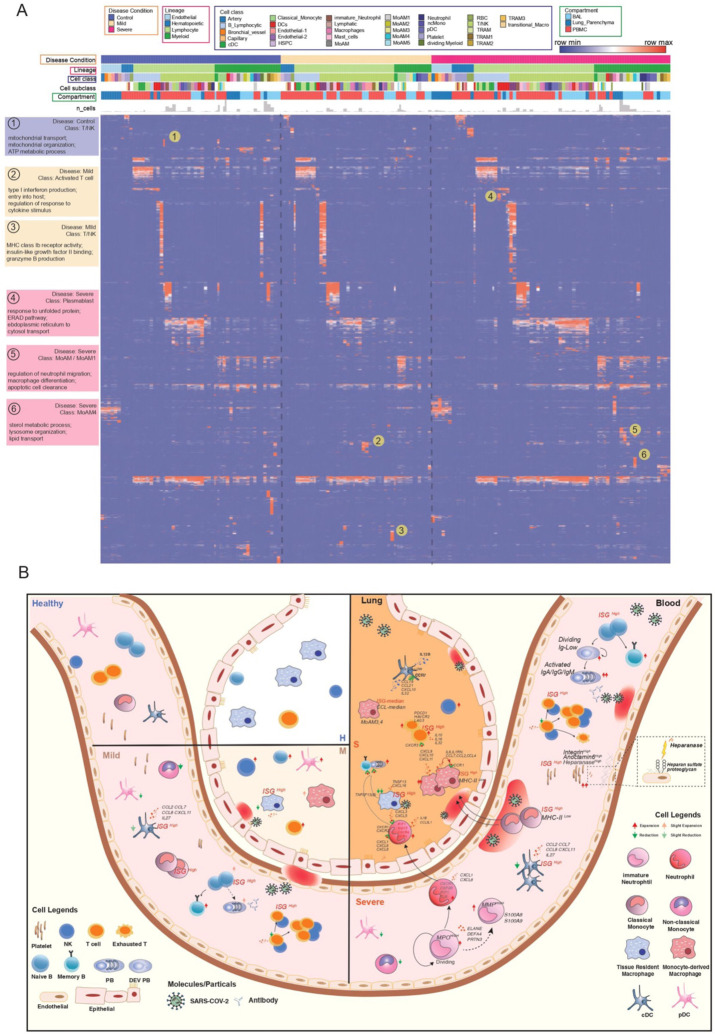
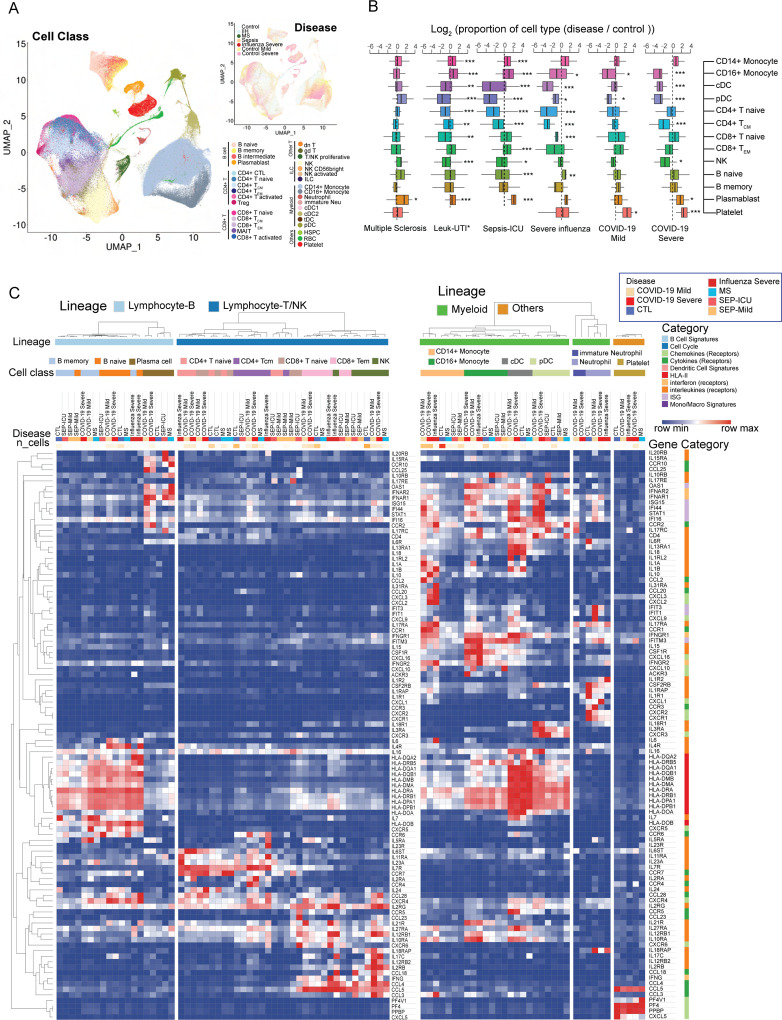
Numerous studies have provided single-cell transcriptome profiles of host responses to SARS-CoV-2 infection. Critically lacking however is a datamine that allows users to compare and explore cell profiles to gain insights and develop new hypotheses. To accomplish this, we harmonized datasets from COVID-19 and other control condition blood, bronchoalveolar lavage, and tissue samples, and derived a compendium of gene signature modules per cell type, subtype, clinical condition, and compartment. We demonstrate approaches to probe these via a new interactive web portal (http://toppcell.cchmc.org/COVID-19). As examples, we develop three hypotheses: (1) a multicellular signaling cascade among alternatively differentiated monocyte-derived macrophages whose tasks include T cell recruitment and activation; (2) novel platelet subtypes with drastically modulated expression of genes responsible for adhesion, coagulation and thrombosis; and (3) a multilineage cell activator network able to drive extrafollicular B maturation via an ensemble of genes strongly associated with risk for developing post-viral autoimmunity.

Keywords: COVID-19; SARS-CoV-2; antiviral host defense; autoimmune disorder; bronchoalveolar lavage; host-pathogen cell atlas; inflammatory thrombosis; interactive datamining; platelets; single-cell RNA-seq; systems biology.


Conflict of interest statement

Declaration of Interests The authors declare no competing interests.

Figures

Fig. 1.
Fig. 1.. Creating a COVID-19 Signature Atlas.
(A) Representative aggregation of multiple single-cell RNA-sequencing datasets from COVID-19 and related studies. The present study is derived from a total of 231,800 peripheral blood mononuclear cells (PBMCs), 101,800 bronchoalveolar lavage (BAL) cells and 146,361 lung parenchyma cells from 43 healthy; 22 mild, 42 severe, and 2 convalescent patients. Data was collated from eight public datasets (right). (B) Data analysis pipeline of the study using Topp-toolkit. It includes three phases: (1) clustering and annotation; (2) downstream analysis using Topp-toolkit; (3) biological exploration. Output includes the evaluation of abundance of cell populations, cell type (cluster) specific gene modules, functional associations of disease-associated cell classes and clusters, inference of cell-cell interactions, as well as comparative analysis across diseases, including influenza, sepsis and multiple sclerosis. Additional newer datasets not included in this manuscript are present and will continue to be added to ToppCell (http://toppcell.cchmc.org).
Fig. 2.
Fig. 2.. Modularized representation of cell type specific gene signatures and dynamic changes of cell abundance.
(A) Uniform Manifold Approximation and Projection (UMAP) of 28 distinct cell types identified in the integrated peripheral blood mononuclear cell (PBMC) data. (B) Comparative analysis of cell abundance effects of COVID-19. Reproducible multi-study data present high impact effects on 5 cell types in PBMC. Percentages of selected cell types in each sample are shown (where Vent: Ventilated patients; Non Vent: Non-ventilated patients). Significance between two conditions was measured by the Mann-Whitney rank sum test (Wilcoxon, paired=False), which was also used in following significance tests of cell abundance changes in this study. *: p <= 0.05; **: p <= 0.01; ***: p <= 0.001; ****: p <= 0.0001. (C) UMAP of 24 distinct cell types identified in the integrated BAL data. (D) Dynamic changes of cell abundances for cell types in two bronchoalveolar lavage (BAL) single-cell datasets. (E) ToppCell allows for gene signatures to be hierarchically organized by lineage, cell type, subtype, and disease condition. The global heatmap shows gene modules with top 50 upregulated genes (student t test) for each cell type in a specific disease condition and compartment. Gene modules from control donors and severe COVID-19 patients were included in the figure.
Fig. 3.
Fig. 3.. Functional analysis of compartment-specific immature and subtype-differentiated neutrophils and monocytic macrophages in COVID-19 patients.
(A) Five sub-clusters and three cell groups were identified after the integration of neutrophils in peripheral blood mononuclear cells (PBMC) and bronchoalveolar lavage (BAL) (Left). The distribution of compartments is shown on the right. (B) Sub-clusters (Left) and COVID-19 conditions (Right) of monocyte-derived macrophages and tissue-resident macrophages were identified after integration of BAL datasets. (C) Heatmap of gene modules from ToppCell with top 200 upregulated genes for each neutrophil sub-cluster. Important neutrophil-associated genes and inferred roles of sub-clusters were shown on two sides. (D) Heatmap of associations between subclusters of neutrophils and macrophages and myeloid-cell-associated pathways (Gene Ontology). Gene modules with 200 upregulated genes for sub-clusters were used for enrichment in ToppCluster. Additionally, enrichment of top 200 differentially expressed genes (DEGs) for comparisons in fig. S5D and fig. S6B were appended on the right. Gene enrichment scores, defined as −log10(adjusted p-value), were calculated as the strength of associations. Pie charts showed the proportions of COVID-19 conditions in each cluster. (E) Gene interaction network in the BAL of severe patients. Highly expressed ligands and receptors of each cell type were drawn based on fig. S8. Interaction was inferred using both CellChat database and embedded cell interaction database in ToppCell.
Fig. 4.
Fig. 4.. COVID-19 driven reprogramming of platelets leads to drastically altered expression of genes associated with platelet adhesion, activation, coagulation and thrombosis.
(A-B) Uniform Manifold Approximation and Projections (UMAPs) show distributions of sub-clusters (A) and COVID-19 conditions (B) of platelets after the integration of PBMC datasets. (C) Severity-associated coagulation genes were selected and shown on the heatmap, with disease and sub-cluster specific gene patterns identified and labeled. Their functional associations with coagulation pathways were retrieved from ToppGene and shown on the right. (D) Functional and phenotypical associations of coagulation-association genes in each gene pattern from (B). Associations were retrieved from ToppGene enrichment. Fibrinolysis is highlighted.
Fig. 5.
Fig. 5.. Implicating a multi-lineage cell network capable of driving extrafollicular B cell maturation and the emergence of humoral autoimmunity in COVID-19 patients.
(A) Uniform Manifold Approximation and Projections (UMAPs) of sub-clusters (Left) and COVID-19 conditions (Right) of B cells after integration of peripheral blood mononuclear cells (PBMC) and bronchoalveolar lavage (BAL) datasets. (B) UMAPs of subtypes (Left) and COVID-19 conditions (Right) of plasmablasts after integration of PBMC and BAL datasets. (C) Volcano plot depicts differentially expressed genes between plasmablasts and developing plasmablasts. Student t-tests were applied and p values were adjusted by the Benjamini-Hochberg procedure. (D) Workflow of discovering and prioritizing candidate genes related to a disease-specific phenotype with limited understanding. (E) The heatmap shows the normalized expression levels of candidate ligands and receptors for COVID-19 autoimmunity in multiple compartments in healthy donors and COVID-19 patients. Binding ligands of receptor genes were shown in parentheses on the right. Hot spots of expression are highlighted. (F) Network analysis of autoimmunity-associated gene expression by COVID-19 cell types. Prior knowledge associated gene associations include GWAS, OMIM, mouse knockout phenotype, and additional recent manuscripts were selected from ToppGene enrichment results of differentially expressed ligands and receptors and shown on the network. Orange arrows present the interaction directions from ligands (green) to receptors (pink) on B cells. Annotations for these genes, including single-cell co-expression (blue), mouse phenotype (light blue), transcription factor binding site (purple) and signaling pathways (green) are shown.
Fig. 6.
Fig. 6.. Comparative analysis of cell type specific gene signatures associated with lineage, class, subclass, compartment, and disease state in the COVID-19 atlas.
(A) Enrichment scores of gene modules for all cell types across different compartments and COVID-19 conditions were generated by ToppCluster and shown on the heatmap. ToppCluster enriched functions from Gene Ontology, Human Phenotype, Mouse Phenotype, Pathway and Interaction databases were used to generate a feature matrix (cell types by features) and hierarchically clustered. Hot spots of the disease-specific enrichments were highlighted and details were shown on the left. More details can be found in Methods. (B) Summarizing predicted functions and interplay of immune cells in COVID-19 blood and lung. Aforementioned key observations in this study were shown in peripheral blood mononuclear cells (PBMC) and bronchoalveolar lavage (BAL) in healthy donors, mild and severe COVID-19 patients, including changes of cell abundance, specific marker genes, upregulated secretion, cell development and cell-cell interactions.
Fig. 7.
Fig. 7.. Comparative analysis of differentially-expressed immunoregulatory genes between COVID-19 and other immune-mediated diseases.
(A) Uniform Manifold Approximation and Projection (UMAP) shows the distributions of cell types (Left) and diseases (Top right) after the integration of datasets in multiple studies. MS: multiple sclerosis; IIH: idiopathic intracranial hypertension. IIH patients were recruited as controls in the multiple sclerosis study. (B) Dynamic changes of immune cell types in different immune-mediated diseases compared to healthy controls. Log2(ratio) was calculated to show the levels of changes. *, p<0.05, **, p<0.01, ***, p<0.001. Statistical models can be found in the Methods. Leuk-UTI: sepsis patients that enrolled into UTI with leukocytosis (blood WBC ≥ 12,000 per mm3) but no organ dysfunction. (C) Normalized expression values of key genes involved in immune signaling and responses are shown for cell types across multiple diseases. Lowly expressed genes (maximal average expression level across all cell types in the heatmap is less than 0.5 after Log2CPM normalization) were removed.

Similar articles

References

    1. Aid M., Busman-Sahay K., Vidal S.J., Maliga Z., Bondoc S., Starke C., Terry M., Jacobson C.A., Wrijil L., Ducat S., et al. (2020). Vascular Disease and Thrombosis in SARS-CoV-2-Infected Rhesus Macaques. Cell 183, 1354–1366.e13. - PMC - PubMed
    1. Arazi A., Rao D.A., Berthier C.C., Davidson A., Liu Y., Hoover P.J., Chicoine A., Eisenhaure T.M., Jonsson A.H., Li S., et al. (2019). The immune cell landscape in kidneys of patients with lupus nephritis. Nat. Immunol. 20, 902–914. - PMC - PubMed
    1. Arunachalam P.S., Wimmers F., Mok C.K.P., Perera R.A.P.M., Scott M., Hagan T., Sigal N., Feng Y., Bristow L., Tak-Yin Tsang O., et al. (2020). Systems biological assessment of immunity to mild versus severe COVID-19 infection in humans. Science 369, 1210–1220. - PMC - PubMed
    1. Aust G., Sittig D., Becherer L., Anderegg U., Schütz A., Lamesch P., and Schmücking E. (2004). The role of CXCR5 and its ligand CXCL13 in the compartmentalization of lymphocytes in thyroids affected by autoimmune thyroid diseases. Eur. J. Endocrinol. 150, 225–234. - PubMed
    1. Barnes B.J., Adrover J.M., Baxter-Stoltzfus A., Borczuk A., Cools-Lartigue J., Crawford J.M., Daßler-Plenker J., Guerci P., Huynh C., Knight J.S., et al. (2020). Targeting potential drivers of COVID-19: Neutrophil extracellular traps. J. Exp. Med. 217. - PMC - PubMed

Publication types