

This is a preprint.
Ecological Analysis of the Temporal Trends in the Association of Social Vulnerability and Race/Ethnicity with County-Level COVID-19 Incidence and Outcomes in the United States
- PMID: 34127982
- PMCID: PMC8202439
- DOI: 10.1101/2021.06.04.21258355
Ecological Analysis of the Temporal Trends in the Association of Social Vulnerability and Race/Ethnicity with County-Level COVID-19 Incidence and Outcomes in the United States
Update in
-
Temporal trends in the association of social vulnerability and race/ethnicity with county-level COVID-19 incidence and outcomes in the USA: an ecological analysis.BMJ Open. 2021 Jul 22;11(7):e048086. doi: 10.1136/bmjopen-2020-048086. BMJ Open. 2021. PMID: 34301657 Free PMC article.
Abstract
Background: The COVID-19 pandemic adversely affected the socially vulnerable and minority communities in the U.S. initially, but the temporal trends during the year-long pandemic remain unknown.
Objective: We examined the temporal association between the county-level Social Vulnerability Index (SVI), a percentile-based measure of social vulnerability to disasters, its subcomponents and race/ethnic composition with COVID-19 incidence and mortality in the U.S. in the year starting in March 2020.
Methods: Counties (n=3091) with ≥ 50 COVID-19 cases by March 6th, 2021 were included in the study. Associations between SVI (and its subcomponents) and county level racial composition with the incidence and death per capita were assessed by fitting a negative-binomial mixed-effects model. This model was also used to examine potential time varying associations between weekly number of cases/deaths and SVI or racial composition. Data was adjusted for percentage of population aged ≥65 years, state level testing rate, comorbidities using the average Hierarchical Condition Category (HCC) score, and environmental factors including average fine particulate matter (PM2.5), temperature and precipitation.
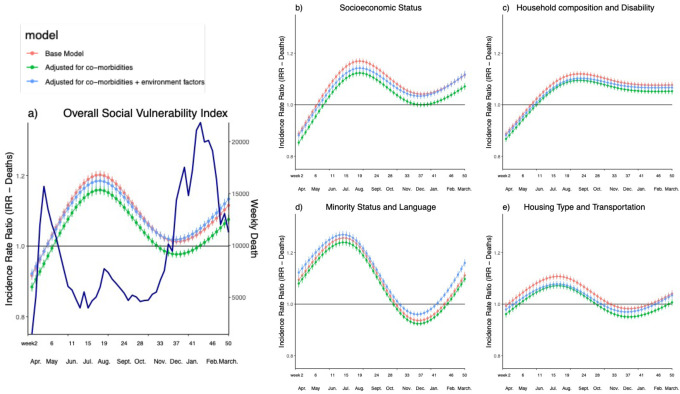
Results: Higher SVI, indicative of greater social vulnerability, was independently associated with higher COVID-19 incidence (adjusted incidence rate ratio [IRR] per-10 percentile increase:1.02, (95% CI 1.02, 1.03, p<0.001), and death per capita (1.04, (95% CI 1.04, 1.05, p<0.001). SVI became an independent predictor of incidence starting from March 2020, but this association became weak or insignificant by the winter, a period that coincided with a sharp increase in infection rates and mortality, and when counties with higher proportion of White residents were disproportionately represented ("third wave"). By Spring of 2021, SVI was again a predictor of COVID-19 outcomes. Counties with greater proportion of Black residents also observed similar temporal trends COVID-19-related adverse outcomes. Counties with greater proportion of Hispanic residents had worse outcomes throughout the duration of the analysis.
Conclusion: Except for the winter "third wave" when majority White communities had the highest incidence of cases, counties with greater social vulnerability and proportionately higher minority populations, experienced worse COVID-19 outcomes.
Figures


References
-
- Link BG. Epidemiological sociology and the social shaping of population health. Journal of health and social behavior. 2008;49(4):367–384. - PubMed
-
- Drago R, Miller K. Sick at work: infected employees in the workplace during the H1N1 pandemic. Institute for Women’s Policy Research. 2010(B264).
-
- Leclere FB, Jensen L, Biddlecom AE. Health care utilization, family context, and adaptation among immigrants to the United States. Journal of health and social behavior. 1994:370–384. - PubMed
Publication types
Grants and funding
LinkOut - more resources
Full Text Sources