. 2021 Jul;78(14):5647-5663.
doi: 10.1007/s00018-021-03861-3. Epub 2021 Jun 15.

Inhibitory control in neuronal networks relies on the extracellular matrix integrity

Affiliations

Inhibitory control in neuronal networks relies on the extracellular matrix integrity

Egor Dzyubenko et al. Cell Mol Life Sci. 2021 Jul.

Abstract

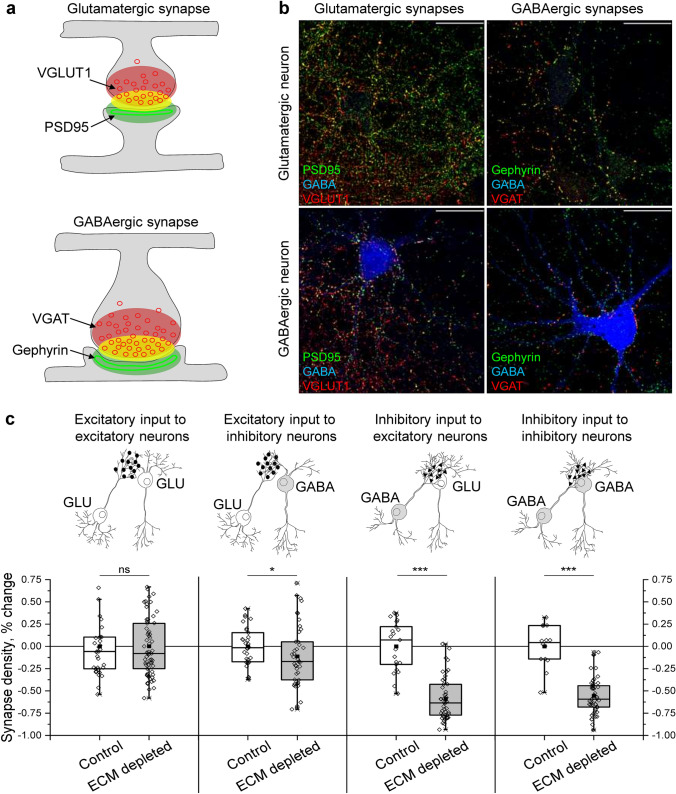
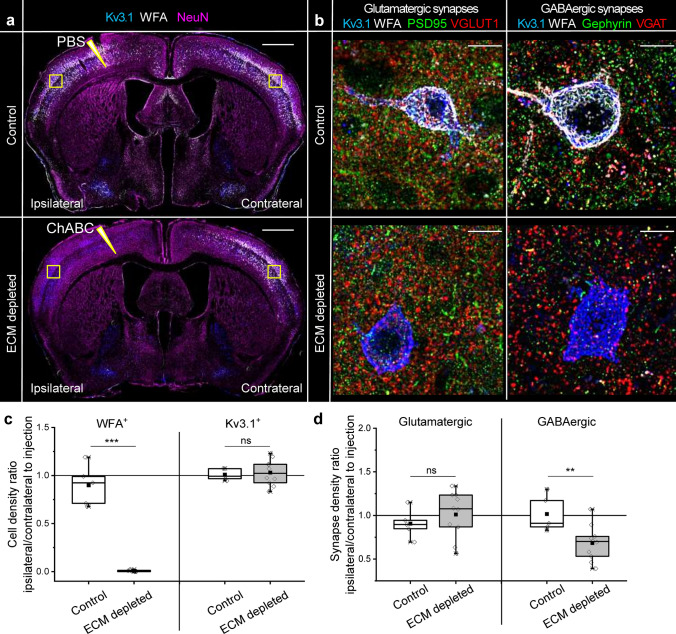
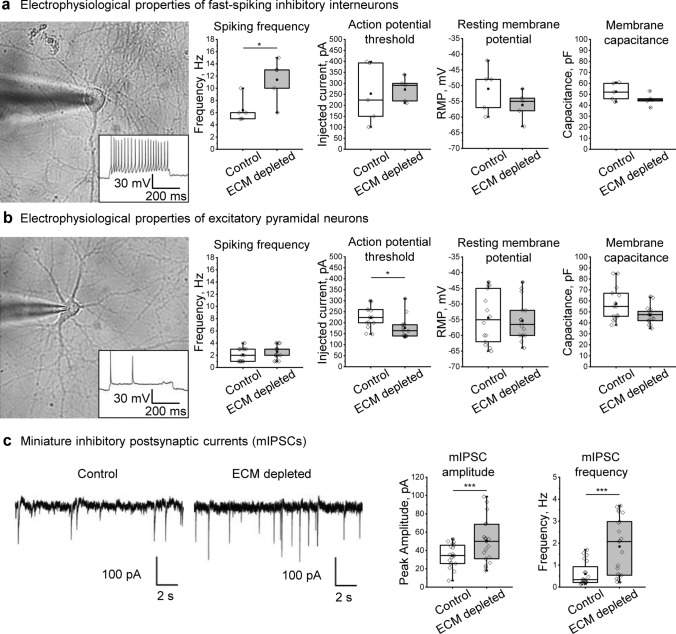
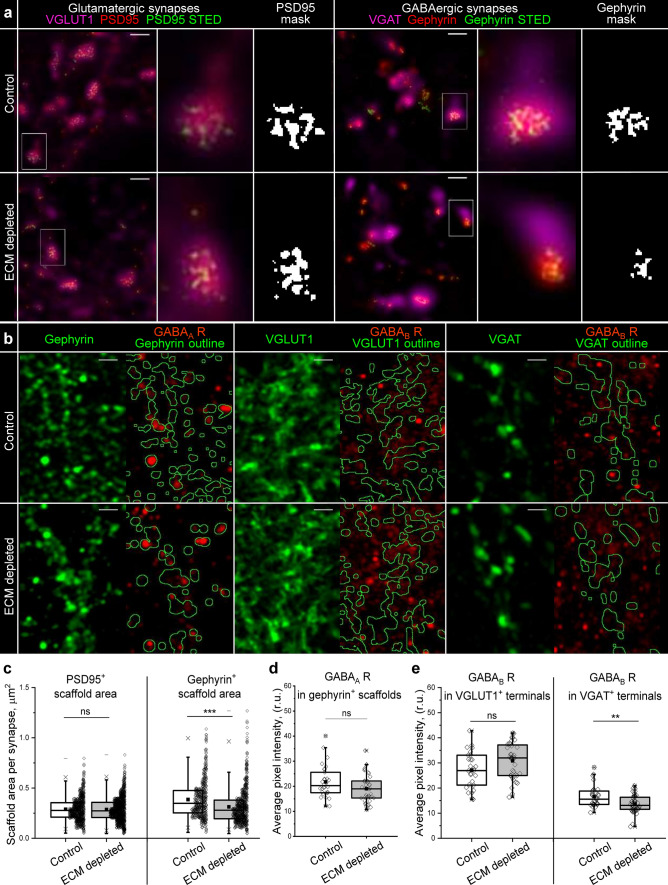
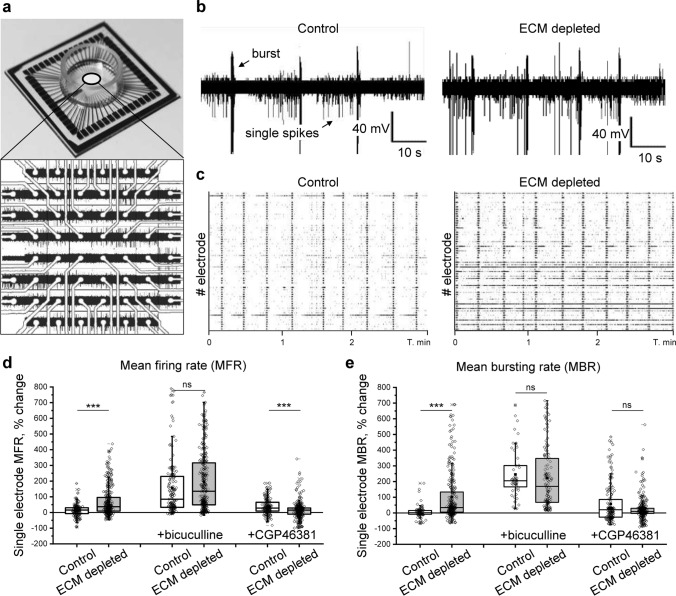
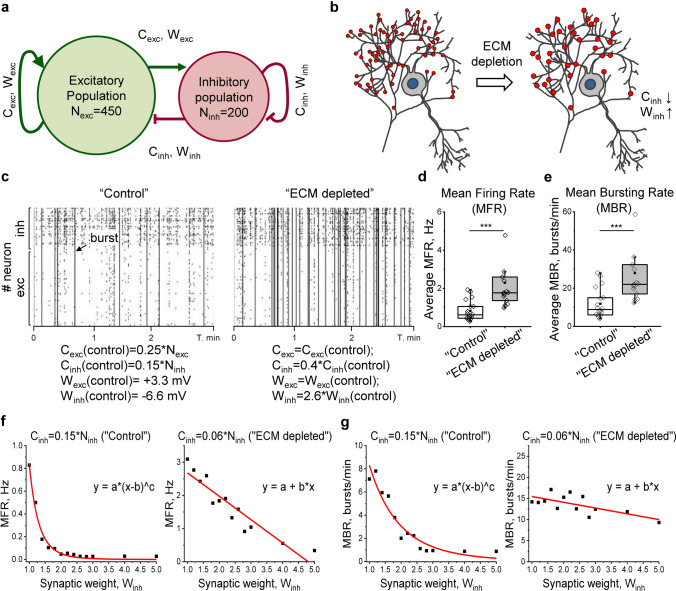
Inhibitory control is essential for the regulation of neuronal network activity, where excitatory and inhibitory synapses can act synergistically, reciprocally, and antagonistically. Sustained excitation-inhibition (E-I) balance, therefore, relies on the orchestrated adjustment of excitatory and inhibitory synaptic strength. While growing evidence indicates that the brain's extracellular matrix (ECM) is a crucial regulator of excitatory synapse plasticity, it remains unclear whether and how the ECM contributes to inhibitory control in neuronal networks. Here we studied the simultaneous changes in excitatory and inhibitory connectivity after ECM depletion. We demonstrate that the ECM supports the maintenance of E-I balance by retaining inhibitory connectivity. Quantification of synapses and super-resolution microscopy showed that depletion of the ECM in mature neuronal networks preferentially decreases the density of inhibitory synapses and the size of individual inhibitory postsynaptic scaffolds. The reduction of inhibitory synapse density is partially compensated by the homeostatically increasing synaptic strength via the reduction of presynaptic GABAB receptors, as indicated by patch-clamp measurements and GABAB receptor expression quantifications. However, both spiking and bursting activity in neuronal networks is increased after ECM depletion, as indicated by multi-electrode recordings. With computational modelling, we determined that ECM depletion reduces the inhibitory connectivity to an extent that the inhibitory synapse scaling does not fully compensate for the reduced inhibitory synapse density. Our results indicate that the brain's ECM preserves the balanced state of neuronal networks by supporting inhibitory control via inhibitory synapse stabilization, which expands the current understanding of brain activity regulation.

Keywords: E-I balance; ECM; Electrophysiology; Inhibitory synapse; Neuronal network activity.


Conflict of interest statement

The authors declare no conflict of interest.

Figures

Fig. 1
Fig. 1
Excitatory and inhibitory synapse densities decrease after ECM depletion in vitro. a Overlapping immunolabelling of presynaptic (red) and postsynaptic (green) markers was used to detect structurally complete synapses (yellow). b The density of glutamatergic (PSD95-VGLUT1) and GABAergic (gephyrin-VGAT) synapses was measured with reference to GABA immunoreactivity. Representative micrographs are shown. Scale bars, 30 µm. c Synapse density changes were calculated as differences with mean values of corresponding control experiments. Data are shown for each neuron examined (n ≥ 20 neurons per condition, results obtained from 5 independent experiments). GLU glutamate. Data are medians (lines inside boxes)/ means (filled squares inside boxes) ± IQR (boxes) with 10/ 90% ranks as whiskers. Open diamonds are data points. The asterisks indicate significant differences with control, based on Kruskal–Wallis tests (***p < 0.001, **p < 0.01). ns not significant
Fig. 2
Fig. 2
Inhibitory synapse density decreases after ECM depletion in vivo. a Neuronal nuclei (NeuN, magenta), fast spiking interneurons (Kv3.1, blue) and PNNs (WFA, Wisteria floribunda agglutinin, white) were immunohistochemically labeled in brain sections obtained from mice treated with chondroitinase ABC (ChABC, ECM depleted) or phosphate buffered saline (PBS, control) for 16 h. Sharp triangles indicate intracortical injection sites. Squares indicate the regions in which cell and synapse densities were analyzed. Scale bar, 1 mm. b The density of glutamatergic (PSD95-VGLUT1) and GABAergic (gephyrin-VGAT) synapses was measured in somatosensory cortex layers 3–5. Maximum projections of 56.7 × 56.7x5 μm regions ipsilateral to the injection sites are shown. Scale bars, 10 µm. c Changes in PNN+ and Kv3.1+ neuron densities were quantified as ipsilateral to contralateral ratios. d Changes in glutamatergic and GABAergic synapse densities were calculated as ipsilateral to contralateral ratios. Data are shown for each animal examined (n ≥ 5 animals per condition). Data are medians (lines inside boxes)/ means (filled squares inside boxes) ± interquartile ranges (IQR; boxes) with 10/ 90% ranks as whiskers. Open diamonds are data points. The asterisks indicate significant differences with control, based on Kruskal–Wallis tests (***p < 0.001, **p < 0.01). ns not significant
Fig. 3
Fig. 3
ECM depletion affects electrophysiological properties in single neurons and strengthens inhibitory synapses. Spiking frequency, action potential threshold, resting membrane potential, and membrane capacitance were evaluated in the fast-spiking inhibitory interneurons (a) and the excitatory neurons (b). The results were obtained from 5 independent experiments. c Patch clamp recordings in presence of sodium channel blocker (TTX) and glutamate receptor antagonists (DNQX and D-AP5) reveal miniature inhibitory postsynaptic currents (mIPSCs). Representative current tracks exemplify mIPSCs detected in control and ECM depleted cultures. Quantifications of mIPSC amplitude and frequency indicate that ECM depletion increased the total inhibitory input to single neurons (n ≥ 19 neurons per condition, results obtained from 5 independent experiments). Data are medians (lines inside boxes)/ means (filled squares inside boxes) ± IQR (boxes) with 10/ 90% ranks as whiskers. Open diamonds are data points. The asterisks indicate significant differences with control, based on Kruskal–Wallis tests (*p < 0.05, ***p < 0.001)
Fig. 4
Fig. 4
ECM depletion alters the pre- and postsynaptic organization of inhibitory synapses. a Stimulated emission depletion (STED) microscopy resolves the morphology of presynaptic scaffolds in glutamatergic and GABAergic synapses. Scale bars, 1 μm. Single synapses highlighted with white rectangles are magnified and the corresponding masks of postsynaptic scaffolds are shown. b The panel illustrates the analysis of GABAA receptor (GABAA R) expression in inhibitory postsynapses (gephyrin+ areas), GABAB receptor (GABAB R) expression in excitatory (VGLUT1+ areas) and inhibitory (VGAT+ areas) postsynapses. The outlined areas (green) depict the regions in which the immunoreactivity of GABA receptors was measured. Scale bars, 2 μm. c The area of scaffolds containing PSD95 or gephyrin was quantified in single synapses (n ≥ 580 synapses per condition, results from 5 independent experiments). d Immunoreactivity of GABAA receptors in GABAergic postsynapses. e Immunoreactivity of GABAB receptors in glutamatergic and GABAergic presynapses. d, e The average pixel intensity was quantified for each neuron examined (n ≥ 30 cells per condition, results from 5 independent experiments). Data are medians (lines inside boxes)/ means (filled squares inside boxes) ± IQR (boxes) with 10/ 90% ranks as whiskers. Open diamonds are data points. The asterisks indicate significant differences with control, based on Kruskal–Wallis tests (***p < 0.001, **p < 0.01). ns, not significant
Fig. 5
Fig. 5
The increase of neuronal network activity after ECM depletion is inhibition dependent. a Neuronal network activity was examined using multiple electrode arrays (MEAs). The panel demonstrates the layout and network activity recorded on a MEA chip with a square array of 59 electrodes. b Representative voltage tracks exemplify spikes and bursts detected by single electrodes in control and ECM depleted cultures. c Raster plots show synchronized network activity in control and ECM depleted cultures. Black ticks are single spikes, magenta bars are burst events. The changes of (d) mean firing rate (MFR) and (e) mean bursting rate (MBR) were quantified for single electrodes as the differences with the baseline activity of the same electrode before treatment (n ≥ 169 electrodes per condition, results from 5 independent experiments). The effects of GABAA and GABAB receptor blockage were analyzed by comparing single electrode activity before and after incubation with the antagonist (6 μM bicuculline and 100 μM CGP46381, respectively). Data are medians (lines inside boxes)/ means (filled squares inside boxes) ± IQR (boxes) with 10/ 90% ranks as whiskers. Open diamonds are data points. The asterisks indicate significant differences with control, based on Kruskal–Wallis tests (***p < 0.001). ns not significant
Fig. 6
Fig. 6
Network activity simulation in silico indicates the prevailing role of inhibitory connectivity reduction following ECM depletion. a The schematic drawing illustrates the model of the spiking neuron network. Ninh and Nexc are numbers of inhibitory and excitatory neurons, Winh and Wexc are weights of corresponding synapses. b The ECM depletion was mimicked by tuning Cinh and Winh parameters in accordance with experimentally observed changes. c Raster plots exemplify the activity of “control” and “ECM depleted” networks. The corresponding simulation parameters are depicted. Ticks are single spikes, vertical dashes indicate burst events. The quantification of network average (d) mean firing rate (MFR) and (e) mean bursting rate (MBR) is shown for “control” and “ECM depleted” simulation conditions. Data are medians (lines inside boxes)/ means (filled squares inside boxes) ± IQR (boxes) with 10/ 90% ranks as whiskers. Open diamonds are data points. The asterisks indicate significant differences with the control, based on Kruskal–Wallis tests (***p < 0.001). (f) MFR and (g) MBR are quantified in a range of Winh changes for “control” and “ECM depleted” inhibitory connectivity. Note that the reduction of inhibitory connectivity switches the dependence of network activity on inhibitory synapse weight from power law to linearity. Squares indicate the mean of simulation repetitions, fit functions are shown in red. For each condition, 15 independent simulation experiments were performed

References

    1. Arranz AM, Perkins KL, Irie F, Lewis DP, Hrabe J, Xiao F, Itano N, Kimata K, Hrabetova S, Yamaguchi Y. Hyaluronan deficiency due to Has3 knock-out causes altered neuronal activity and seizures via reduction in brain extracellular space. J Neurosci. 2014;34:6164–6176. doi: 10.1523/JNEUROSCI.3458-13.2014. - DOI - PMC - PubMed
    1. Bavelier D, Levi DM, Li RW, Dan Y, Hensch TK. Removing brakes on adult brain plasticity: from molecular to behavioral interventions. J Neurosci. 2010;30:14964–14971. doi: 10.1523/JNEUROSCI.4812-10.2010. - DOI - PMC - PubMed
    1. Beggs JM, Klukas J, Chen W. Connectivity and Dynamics in Local Cortical Networks. In: Jirsa VK, McIntosh AR, editors. Handbook of Brain Connectivity. Berlin: Springer; 2007. pp. 91–116.
    1. Berretta S, Pantazopoulos H, Markota M, Brown C, Batzianouli ET. Losing the sugar coating: potential impact of perineuronal net abnormalities on interneurons in schizophrenia. Schizophr Res. 2015;167:18–27. doi: 10.1016/j.schres.2014.12.040. - DOI - PMC - PubMed
    1. Beurdeley M, Spatazza J, Lee HH, Sugiyama S, Bernard C, Di Nardo AA, Hensch TK, Prochiantz A. Otx2 binding to perineuronal nets persistently regulates plasticity in the mature visual cortex. J Neurosci. 2012;32:9429–9437. doi: 10.1523/JNEUROSCI.0394-12.2012. - DOI - PMC - PubMed

Substances

LinkOut - more resources