

Overcoming stochastic variations in culture variables to quantify and compare growth curve data
- PMID: 34128245
- PMCID: PMC8984658
- DOI: 10.1002/bies.202100108
Overcoming stochastic variations in culture variables to quantify and compare growth curve data
Abstract
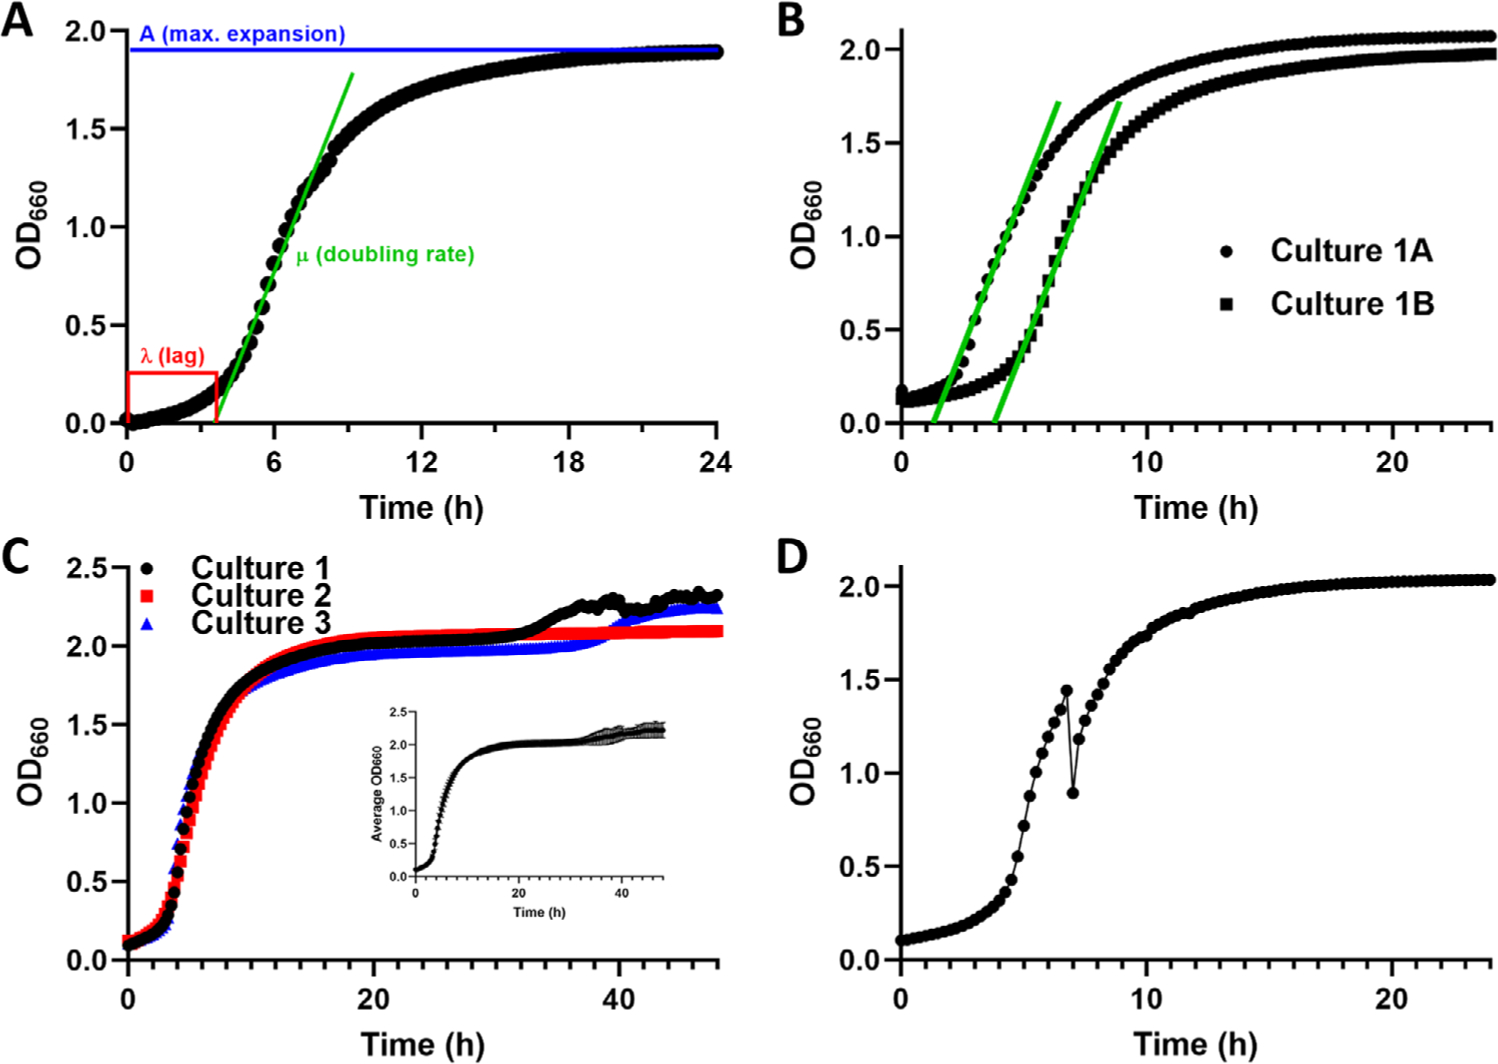
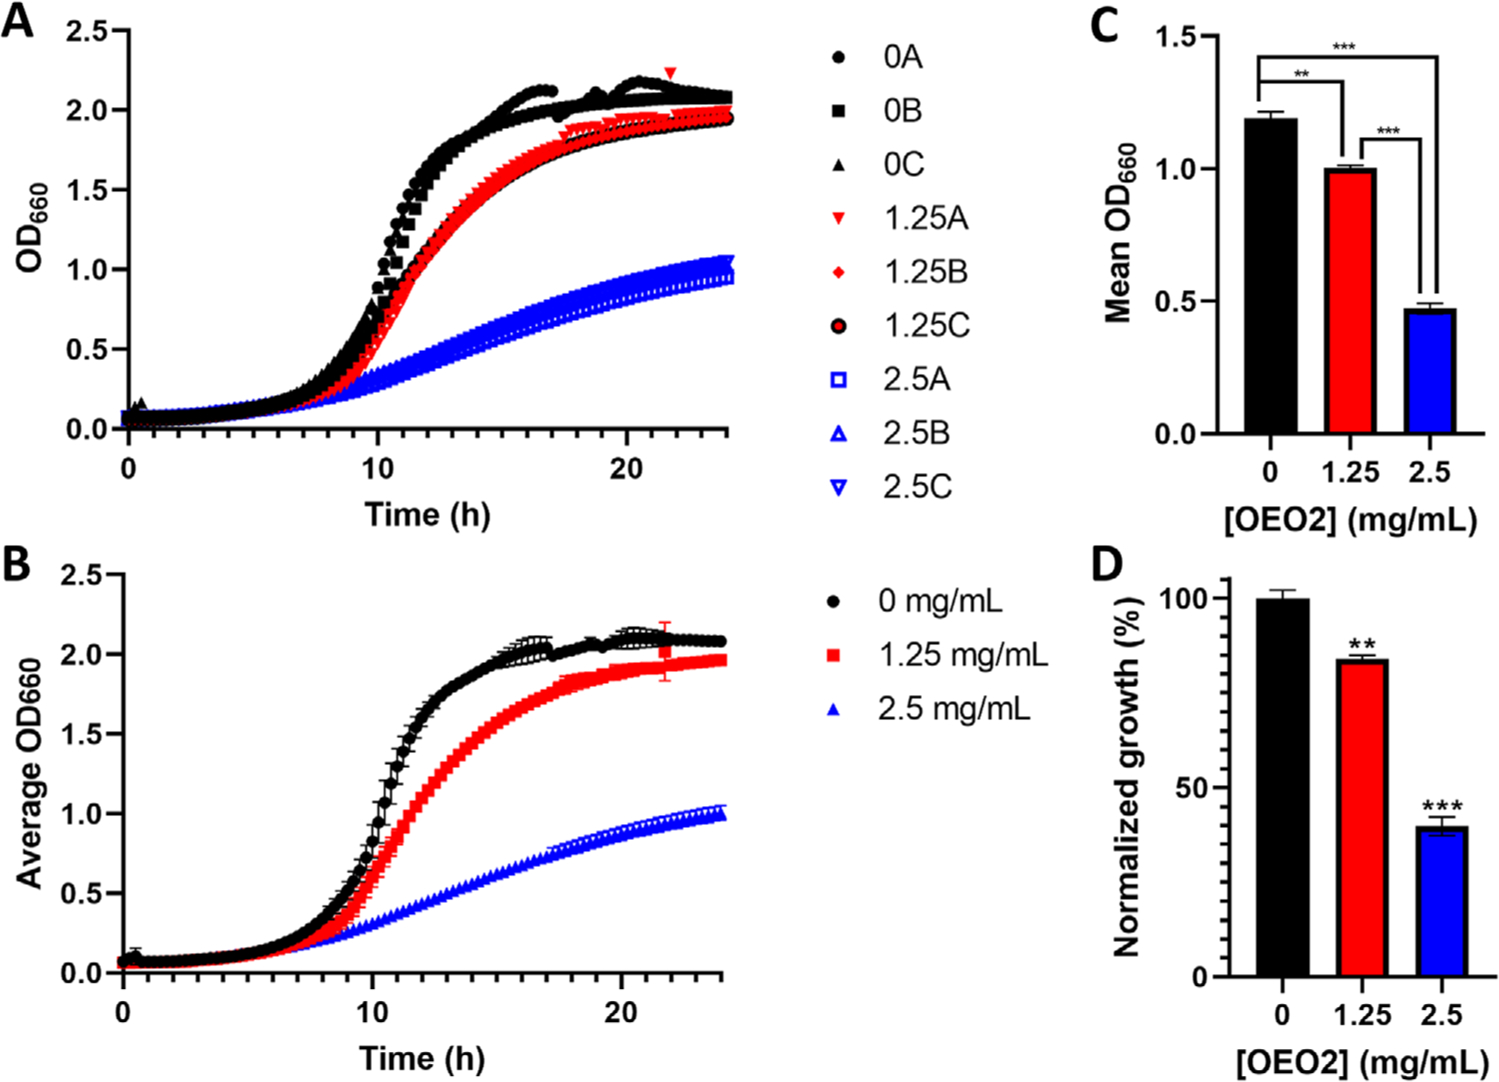
The comparison of growth, whether it is between different strains or under different growth conditions, is a classic microbiological technique that can provide genetic, epigenetic, cell biological, and chemical biological information depending on how the assay is used. When employing solid growth media, this technique is limited by being largely qualitative and low throughput. Collecting data in the form of growth curves, especially automated data collection in multi-well plates, circumvents these issues. However, the growth curves themselves are subject to stochastic variation in several variables, most notably the length of the lag phase, the doubling rate, and the maximum expansion of the culture. Thus, growth curves are indicative of trends but cannot always be conveniently averaged and statistically compared. Here, we summarize a simple method to compile growth curve data into a quantitative format that is amenable to statistical comparisons and easy to graph and display.
Keywords: Saccharomyces cerevisiae; growth curve; microbe.
© 2021 Wiley Periodicals LLC.
Conflict of interest statement
CONFLICT OF INTEREST
The authors declare no conflicts of interest.
Figures
Similar articles
-
Accurate, precise modeling of cell proliferation kinetics from time-lapse imaging and automated image analysis of agar yeast culture arrays.BMC Syst Biol. 2007 Jan 8;1:3. doi: 10.1186/1752-0509-1-3. BMC Syst Biol. 2007. PMID: 17408510 Free PMC article.
-
A high-throughput method to measure the sensitivity of yeast cells to genotoxic agents in liquid cultures.Mutat Res. 2006 Jul 14;606(1-2):92-105. doi: 10.1016/j.mrgentox.2006.03.006. Epub 2006 May 19. Mutat Res. 2006. PMID: 16713735
-
The plate-washing assay: a simple test for filamentous growth in budding yeast.Cold Spring Harb Protoc. 2015 Feb 2;2015(2):168-71. doi: 10.1101/pdb.prot085068. Cold Spring Harb Protoc. 2015. PMID: 25646503 Free PMC article.
-
A quantitative fitness analysis workflow.J Vis Exp. 2012 Aug 13;(66):4018. doi: 10.3791/4018. J Vis Exp. 2012. PMID: 22907268 Free PMC article.
-
Media and culture of yeast.Curr Protoc Cell Biol. 2001 May;Chapter 1:Unit 1.6. doi: 10.1002/0471143030.cb0106s04. Curr Protoc Cell Biol. 2001. PMID: 18228294 Review.
Cited by
-
A screen for synthetic genetic interactions with the Saccharomyces cerevisiae hrq1ΔN allele.bioRxiv [Preprint]. 2025 Jul 4:2025.07.03.663020. doi: 10.1101/2025.07.03.663020. bioRxiv. 2025. PMID: 40631315 Free PMC article. Preprint.
References
-
- van Leeuwenhoek A, In: Gale T, van Croonevelt H (Eds.), Delft, 1694,6.
-
- Steenwyk JL, Opulente DA, Kominek J, Shen XX, Zhou X, Labella AL, Bradley NP, Eichman BF, Cadez N, Libkind D, DeVirgilio J, Hulfachor AB, Kurtzman CP, Hittinger CT, & Rokas A (2019). Extensive loss of cell-cycle and DNA repair genes in an ancient lineage of bipolar budding yeasts. Plos Biology, 17, e3000255. - PMC - PubMed
Publication types
MeSH terms
Substances
Grants and funding
LinkOut - more resources
Full Text Sources
Molecular Biology Databases
