. 2021 Jul;25(14):7066-7077.
doi: 10.1111/jcmm.16720. Epub 2021 Jun 14.

Identification of a prognostic metabolic gene signature in diffuse large B-cell lymphoma

Affiliations

Identification of a prognostic metabolic gene signature in diffuse large B-cell lymphoma

Huizhong Wang et al. J Cell Mol Med. 2021 Jul.

Abstract

Diffuse large B-cell lymphoma (DLBCL) is a clinically diverse disease. Given the numerous genetic mutations and variations associated with it, a prognostic gene signature that can be related to the overall survival (OS) is a clinical implication. We used the mRNA expression profiles and clinicopathological data of patients with DLBCL from the Gene Expression Omnibus (GEO) database to identify a metabolism-related gene signature. Using LASSO regression analysis, a novel 13-metabolic gene signature was identified to evaluate prognosis. The information gathered was used to construct the nomogram model to improve risk stratification and quantify risk factors for individual patients. We performed gene set enrichment analysis to identify the enriched signalling axes to further understand the underlying biological pathways. The receiver operating characteristic (ROC) curve revealed a satisfactory performance in the training cohorts. The model also showed clinical benefit when compared to the standard prognostic factors (P < .05) in validation cohorts. This study aimed to combine metabolic dysregulation with clinical features of patients with DLBCL to generate a prognostic model that might not only indicate the value of the metabolic microenvironment for prognostic stratification but also improve the decision-making during individual therapy.

Keywords: clinical prognostic model; diffuse large B-cell lymphoma; gene signature; metabolism.


Conflict of interest statement

The authors declare no conflicts of interest in this work.

Figures

FIGURE 1
FIGURE 1
Construction of the metabolic model for DLBCL. A, 1,000‐fold cross‐validation for variable selection in the LASSO regression via min criteria. B, LASSO coefficients of metabolism‐related genes. Each curve represents a metabolic gene
FIGURE 2
FIGURE 2
Time‐dependent ROC analysis, survival outcome analysis and Kaplan‐Meier analysis and risk score analysis for the 13‐gene signature in DLBCL. A–C, Time‐dependent ROC analysis for 1‐, 3‐ and 5‐year overall survival (OS) of prognostic model in training cohort and the validation cohorts of GSE4732 and GSE23501. D–F, Kaplan‐Meier curve of the prognostic model in the training cohort the validation cohorts of GSE4732 and GSE23501. G–I, Kaplan‐Meier curve of the prognostic model in the three chorts Mentioned above. Risk score analysis of the 13‐gene signature in the training cohort and the validation cohorts of GSE4732 and GSE23501
FIGURE 3
FIGURE 3
Forrest plot of the univariate and multivariate Cox regression analyses. Forrest plot of the univariate and multivariate Cox regression analyses in the training cohort (A, B). Forrest plot of the univariate and multivariate Cox regression analyses in the validating cohort of GSE4732 (C, D) and the validation cohorts of GSE23501 (E, F)
FIGURE 4
FIGURE 4
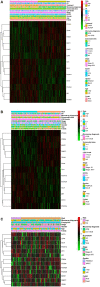
Heatmap of the 13‐gene signature and clinicopathological characteristics in different metabolic risk levels for training cohort (A) and validation cohorts of GSE4732 (B) and GSE23501 (C). Each column showing gene expression or clinicopathological state represents a sample, and each row represents one characteristic or gene in the model. The expression levels of the 13 genes are shown in different colours. Blue and yellow indicate low‐ and high‐risk levels. ECOG, Eastern Cooperative Oncology Group; IPI, International Prognostic Index; ABC, activated B cell; GCB, germinal centre B cell
FIGURE 5
FIGURE 5
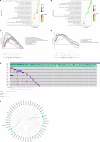
Significantly enriched KEGG pathways in three cohorts by GSEA. Genetic alterations of the 13 genes based on GSEA. A, B, Top 20 representative KEGG pathways in high‐risk patients in the training cohort and the cohort of GSE23501 (P <.05). C, D, Representative metabolic pathways in high‐risk patients in the training cohort and the cohort of GSE23501. E, Genetic alterations of the 13‐gene panel in CCLE, obtained from the cBioportal for cancer genomics. F, The protein‐protein interactions between the metabolic model‐related proteins and the other proteins. The model‐related proteins are shown in blue circles, and the size of which is determined by the number of interacting proteins. MPI has no known interactions with other proteins
FIGURE 6
FIGURE 6
Time‐dependent receiver operating characteristic (ROC) analysis of 1‐, 3‐ and 5‐year overall survival (OS) of metabolic risk model compared with other potential prognostic factors. A‐I, Time‐dependent ROC analysis for 1‐, 3‐ and 5‐year OS of metabolic risk model in the training cohort and the validating cohorts. A, B and C display GSE10846; D, E and F display GSE4732; G, H and I display GSE23501. ECOG, Eastern Cooperative Oncology Group; IPI, International Prognostic Index
FIGURE 7
FIGURE 7
Building and validation of the nomogram to predict the overall survival of patients combining the training cohort and validation cohorts. A, Nomogram plot was built based on age, IPI score, metabolic risk score and total points combining the training cohort and validation cohorts. B, Calibration plot of the nomogram. C, D, Time‐dependent receiver operating characteristic (ROC) curves of nomograms were compared based on 1‐, 3‐ and 5‐year OS of the training cohort and the cohort of GSE4732

References

    1. Lauren RT, DeSantis CE, Cerhan JR, et al. 2016 US lymphoid malignancy statistics by World Health Organization subtypes. CA Cancer J Clin. 2016;6(66):443‐459. - PubMed
    1. Swerdlow S. WHO Classification of Tumours of Haematopoietic and Lymphoid Tissues. 2017. Lyon, France: World Health Organization;
    1. Coiffier B, Lepage E, Brière J, et al. CHOP chemotherapy plus rituximab compared WITH CHOP alone in elderly patients with diffuse large‐B‐Cell Lymphoma. N Engl J Med. 2002;346:235‐242. - PubMed
    1. Mareschal S, Ruminy P, Bagacean C, et al. Accurate classification of germinal center B‐Cell‐Like/Activated B‐Cell‐Like diffuse large B‐Cell lymphoma using a simple and rapid reverse transcriptase‐multiplex ligation‐dependent probe amplification assay: a CALYM Study. Journal of Molecular Diagnostics. 2015;15(S1525–1578):273‐283. - PubMed
    1. International Non‐Hodgkin's Lymphoma Prognostic Factors Project .A predictive model for aggressive non‐Hodgkin’s lymphoma. The International Non‐Hodgkin's Lymphoma Prognostic Factors Project. N Engl J Med. 1993;14(329):987‐994. - PubMed

Substances