. 2021 Aug;10(15):5358-5374.
doi: 10.1002/cam4.4063. Epub 2021 Jun 15.

Immune infiltration phenotypes of prostate adenocarcinoma and their clinical implications

Affiliations

Immune infiltration phenotypes of prostate adenocarcinoma and their clinical implications

Zehua Ma et al. Cancer Med. 2021 Aug.

Abstract

Background: Tumor-infiltrating immune cells participate in the initiation and progression of prostate adenocarcinoma (PRAD). However, it is not fully known how immune infiltration affects the development of PRAD and its clinical presentation.

Methods: Herein, we investigated the immune infiltration phenotypes in PRAD based on transcriptome profiles, methylation profiles, somatic mutation, and copy number variations. We also developed an immune prognostic model (IPM) to identify unfavorable prognosis. To verify this model, immunohistochemistry staining was performed on a cohort of PRAD samples. Moreover, we constructed a nomogram to assess the survival of PRAD incorporating immune infiltration and other clinical features.

Results: We categorized PRAD patients into high and low-level clusters based on immune infiltration phenotypes. The patients in the high-level clusters had worse survival than their low-level counterparts. Gene set enrichment analysis indicated that both anti- and pro-tumor terms were enriched in high-level cluster. Moreover, we identified a positive correlation between anti- and pro-tumor immune cells in PRAD microenvironment. Notably, Somatic mutation analysis showed patients in high-level cluster had a higher somatic mutation burden of KMT2D, HSPA8, CHD7, and MAP1A. In addition, we developed an IPM with robust predictive ability. The model can distinguish high-risk PRAD patients with poor prognosis from low-risk PRAD patients in both training and another three independent validation datasets. Besides, we constructed a nomogram incorporating Gleason score, pathological T stage, and IPM for the prognosis prediction of PRAD patients, which displayed robust predictive ability and might contribute to clinical practice.

Conclusion: Our work illustrated the immune infiltration phenotypes strongly related to the poor prognosis of PRAD patients, and highlighted the potential of the IPM to identify unfavorable tumor features.

Keywords: biological behaviors; genomic patterns; immune infiltration phenotypes; prognostic signature; prostate adenocarcinoma.


Conflict of interest statement

The authors declare that there are no conflicts of interest.

Figures
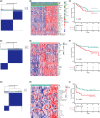
FIGURE 1
FIGURE 1
The immune infiltration phenotypes of prostate carcinoma. (A) Consensus clustering matrix of PRAD samples when K = 2 in the TCGA cohort. (B) Heatmap and clinicopathologic characteristics of two distinct immune infiltration phenotypes defined by the overall abundance of 28 tumor‐infiltrating immune cells in the TCGA cohort. (C) Kaplan–Meier survival curves of each cluster for DFS (disease‐free survival) in the TCGA cohort. (D) Consensus clustering matrix of PRAD samples when K = 2 in the GSE70770 cohort. (E) Heatmap of two distinct immune infiltration phenotypes defined by the overall abundance of 28 tumor‐infiltrating immune cells in the GSE70770 cohort. (F) Kaplan–Meier survival curves of each cluster for bPFS (Biochemical progression‐free survival) in the GSE70770 cohort. (G) Consensus clustering matrix of PRAD samples when K = 2 in the ICGC cohort. (H) Heatmap of two distinct immune infiltration phenotypes defined by the overall abundance of 28 tumor‐infiltrating immune cells in the ICGC cohort. (I) Kaplan–Meier survival curves of each cluster for bPFS (Biochemical progression‐free survival) in the ICGC cohort
FIGURE 2
FIGURE 2
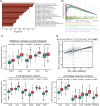
Enrichment analysis of the immune infiltration phenotypes. (A) Functional enrichment analysis indicates the significant biological processes enriched in the high‐level cluster. (B) Gene set enrichment analysis indicates significant signaling pathways correlated with the immune infiltration phenotypes using gene sets of “c2.all.v6.2.symbols” and “c5.all.v6.2.symbols.” (C) Differential expression of immune‐related genes between the two clusters. (D) Positive Spearman's correlation of the infiltration level between immune cells executing anti‐tumor immunity (Tcm, Tem, Th1 cells, Th17 cells, cytotoxic cells, aDC, and NK CD56 bright cells) and immune cells executing pro‐tumor suppression (Treg, Th2 cells, NK CD56 dim cells, pDC, Macrophage, MDSCs, and neutrophils). The shaded area represents a 95% confident interval
FIGURE 3
FIGURE 3
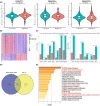
Association between immune infiltration phenotypes and DNA methylation patterns in PRAD. (A) Differential expression of three DNA methyltransferases between the two clusters. (B) Heatmap of 784 DMRs (Differentially methylated regions) between the two clusters. (C) Distribution of DMRs around the islands and on gene's different structural regions. (D) The intersection results of upregulated DEGs (Differentially expressed genes) and genes with decreased CpG island methylation level in the promoter region. (E) Enrichment analysis of the intersection results in (D)
FIGURE 4
FIGURE 4
Association between immune infiltration phenotypes and somatic mutations and CNVs in PRAD. (A) Significantly differentially mutated genes between the two clusters. (B) Composite copy number profiles of high‐level cluster compared with low‐level cluster with gains shown in red and losses in blue
FIGURE 5
FIGURE 5
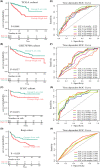
Prognostic analysis of the IPM (Immune prognostic model) in three independent cohorts. (A–D) Kaplan–Meier survival analysis was performed to compare prognosis between high‐risk score and low‐risk score subgroup in the TCGA, GSE70770, ICGC, and Renji cohorts. (E–H) Time‐dependent ROC curve analysis was performed to evaluate the predictive performance of the IPM in the TCGA, GSE70770, ICGC, and Renji cohorts
FIGURE 6
FIGURE 6
Clinicopathologic significance and biological function of the immune infiltration‐based prognostic model. (A) Risk scores in different clinicopathologic subgroups. (B) Correlation matrix of risk scores and the expression levels of certain genes. The color of the square reflects the corresponding correlation coefficients. (C) Circular plot of the enriched biological processes of the risk score associated genes. (D) Circular plot of the enriched KEGG pathways of the risk score associated genes
FIGURE 7
FIGURE 7
Relationship between the IPM and other clinical information. (A) Univariate regression analysis of the relationship between the IPM and clinicopathological characteristics associated with DFS in the TCGA cohort. (B) Multivariate regression analysis of the relationship between the IPM and clinicopathological characteristics associated with DFS in the TCGA cohort. (C) Nomogram constructed to predict the 2‐, 3‐, and 5‐year DFS for PRAD patients. (D–F) Time‐dependent ROC curve analyses of Gleason score, pathologic T stage, risk score, and the nanogram. (G–H) Calibration curve of the nomogram for predicting the probability of DFS at 2 and 3 years. (I) Decision curve analyses of Gleason score, pathologic T stage, and the nomogram for 5‐year risk

Similar articles

Cited by

References

    1. Siegel RL, Miller KD, Jemal A. Cancer statistics, 2020. CA Cancer J Clin. 2020;70(1):7‐30. - PubMed
    1. Attard G, Parker C, Eeles RA, et al. Prostate cancer. Lancet (London, England). 2016;387(10013):70‐82. - PubMed
    1. Yuan X, Cai C, Chen S, Chen S, Yu Z, Balk SP. Androgen receptor functions in castration‐resistant prostate cancer and mechanisms of resistance to new agents targeting the androgen axis. Oncogene. 2014;33(22):2815‐2825. - PMC - PubMed
    1. Vinay DS, Ryan EP, Pawelec G, et al. Immune evasion in cancer: Mechanistic basis and therapeutic strategies. Semin Cancer Biol. 2015;S185‐S198. - PubMed
    1. Wang M, Zhao J, Zhang L, et al. Role of tumor microenvironment in tumorigenesis. J Cancer. 2017;8(5):761‐773. - PMC - PubMed

Publication types

MeSH terms