

Bidirectional Connectivity Between Broca's Area and Wernicke's Area During Interactive Verbal Communication
- PMID: 34128394
- PMCID: PMC9058861
- DOI: 10.1089/brain.2020.0790
Bidirectional Connectivity Between Broca's Area and Wernicke's Area During Interactive Verbal Communication
Abstract
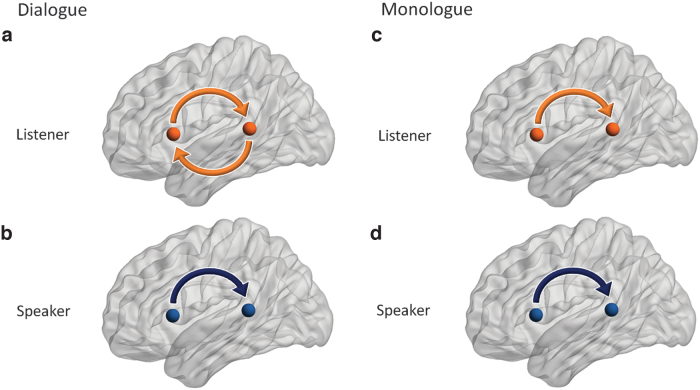
Aim: This investigation aims to advance the understanding of neural dynamics that underlies live and natural interactions during spoken dialogue between two individuals. Introduction: The underlying hypothesis is that functional connectivity between canonical speech areas in the human brain will be modulated by social interaction. Methods: Granger causality was applied to compare directional connectivity across Broca's and Wernicke's areas during verbal conditions consisting of interactive and noninteractive communication. Thirty-three pairs of healthy adult participants alternately talked and listened to each other while performing an object naming and description task that was either interactive or not during hyperscanning with functional near-infrared spectroscopy (fNIRS). In the noninteractive condition, the speaker named and described a picture-object without reference to the partner's description. In the interactive condition, the speaker performed the same task but included an interactive response about the preceding comments of the partner. Causality measures of hemodynamic responses from Broca's and Wernicke's areas were compared between real, surrogate, and shuffled trials within dyads. Results: The interactive communication was characterized by bidirectional connectivity between Wernicke's and Broca's areas of the listener's brain. Whereas this connectivity was unidirectional in the speaker's brain. In the case of the noninteractive condition, both speaker's and listener's brains showed unidirectional top-down (Broca's area to Wernicke's area) connectivity. Conclusion: Together, directional connectivity as determined by Granger analysis reveals bidirectional flow of neuronal information during dynamic two-person verbal interaction for processes that are active during listening (reception) and not during talking (production). Findings are consistent with prior contrast findings (general linear model) showing neural modulation of the receptive language system associated with Wernicke's area during a two-person live interaction. Impact statement The neural dynamics that underlies real-life social interactions is an emergent topic of interest. Dynamically coupled cross-brain neural mechanisms between interacting partners during verbal dialogue have been shown within Wernicke's area. However, it is not known how within-brain long-range neural mechanisms operate during these live social functions. Using Granger causality analysis, we show bidirectional neural activity between Broca's and Wernicke's areas during interactive dialogue compared with a noninteractive control task showing only unidirectional activity. Findings are consistent with an Interactive Brain Model where long-range neural mechanisms process interactive processes associated with rapid and spontaneous spoken social cues.
Keywords: Granger causality; effective connectivity; functional near-infrared spectroscopy; human language interactions; hyperscanning; two-person neuroscience; verbal dialogue.
Conflict of interest statement
There are no competing financial interests or conflicts.
Figures
Similar articles
-
Reorganization of language centers in patients with brain tumors located in eloquent speech areas - A pre- and postoperative preliminary fMRI study.Neurol Neurochir Pol. 2017 Sep-Oct;51(5):403-410. doi: 10.1016/j.pjnns.2017.07.010. Epub 2017 Jul 29. Neurol Neurochir Pol. 2017. PMID: 28780063
-
Frontal temporal and parietal systems synchronize within and across brains during live eye-to-eye contact.Neuroimage. 2017 Aug 15;157:314-330. doi: 10.1016/j.neuroimage.2017.06.018. Epub 2017 Jun 12. Neuroimage. 2017. PMID: 28619652 Free PMC article.
-
Development of information sharing in language neocortex in childhood-onset drug-resistant epilepsy.Epilepsia. 2019 Mar;60(3):393-405. doi: 10.1111/epi.14661. Epub 2019 Feb 11. Epilepsia. 2019. PMID: 30740659
-
Broca and Wernicke are dead, or moving past the classic model of language neurobiology.Brain Lang. 2016 Nov;162:60-71. doi: 10.1016/j.bandl.2016.08.004. Epub 2016 Aug 30. Brain Lang. 2016. PMID: 27584714 Review.
-
Nodes and networks in the neural architecture for language: Broca's region and beyond.Curr Opin Neurobiol. 2014 Oct;28:136-41. doi: 10.1016/j.conb.2014.07.013. Epub 2014 Jul 23. Curr Opin Neurobiol. 2014. PMID: 25062474 Review.
Cited by
-
Effects of Transcranial Direct Current Stimulation on Graph Naming Function and Brain Connectivity in Postinfarction Aphasia Patients: An fMRI Study.Folia Phoniatr Logop. 2024;76(3):264-272. doi: 10.1159/000534188. Epub 2023 Oct 3. Folia Phoniatr Logop. 2024. PMID: 37788662 Free PMC article.
-
Increased Interpersonal Brain Synchronization in Romantic Couples Is Associated with Higher Honesty: An fNIRS Hyperscanning Study.Brain Sci. 2023 May 21;13(5):833. doi: 10.3390/brainsci13050833. Brain Sci. 2023. PMID: 37239304 Free PMC article.
-
Brightening the Study of Listening Effort with Functional Near-Infrared Spectroscopy: A Scoping Review.Semin Hear. 2023 Apr 6;44(2):188-210. doi: 10.1055/s-0043-1766105. eCollection 2023 May. Semin Hear. 2023. PMID: 37122884 Free PMC article.
-
Alteration of network connectivity in stroke patients with apraxia of speech after tDCS: A randomized controlled study.Front Neurol. 2022 Sep 15;13:969786. doi: 10.3389/fneur.2022.969786. eCollection 2022. Front Neurol. 2022. PMID: 36188376 Free PMC article.
-
Brain functional connectivity alterations of Wernicke's area in individuals with autism spectrum conditions in multi-frequency bands: A mega-analysis.Heliyon. 2024 Feb 14;10(4):e26198. doi: 10.1016/j.heliyon.2024.e26198. eCollection 2024 Feb 29. Heliyon. 2024. PMID: 38404781 Free PMC article.
References
-
- Barnett L, Seth AK. 2014. The MVGC multivariate Granger causality toolbox: a new approach to Granger-causal inference. J Neurosci Methods 223:50–68. - PubMed
-
- Bernasconi C, KoÈnig P. 1999. On the directionality of cortical interactions studied by structural analysis of electrophysiological recordings. Biol Cybern 81:199–210. - PubMed
-
- Boas DA, Elwell CE, Ferrari M, et al. . 2014. Twenty years of functional near-infrared spectroscopy: introduction for the special issue. Neuroimage 85:1–5. - PubMed
-
- Catani M, Jones DK. 2005. Perisylvian language networks of the human brain. Ann Neurol 57:8–16. - PubMed
Publication types
MeSH terms
Grants and funding
LinkOut - more resources
Full Text Sources
