. 2021 Jun 15;131(12):e141529.
doi: 10.1172/JCI141529.

Stabilization of fatty acid synthesis enzyme acetyl-CoA carboxylase 1 suppresses acute myeloid leukemia development

Stabilization of fatty acid synthesis enzyme acetyl-CoA carboxylase 1 suppresses acute myeloid leukemia development

Hidenori Ito et al. J Clin Invest. .

Abstract

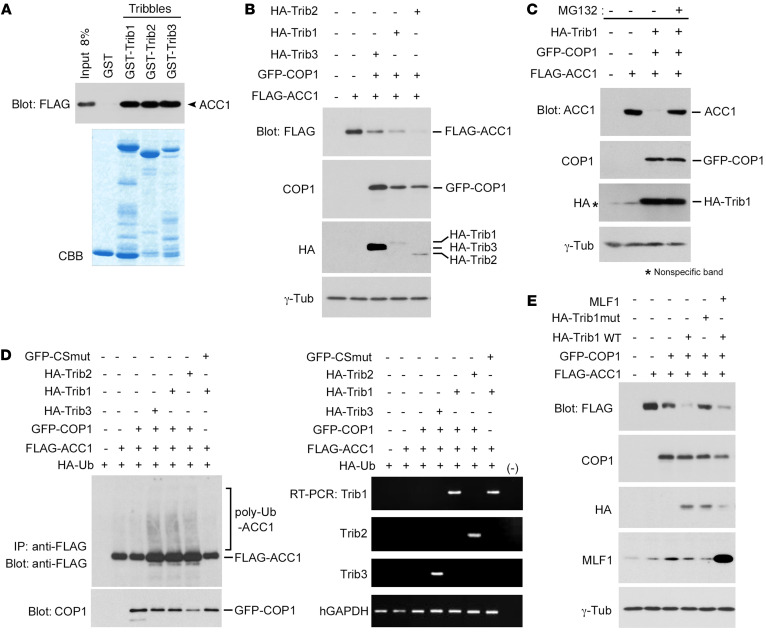
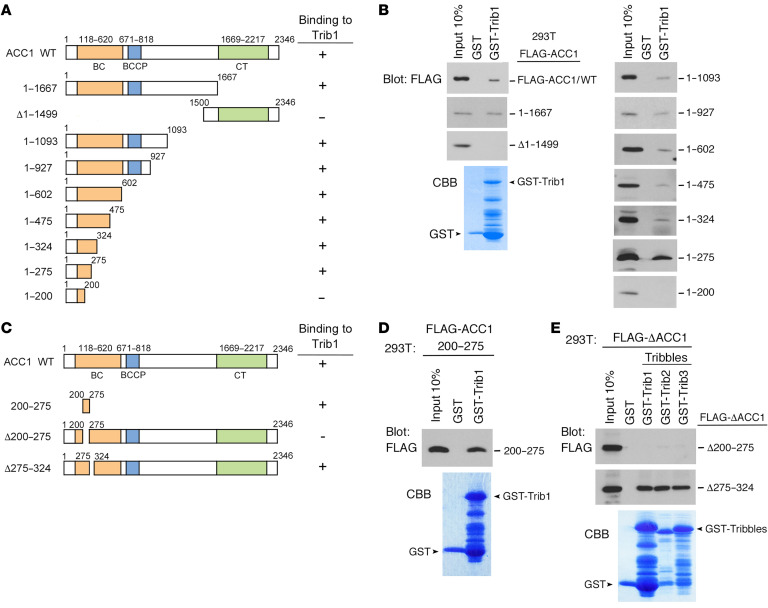
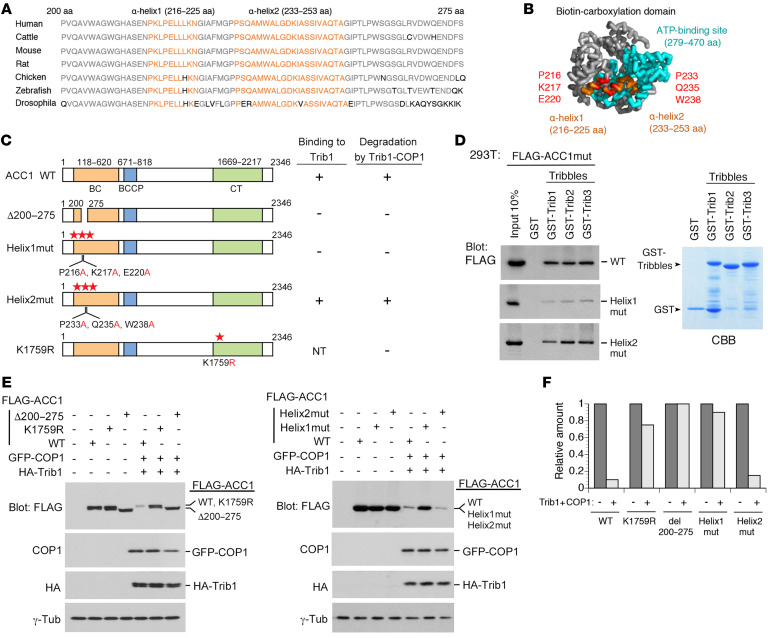
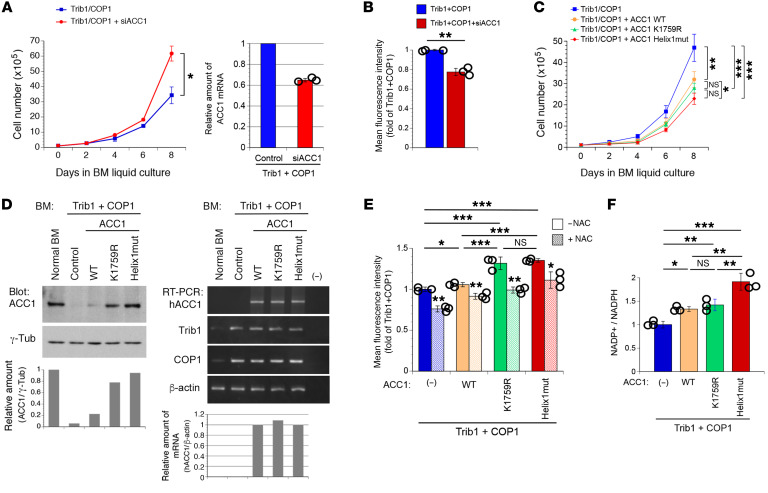
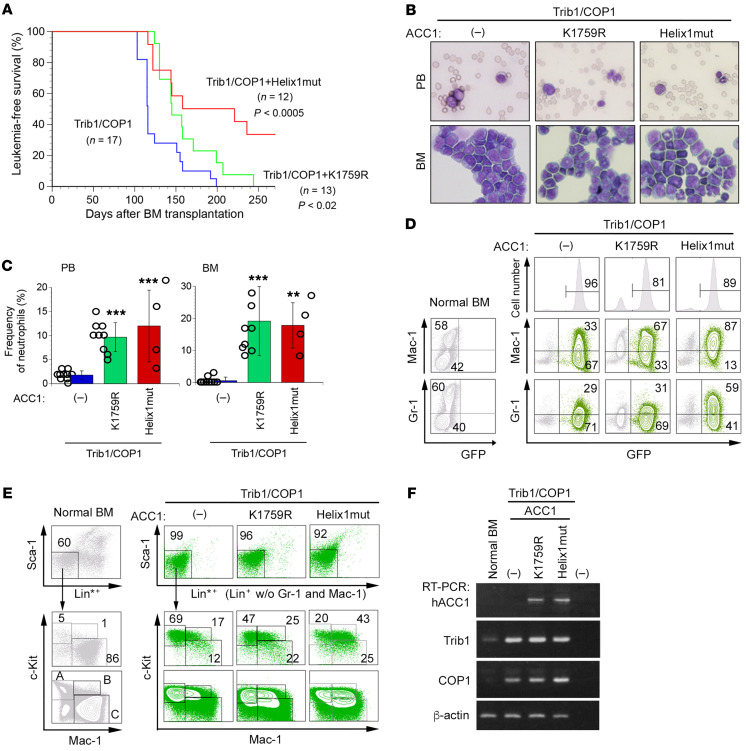
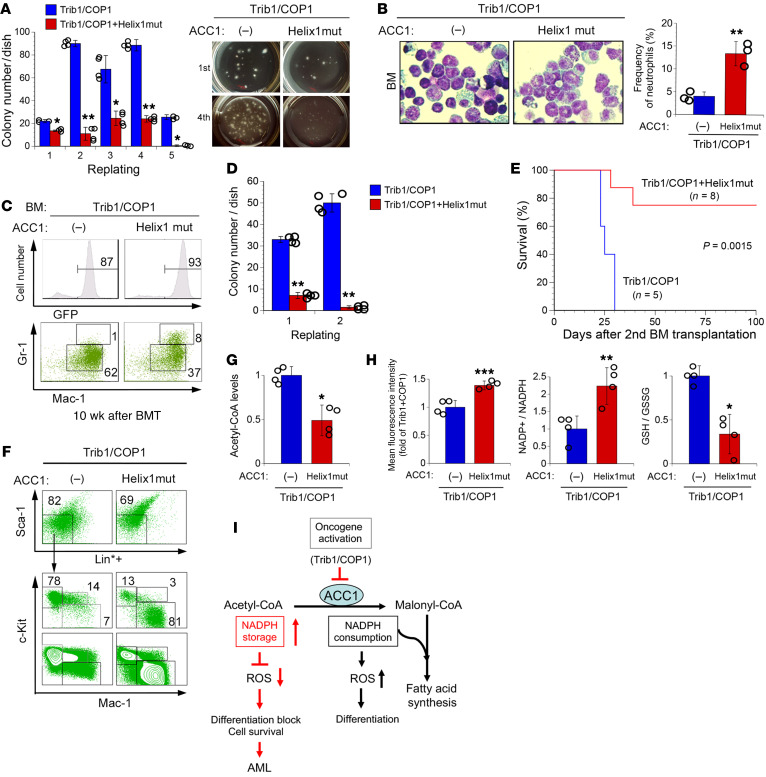
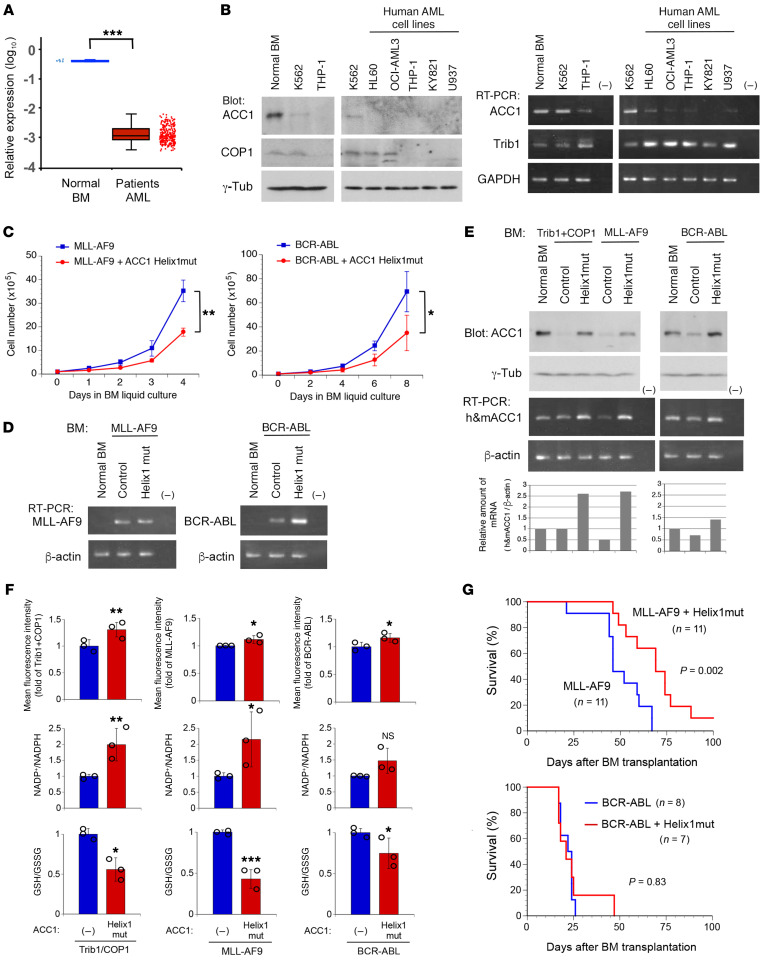
Cancer cells reprogram lipid metabolism during their malignant progression, but limited information is currently available on the involvement of alterations in fatty acid synthesis in cancer development. We herein demonstrate that acetyl-CoA carboxylase 1 (ACC1), a rate-limiting enzyme for fatty acid synthesis, plays a critical role in regulating the growth and differentiation of leukemia-initiating cells. The Trib1-COP1 complex is an E3 ubiquitin ligase that targets C/EBPA, a transcription factor regulating myeloid differentiation, for degradation, and its overexpression specifically induces acute myeloid leukemia (AML). We identified ACC1 as a target of the Trib1-COP1 complex and found that an ACC1 mutant resistant to degradation because of the lack of a Trib1-binding site attenuated complex-driven leukemogenesis. Stable ACC1 protein expression suppressed the growth-promoting activity and increased ROS levels with the consumption of NADPH in a primary bone marrow culture, and delayed the onset of AML with increases in mature myeloid cells in mouse models. ACC1 promoted the terminal differentiation of Trib1-COP1-expressing cells and eradicated leukemia-initiating cells in the early phase of leukemic progression. These results indicate that ACC1 is a natural inhibitor of AML development. The upregulated expression of the ACC1 protein has potential as an effective strategy for cancer therapy.

Keywords: Cancer; Oncology; Tumor suppressors; Ubiquitin-proteosome system.


Conflict of interest statement

Conflict of interest: The authors have declared that no conflict of interest exists.

Figures

Figure 1
Figure 1. Trib1 recruits COP1 to ACC1, and specifically induces proteasome-mediated degradation.
(A) Specific interactions between ACC1 and Tribble proteins in vitro. GST-control, GST-Trib1, GST-Trib2, and GST-Trib3 fusion proteins shown at the top were incubated with 293T cell lysates containing FLAG-tagged ACC1 proteins. Bound proteins were detected by immunoblotting with an antibody against a FLAG epitope. GST-fused proteins were visualized by Coomassie brilliant blue (CBB) staining to evaluate their amounts. (B) The ACC1 protein is downregulated by Trib1-COP1 and Trib2-COP1 as well as Trib3-COP1. 293T cells were transfected with vectors encoding FLAG-ACC1 and GFP-COP1 together with HA-tagged Tribbles (HA-Trib1, HA-Trib2, or HA-Trib3). Cell lysates were analyzed by immunoblotting with antibodies against a FLAG epitope, COP1, an HA epitope, and γ-tubulin. (C) A treatment with MG132 inhibits ACC1 degradation. 293T cells transfected with a combination of vectors encoding FLAG-ACC1, GFP-COP1, and HA-Trib1 were incubated in the presence and absence of MG132 and analyzed by immunoblotting with antibodies against ACC1, COP1, an HA epitope, and γ-tubulin. (D) All Tribbles-COP1 promote the ubiquitination of ACC1. 293T cells were transfected with a combination of vectors shown at the top. Cell lysates were analyzed by immunoprecipitation with an antibody against a FLAG epitope followed by immunoblotting with an antibody against a FLAG epitope, and by immunoblotting with an antibody against COP1. Total RNA was analyzed by semiquantitative RT-PCR (semi-qRT-PCR) using a pair of primers specific to Trib1, Trib2, Trib3, and human GAPDH. (E) ACC1 is degraded through the interaction with Trib1. 293T cells were transfected with a combination of vectors shown at the top. Cell lysates were analyzed by immunoblotting with antibodies against a FLAG epitope, COP1, an HA epitope, MLF1, and γ-tubulin.
Figure 2
Figure 2. Identification of the Tribbles-binding site in ACC1.
(A) Schematic representation of ACC1 deletion mutants. The results of Trib1 binding are summarized on the right. (B) GST-control and GST-Trib1 fusion proteins were incubated with 293T cell lysates containing FLAG-tagged ACC1WT and deletion mutant proteins. Bound proteins were detected by immunoblotting with an antibody against a FLAG epitope. The GST-Trib1–fused protein was visualized by CBB staining to evaluate its amount. (C) Schematic representation of ACC1 deletion mutants minimized for ACC1-Trib1 binding. The results of Trib1 binding are summarized on the right. (D and E) GST-control and GST-Trib1 fusion proteins were incubated with 293T cell lysates containing FLAG-ACC1/200–275 (D). GST-control and all GST-Tribbles (GST-Trib1, GST-Trib2, and GST-Trib3) fusion proteins were incubated with 293T cell lysates containing FLAG-ACC1/Δ200–275 and ACC1/Δ275–324 (E). Bound proteins were detected by immunoblotting with an antibody against a FLAG epitope. GST-Tribbles–fused proteins were visualized by CBB staining to evaluate their amounts.
Figure 3
Figure 3. Construction of ACC1 point mutants resistant to Trib1-COP1–mediated degradation.
(A) Sequence alignment of residues 200–275 of human ACC1 with compatible residues of various species. The region includes two α-helices (Helix1: residues 216–225; Helix2: residues 233–253) marked in orange and other conserved residues shown in gray. (B) Structure of the biotin carboxylase (BC) domain of ACC1. Helix1 and Helix2 (in orange) are positioned at the outside of the ATP-binding site (in blue). Mutants of Helix1 and Helix2 were constructed by replacement of 3 residues positioned at the interaction surfaces with alanine (Helix1mut: P216A, K217A, and E220A; Helix2mut: P233A, Q235A, and W238A; shown in red). This model is generated by the human ACC1 full crystal structure (PDB:6G2D) with PyMOL (http://www.pymol.org). (C) Schematic representation of ACC1 point mutants for the ACC1-Trib1 binding and ubiquitination sites. The results of Trib1 binding and degradation are summarized on the right. NT, not tested. (D) GST-control and all GST-Tribbles (GST-Trib1, GST-Trib2, and GST-Trib3) fusion proteins were incubated with 293T cell lysates containing FLAG-ACC1WT, Helix1mut, and Helix2mut. Bound proteins were detected by immunoblotting with an antibody against a FLAG epitope. GST-Tribbles–fused proteins were visualized by CBB staining to evaluate their amounts. (E and F) Helix1mut and K1759R are resistant to degradation. 293T cells were transfected with the combination of vectors shown at the top. Cell lysates were analyzed by immunoblotting with antibodies against a FLAG epitope, COP1, an HA epitope, and γ-tubulin (E). Relative amounts of proteins were quantified using ImageJ software (NIH) (F).
Figure 4
Figure 4. Stabilized ACC1 suppresses cell growth and increases ROS levels and NADPH consumption.
(A and B) Primary BM cells were infected with retroviruses expressing Trib1- and COP1-IRES-GFP in the presence and absence of ACC1-specific siRNA (siACC1). GFP-positive cells were sorted by flow cytometry and cultured in BM medium. Cell numbers were counted for growth curves (A). GFP-positive cells in A were transferred to IL-3–containing medium with low glucose (1 g/L), maintained for 3 days, and analyzed to measure ROS levels (B). P values were calculated with Student’s t test (*P < 0.05, **P < 0.01). Data are the average of 3 independent experiments (A and B) shown as mean ± SEM. (CF) Primary BM cells were infected with retroviruses expressing Trib1- and COP1-IRES-GFP together with and without ACC1WT, K1759R, and Helix1mut. GFP-positive cells were sorted by flow cytometry and cultured in BM medium. Cell numbers were counted for growth curves (C). Cell lysates of GFP-positive cells in C were analyzed by immunoblotting with antibodies against ACC1 and γ-tubulin (D, left). Total RNA was analyzed by semi-qRT-PCR using a pair of primers specific to human ACC1 (hACC1) Trib1, COP1, and β-actin (D, right). Relative amounts of proteins (hACC1/γ-tubulin) and mRNAs (hACC1/β-actin) were quantified using ImageJ software (D, bottom panels). GFP-positive cells in C were transferred to IL-3–containing medium with low glucose (1 g/L), maintained in the absence and presence of 1 mM N-acetylcysteine (NAC) for 3 days, and analyzed to measure ROS levels (E) and the NADP+/NADPH ratio (F). P values were calculated with 1-way ANOVA with Tukey’s multiple-comparison post-test (*P < 0.05, **P < 0.01, ***P < 0.001). Data are the average of 3 independent experiments (C, E, and F) shown as mean ± SEM.
Figure 5
Figure 5. Stabilized ACC1 suppresses leukemic progression and induces cell differentiation in AML.
Mice were transplanted with BM cells infected with retroviruses expressing Trib1- and COP1-IRES-GFP together with and without K1759R and Helix1mut and analyzed for several months after BM transplantation. (A) Myeloid leukemia–free survival curves of transplanted mice. Results are derived from 4 independent transfer experiments. P values versus Trib1-COP1 control mice were calculated with the log-rank test. (B) May-Grünwald-Giemsa–stained peripheral blood (PB) smears and cytospins of BM cells in AML mice. Original magnification, ×400. (C) Frequency of neutrophils in the PB and BM cells of Trib1/COP1 (n = 10), K1759R (n = 9), and Helix1mut (n = 4) mice. P values were calculated with 1-way ANOVA with Tukey’s multiple-comparison post-test (**P < 0.01, ***P < 0.001). Data are shown as mean ± SEM. (D) FACS analysis of GFP-positive BM cells for immature (Mac-1lo, Gr-1lo) and differentiated (Mac-1hi, Gr-1hi) granulocytes. The population of GFP-positive cells in BM is shown in the top panels. The distribution pattern in normal BM cells is shown in the left panels. (E) A detailed FACS analysis of GFP-positive BM cells for lineage-negative cells, excluding Mac-1 and Gr-1 (Lin*: CD3B220TER-119). Lin*Sca-1 (Lin*: lineage marker without Mac-1 and Gr-1) BM cells were separated into 3 fractions: c-KithiMac-1 (fraction A: the CMP/GMP/MEP compartment), c-Kit+Mac-1+ (fraction B: committed myeloid progenitors), and c-Kitlo/–Mac-1+ (fraction C: differentiated myeloid cells). The distribution pattern in normal BM cells is shown in the left panels. (F) Total RNA extracted from GFP-positive BM cells was analyzed by semi-qRT-PCR using a pair of primers specific to hACC1, Trib1, COP1, and β-actin.
Figure 6
Figure 6. ACC1 stabilization induces the loss of self-renewal activity in leukemia-initiating cells.
(A and B) GFP-positive BM cells expressing Trib1/COP1 together with and without Helix1mut were sorted and plated in methylcellulose-based medium. Colony numbers were counted after 10 days and replated in fresh medium for serial colony assays (A, left panel). Plates from the first culture and the fourth serial culture are shown (A, right panel). May-Grünwald-Giemsa stain (original magnification, ×400) and frequency of neutrophils (n = 3) in colony-forming cells from the first culture (B). (CH) BM cells from the early phase of Trib1-COP1 control mice and mice with Helix1mut-cotransduced BM (10 weeks after BM transplantation) were analyzed. (C) FACS analysis for immature (Mac-1+Gr-1lo) and differentiated (Mac-1hiGr-1hi) granulocytes. The population of GFP-positive cells in BM is shown in the top panels. (D) GFP-positive cells were sorted and plated for colony assays. (E) Kaplan-Meier survival curves of secondary transplanted mice. Sublethally irradiated mice received 1 × 10⁵ GFP-positive BM cells each from two Trib1/COP1 and two Helix1mut mice. (F) A detailed FACS analysis of GFP-positive BM cells from secondary transplanted mice in E. Lin*Sca-1 cells were separated into 3 fractions: c-KithiMac-1 (fraction A), c-Kit+Mac-1+ (fraction B), and c-Kitlo/–Mac-1+ (fraction C). (G and H) GFP-positive BM cells from the early phase of Trib1/COP1 (n = 4) and Helix1mut (n = 4) mice were analyzed to measure acetyl-CoA levels (G), ROS levels, the NADP+/NADPH ratio, and the GSH/GSSG ratio (H). (I) Proposed model of the ACC1-mediated pathway and effects on leukemia cells. P values were calculated by Student’s t test (*P < 0.05, **P < 0.01, ***P < 0.001) in A, B, D, G, and H and by log-rank test in E. Data are the average of 2 independent experiments with 4 dishes (A and D) and 4 independent experiments (G and H) shown as mean ± SEM.
Figure 7
Figure 7. ACC1 is downregulated in human AML and stabilized ACC1 partially suppresses MLL-AF9–induced AML.
(A) Microarray data analysis of the ACC1 expression in human AML. Gene expression data of normal BMs from healthy donors (n = 9) and AML patient samples (n = 285) were obtained from the GEO data sets. (B) ACC1 protein and mRNA levels in human leukemic cell lines. Cell lysates from normal BM, a CML cell line (K562), and AML cell lines (HL60, OCI-AML3, THP-1, KY821, and U937) were analyzed by immunoblotting with antibodies against ACC1, COP1, and γ-tubulin. Total RNA was analyzed by semi-qRT-PCR using a pair of primers specific to ACC1, Trib1, and GAPDH. (CF) Primary BM cells were infected with retroviruses expressing MLL-AF9, BCR-ABL, and Trib1- and COP1-IRES-GFP together with and without ACC1 Helix1mut. Sorted GFP-positive cells were cultured in BM medium. Cell numbers were counted for growth curves (C). Total RNA extracted from GFP-positive cells in C was analyzed by semi-qRT-PCR using a pair of primers specific to MLL-AF9, BCR-ABL (D), human and mouse (h&m) ACC1 (E), and β-actin (D and E). Cell lysates of GFP-positive cells in C were analyzed by immunoblotting with antibodies against ACC1 and γ-tubulin (E). Relative amounts of mRNAs (h&mACC1/β-actin) were quantified using ImageJ software (E, bottom panels). GFP-positive cells in C were transferred to IL-3–containing medium with low glucose (1 g/L) and analyzed to measure ROS levels, the NADP+/NADPH ratio, and the GSH/GSSG ratio (F). Data are the average of 3 independent experiments (C and F) shown as mean ± SEM. (G) Survival curves of transplanted mice with BM expressing MLL-AF9-IRES-GFP and BCR-ABL-IRES-GFP together with and without ACC1 Helix1mut. Results are derived from 3 independent transfer experiments. P values were calculated with Student’s t test (*P < 0.05, **P < 0.01, ***P < 0.001) in A, C, and F and with log-rank test in G.

Similar articles

Cited by

References

    1. Zhu J, Thompson CB. Metabolic regulation of cell growth and proliferation. Nat Rev Mol Cell Biol. 2019;20(7):436–450. doi: 10.1038/s41580-019-0123-5. - DOI - PMC - PubMed
    1. Currie E, et al. Cellular fatty acid metabolism and cancer. Cell Metab. 2013;18(2):153–161. doi: 10.1016/j.cmet.2013.05.017. - DOI - PMC - PubMed
    1. Vander Heiden MG, et al. Understanding the Warburg effect: the metabolic requirements of cell proliferation. Science. 2009;324(5930):1029–1033. doi: 10.1126/science.1160809. - DOI - PMC - PubMed
    1. Altman BJ, et al. From Krebs to clinic: glutamine metabolism to cancer therapy. Nat Rev Cancer. 2016;16(10):619–634. doi: 10.1038/nrc.2016.71. - DOI - PMC - PubMed
    1. Wakil SJ, Abu-Elheiga LA. Fatty acid metabolism: target for metabolic syndrome. J Lipid Res. 2009;50(suppl):S138–S143. - PMC - PubMed

Publication types

MeSH terms