

Cold Spells and Cause-Specific Mortality in 47 Japanese Prefectures: A Systematic Evaluation
- PMID: 34128690
- PMCID: PMC8204943
- DOI: 10.1289/EHP7109
Cold Spells and Cause-Specific Mortality in 47 Japanese Prefectures: A Systematic Evaluation
Abstract
Background: Many studies have investigated the devastating health effects of heat waves, but less is known about health risks related to cold spells, despite evidence that extreme cold may contribute to a larger proportion of deaths.
Objectives: We aimed to systematically investigate the association between cold spells and mortality in Japan.
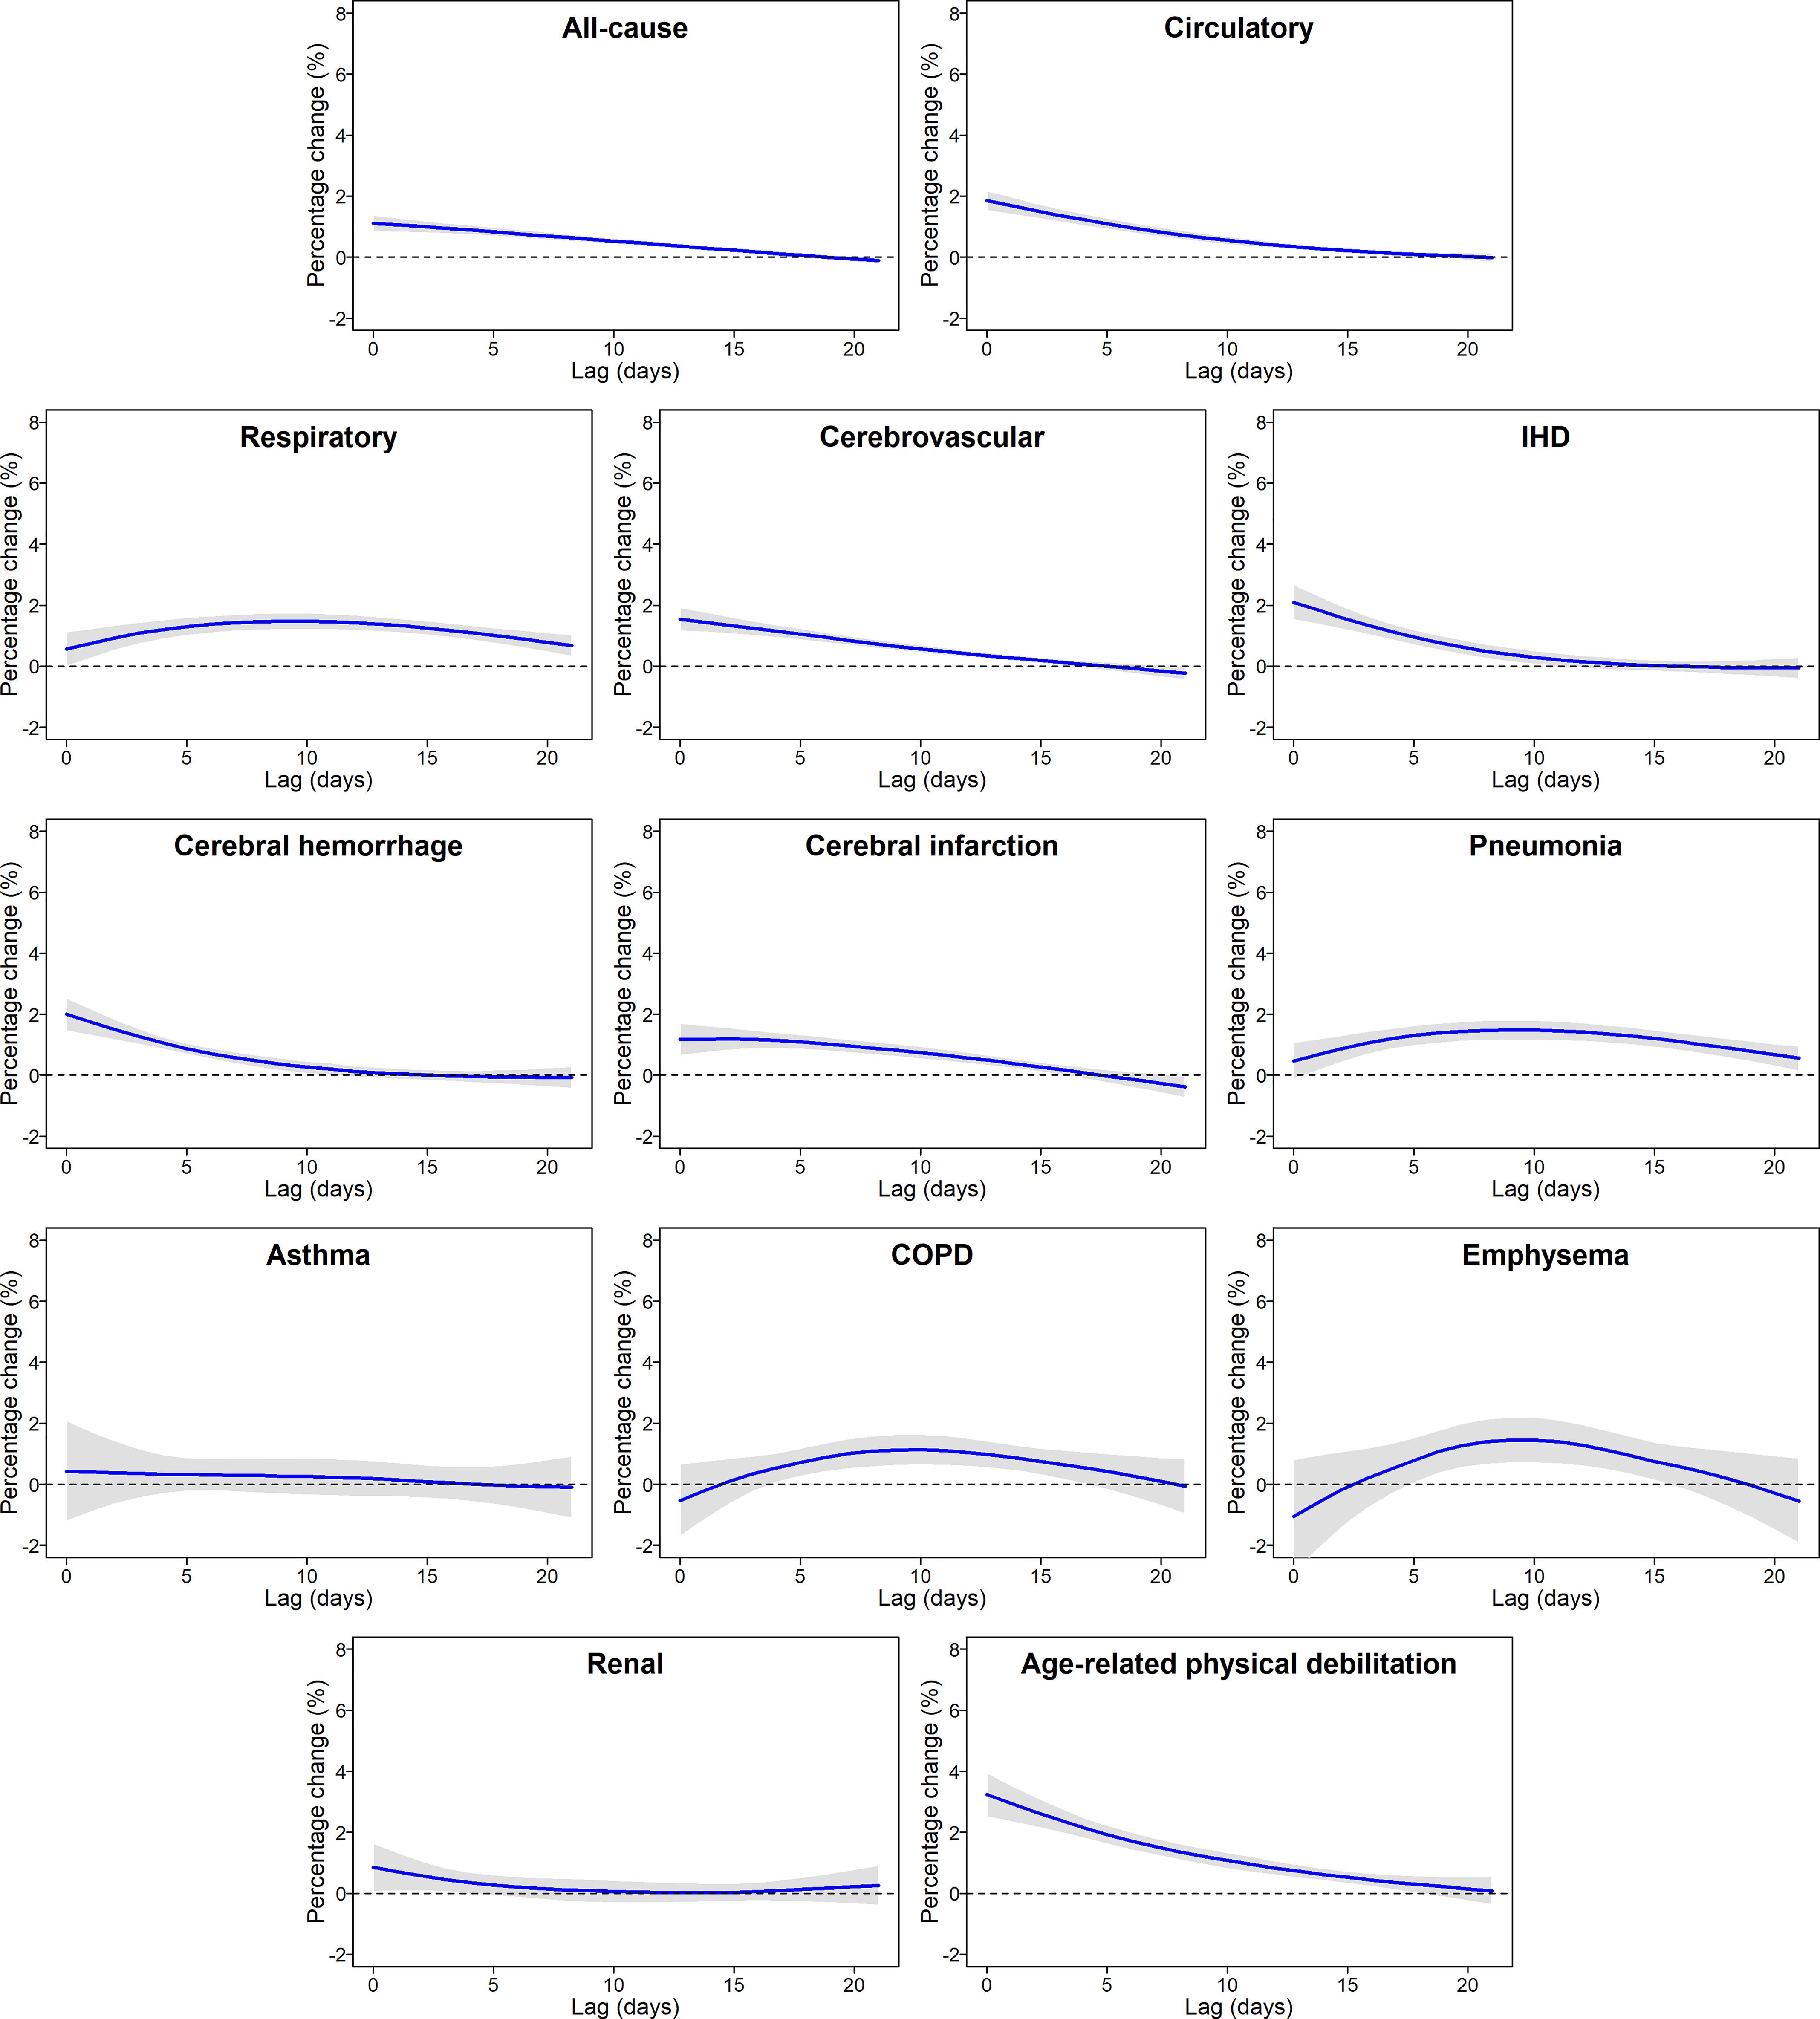
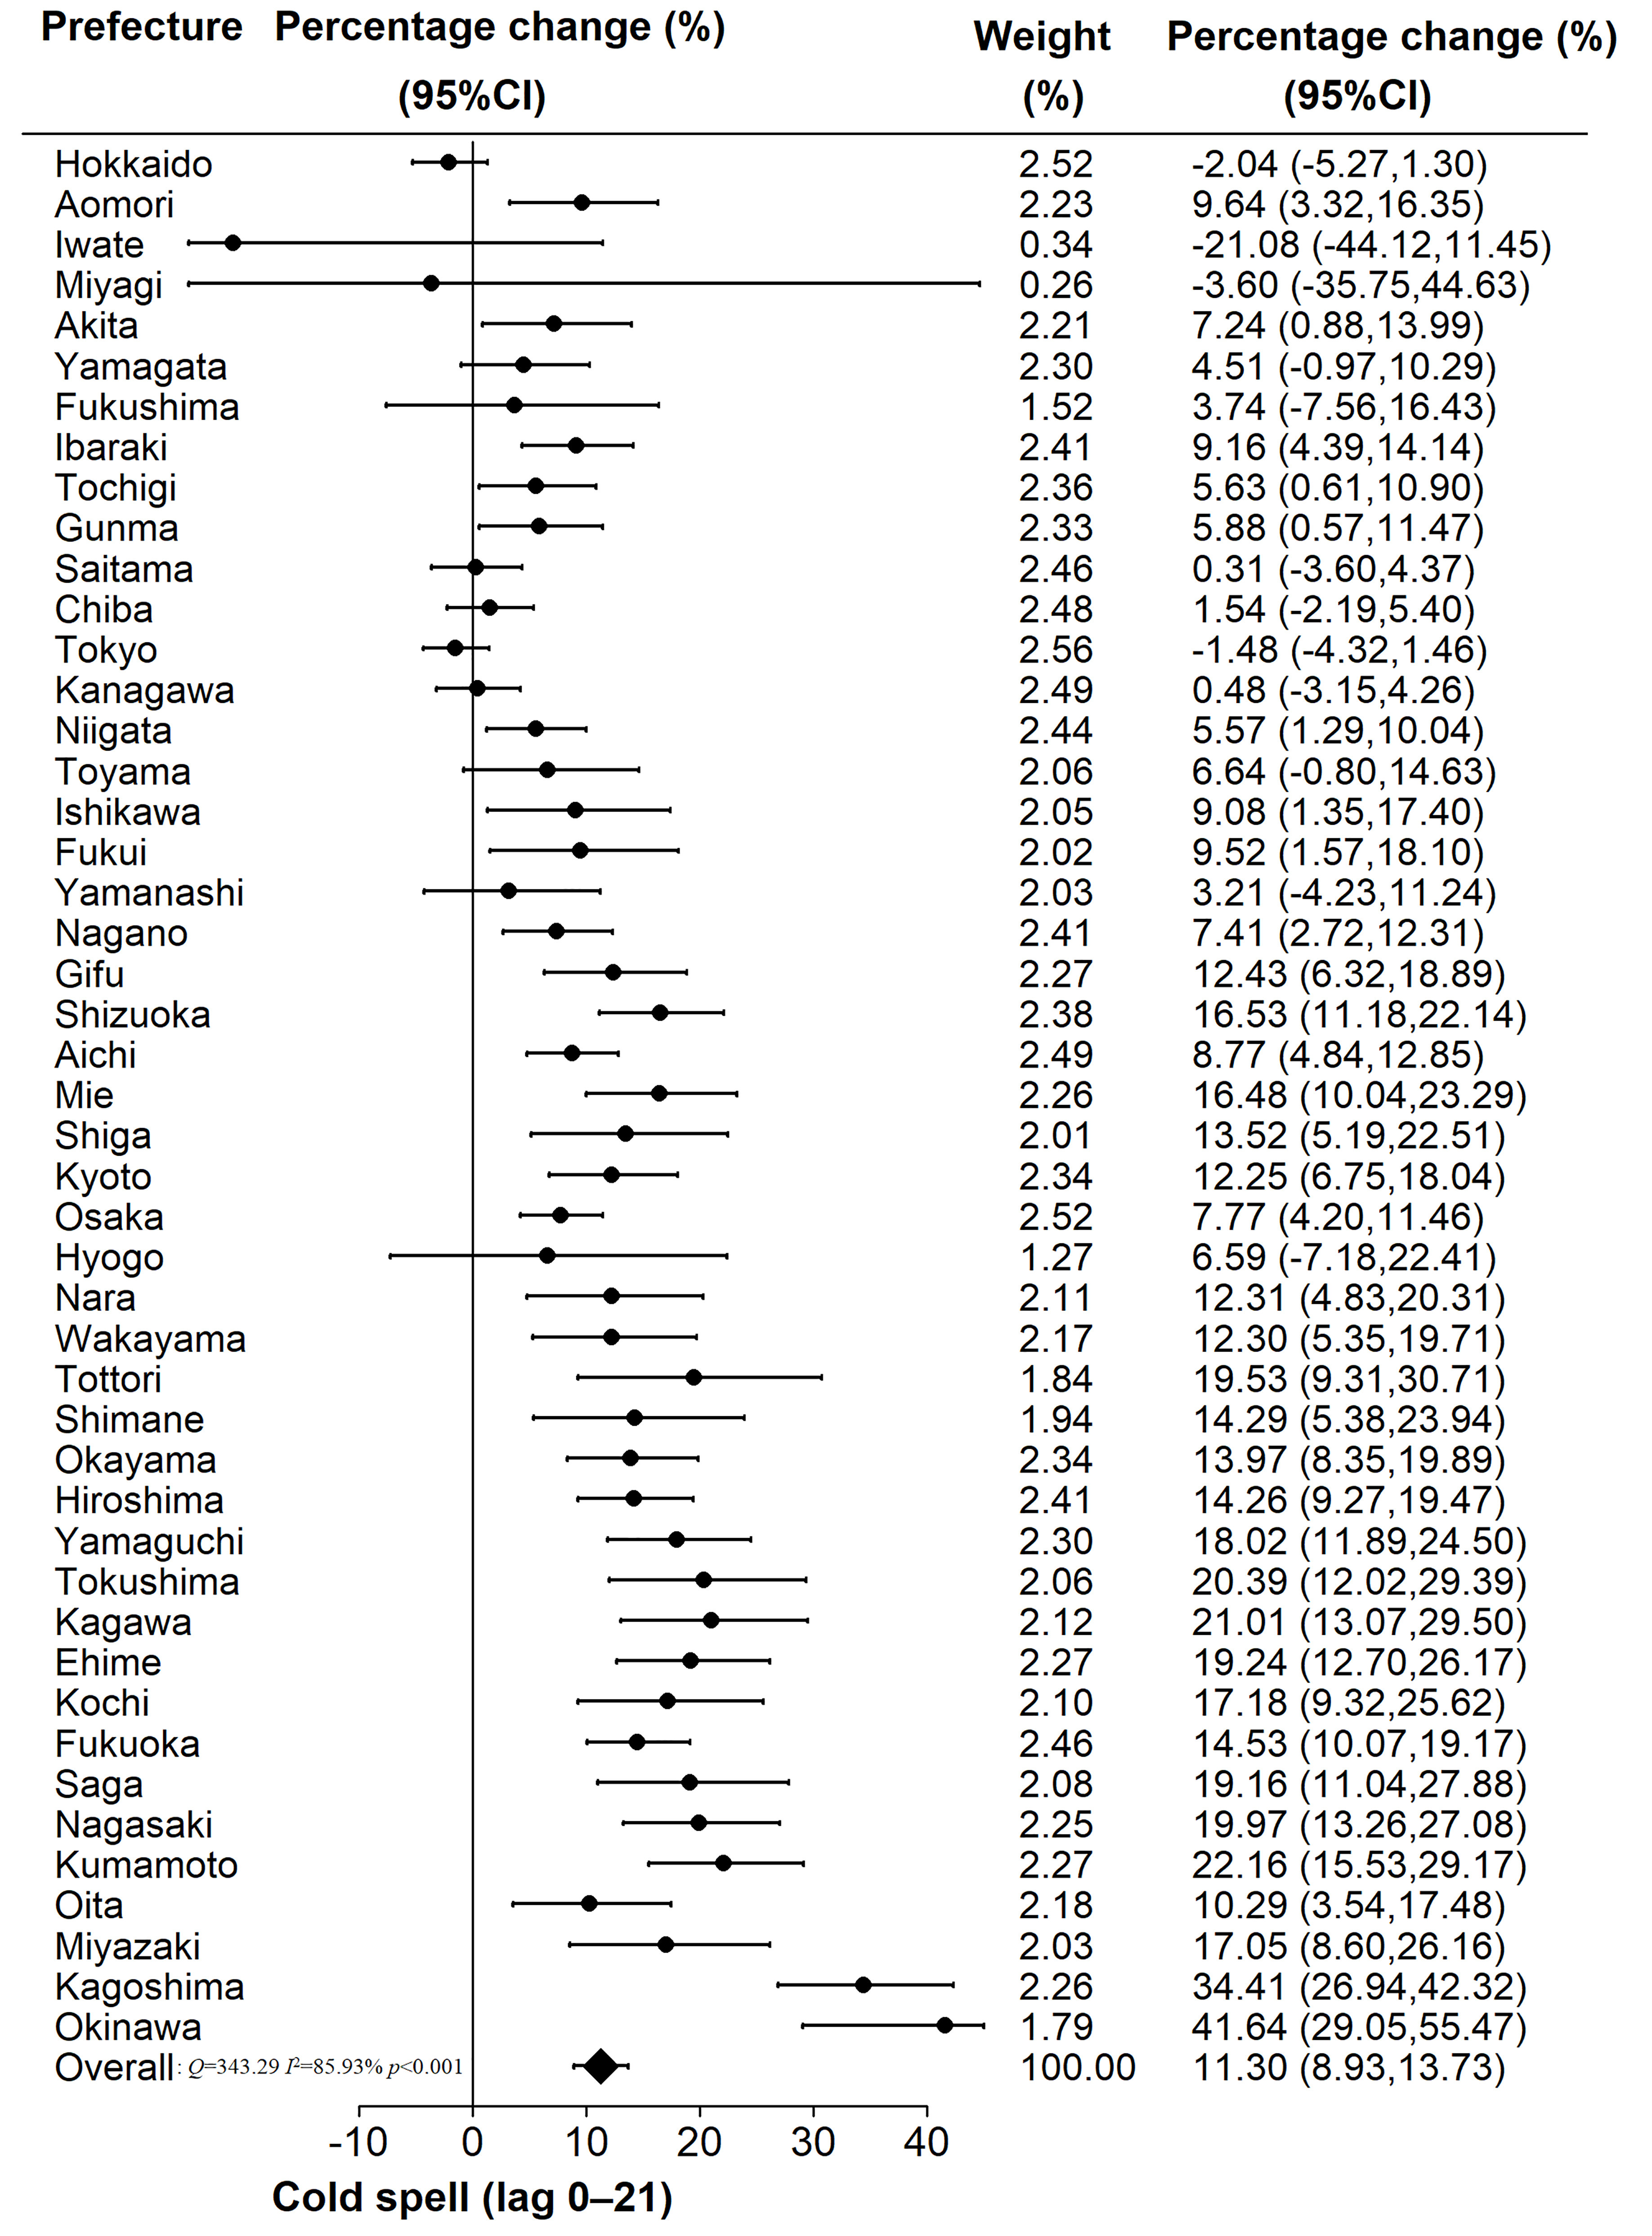
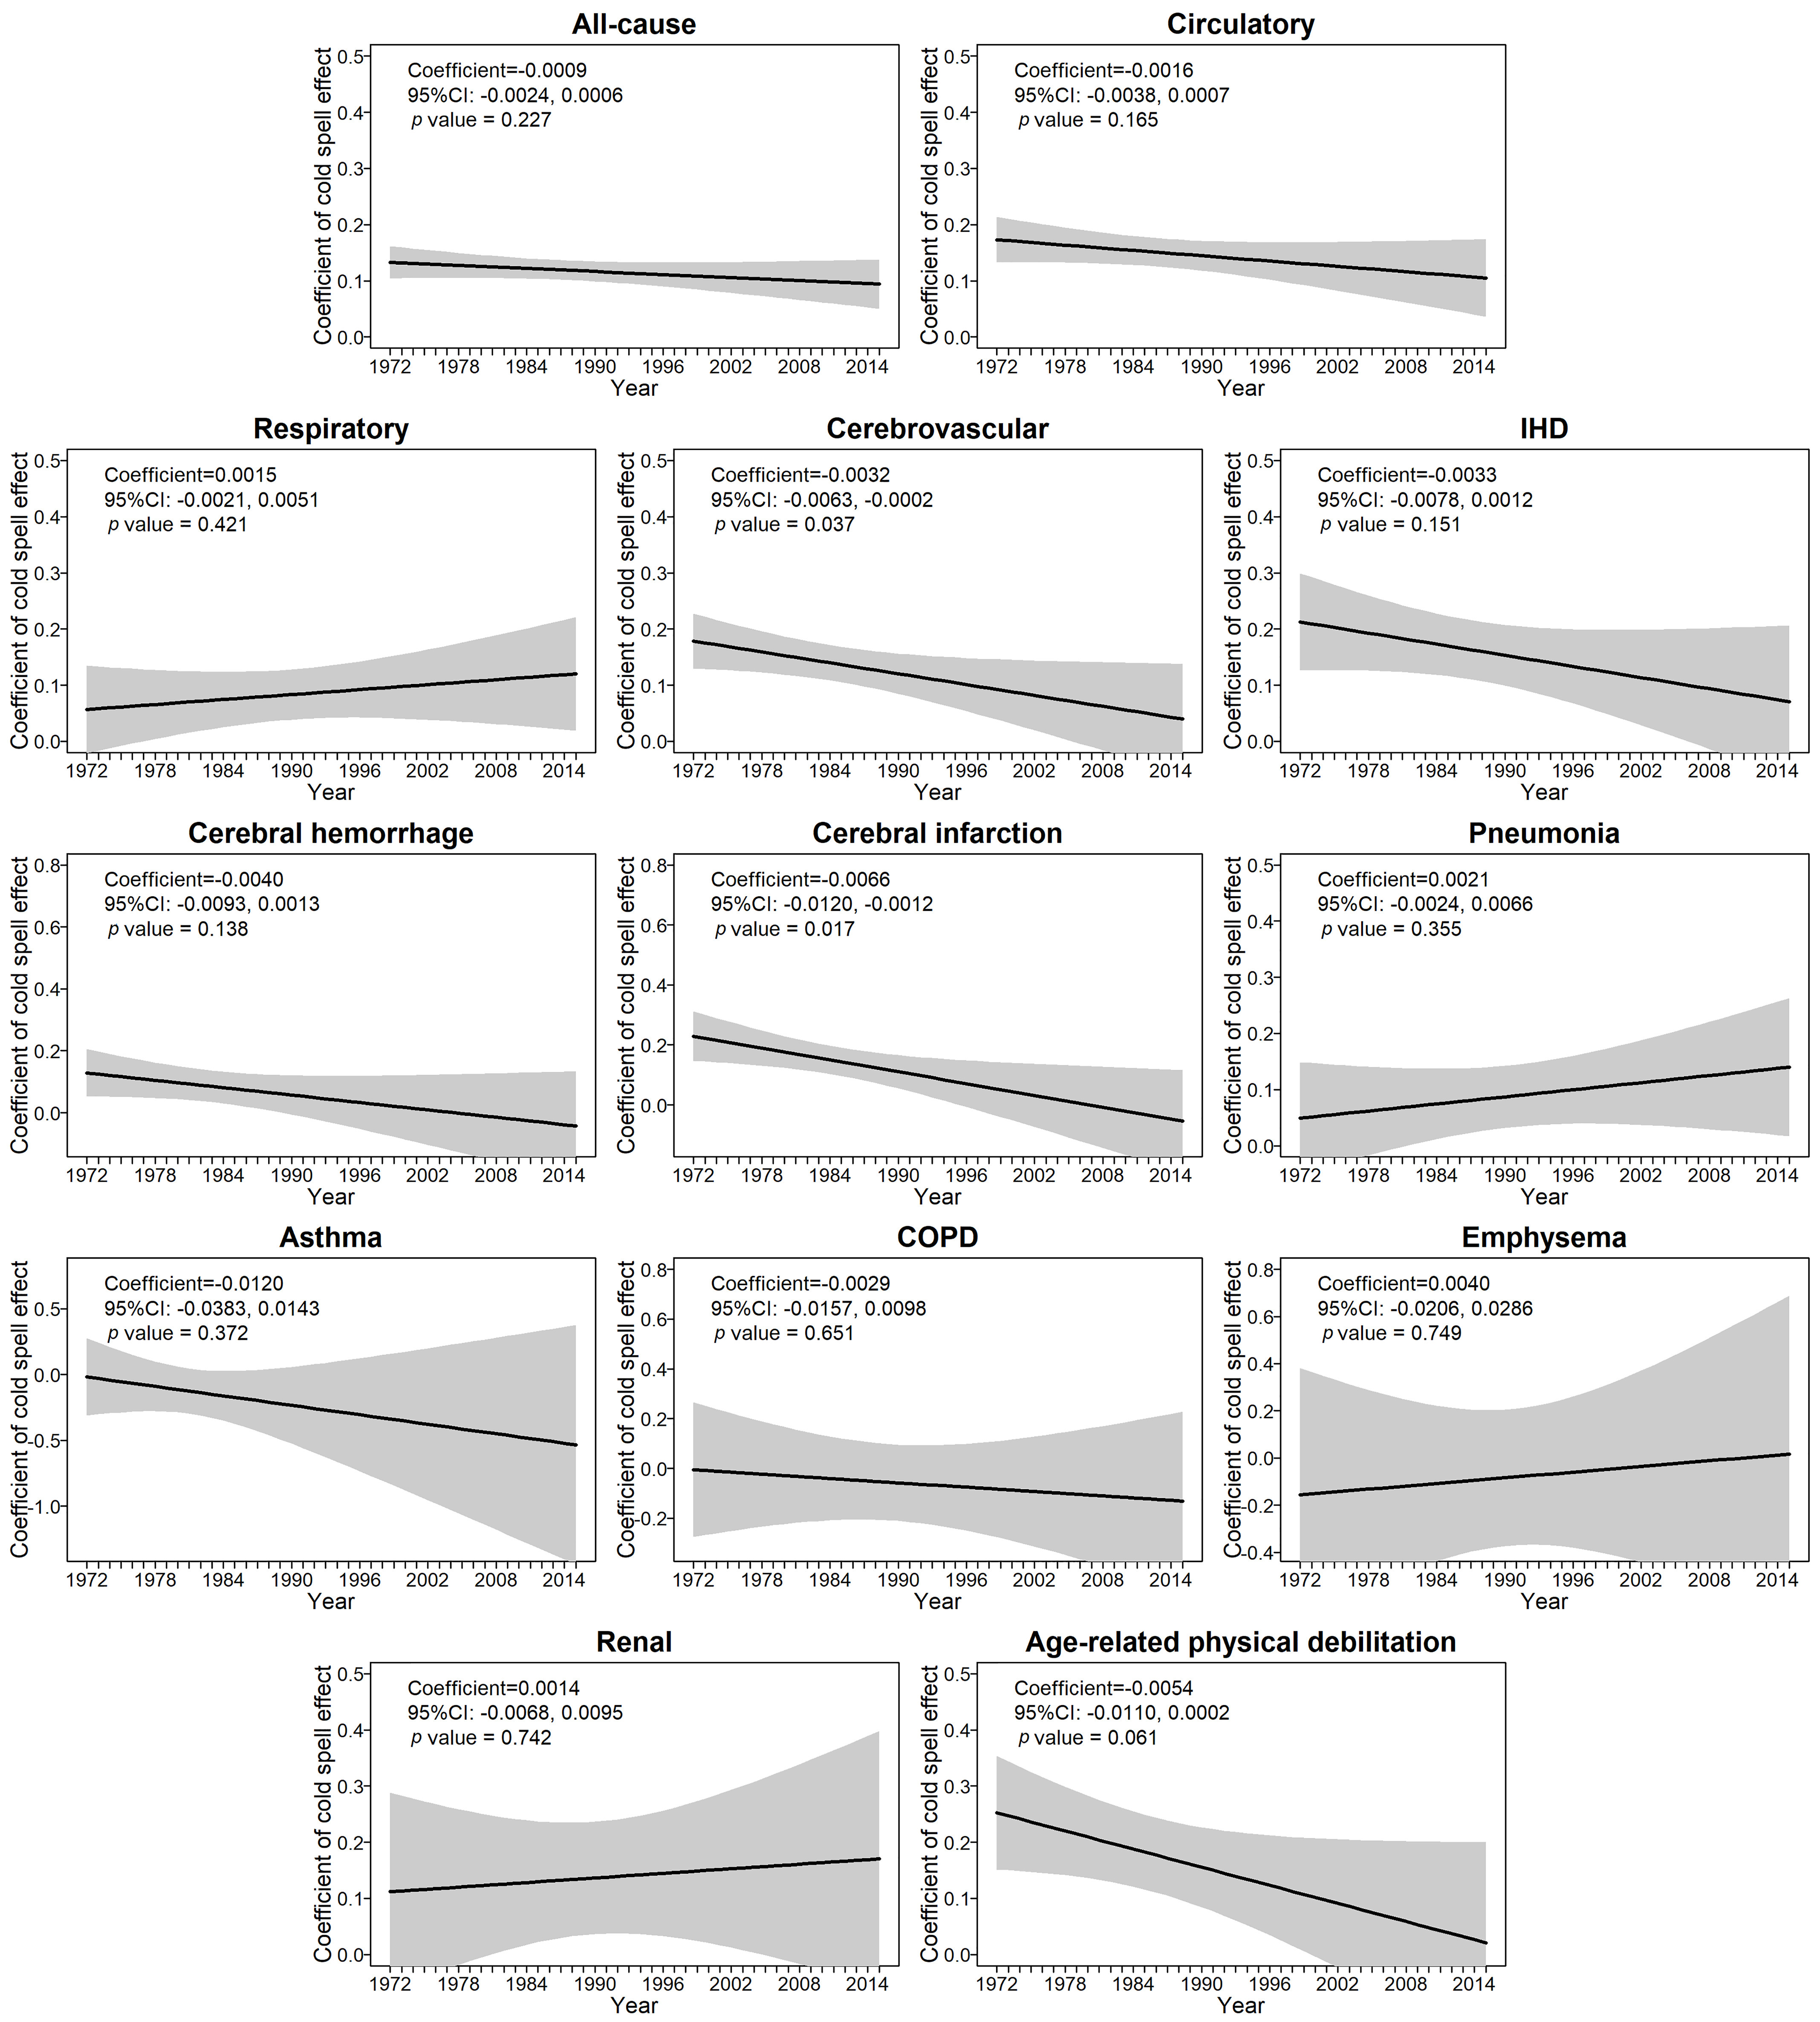
Methods: Daily data for weather conditions and 12 common causes of death during the 1972-2015 cold seasons (November-March) were obtained from 47 Japanese prefectures. Cold spells were defined as consecutive days with daily mean temperatures percentile for the cold season in each prefecture. Quasi-Poisson regression was combined with a distributed lag model to estimate prefecture-specific associations, and pooled associations at the national level were obtained through random-effects meta-analysis. The potential influence of cold spell characteristics (intensity, duration, and timing in season) on associations between cold spells and mortality was examined using a similar two-stage approach. Temporal trends were investigated using a meta-regression model.
Results: A total of 18,139,498 deaths were recorded during study period. Mortality was significantly higher during cold spell days vs. other days for all selected causes of death. Mortality due to age-related physical debilitation was more strongly associated with cold spells than with other causes of death. Associations between cold spells and mortality from all causes and several more specific outcomes were stronger for longer and more intense cold spells and for cold spells earlier in the cold season. However, although all outcomes were positively associated with cold spell duration, findings for cold spell intensity and seasonal timing were heterogeneous across the outcomes. Associations between cold spells and mortality due to cerebrovascular disease, cerebral infarction, and age-related physical debility decreased in magnitude over time, whereas temporal trends were relatively flat for all-cause mortality and other outcomes.
Discussion: Our findings may have implications for establishing tailored public health strategies to prevent avoidable cold spell-related health consequences. https://doi.org/10.1289/EHP7109.
Figures
Similar articles
-
Associations between cold spells and hospital admission and mortality due to diabetes: A nationwide multi-region time-series study in Korea.Sci Total Environ. 2022 Sep 10;838(Pt 3):156464. doi: 10.1016/j.scitotenv.2022.156464. Epub 2022 Jun 2. Sci Total Environ. 2022. PMID: 35660607
-
Cold spell and mortality in 31 Chinese capital cities: Definitions, vulnerability and implications.Environ Int. 2019 Jul;128:271-278. doi: 10.1016/j.envint.2019.04.049. Epub 2019 May 6. Environ Int. 2019. PMID: 31071590
-
Association between Cold Spells and Mortality Risk and Burden: A Nationwide Study in China.Environ Health Perspect. 2022 Feb;130(2):27006. doi: 10.1289/EHP9284. Epub 2022 Feb 14. Environ Health Perspect. 2022. PMID: 35157500 Free PMC article.
-
A systematic review and meta-analysis of cold exposure and cardiovascular disease outcomes.Front Cardiovasc Med. 2023 Mar 27;10:1084611. doi: 10.3389/fcvm.2023.1084611. eCollection 2023. Front Cardiovasc Med. 2023. PMID: 37051068 Free PMC article. Review.
-
Development of prevention strategies against bath-related deaths based on epidemiological surveys of inquest records in Kagoshima Prefecture.Sci Rep. 2023 Feb 8;13(1):2277. doi: 10.1038/s41598-023-29400-7. Sci Rep. 2023. PMID: 36754968 Free PMC article. Review.
Cited by
-
[Cold stress reduces lifespan and mobility of C. elegans by mediating lipid metabolism disorder and abnormal stress].Nan Fang Yi Ke Da Xue Xue Bao. 2022 Aug 20;42(8):1159-1165. doi: 10.12122/j.issn.1673-4254.2022.08.07. Nan Fang Yi Ke Da Xue Xue Bao. 2022. PMID: 36073214 Free PMC article. Chinese.
-
Rising trend and regional disparities of the global burden of disease attributable to ambient low temperature, 1990-2019: An analysis of data from the Global Burden of Disease 2019 study.J Glob Health. 2024 Apr 19;14:04017. doi: 10.7189/jogh.14.04017. J Glob Health. 2024. PMID: 38635810 Free PMC article.
-
A Long Way from Steubenville: Environmental Epidemiology in a Rapidly Changing World.Am J Epidemiol. 2023 Nov 3;192(11):1811-1819. doi: 10.1093/aje/kwac031. Am J Epidemiol. 2023. PMID: 35166328 Free PMC article.
-
From air to mind: unraveling the impact of indoor pollutants on psychiatric disorders.Front Psychiatry. 2025 Jan 9;15:1511475. doi: 10.3389/fpsyt.2024.1511475. eCollection 2024. Front Psychiatry. 2025. PMID: 39850067 Free PMC article. Review.
-
COPD risk due to extreme temperature exposure: combining epidemiological evidence with pathophysiological mechanisms.EBioMedicine. 2025 Jun;116:105731. doi: 10.1016/j.ebiom.2025.105731. Epub 2025 Apr 30. EBioMedicine. 2025. PMID: 40311422 Free PMC article. Review.
References
Publication types
MeSH terms
LinkOut - more resources
Full Text Sources
