. 2021 Aug 2;218(8):e20210583.
doi: 10.1084/jem.20210583. Epub 2021 Jun 15.

Dynamic innate immune response determines susceptibility to SARS-CoV-2 infection and early replication kinetics

Affiliations

Dynamic innate immune response determines susceptibility to SARS-CoV-2 infection and early replication kinetics

Nagarjuna R Cheemarla et al. J Exp Med. .

Abstract

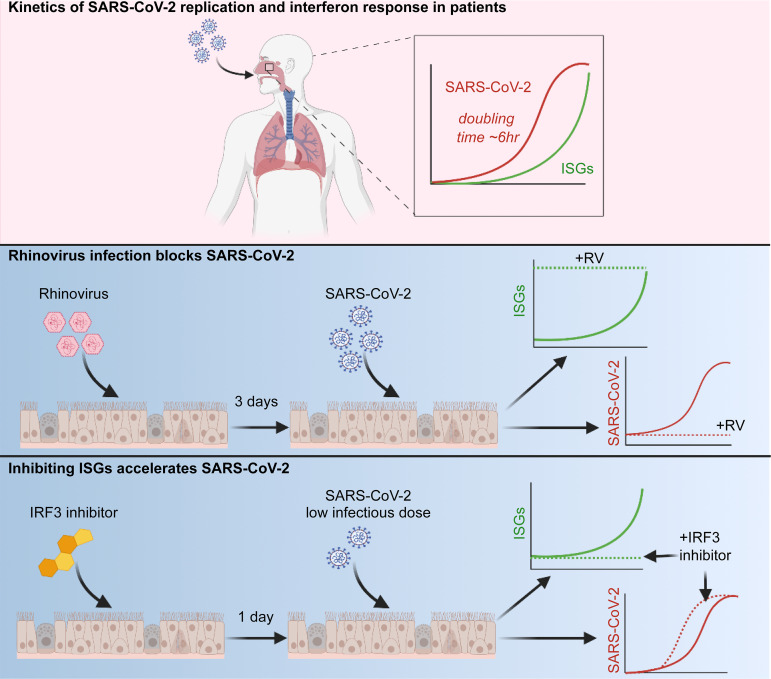
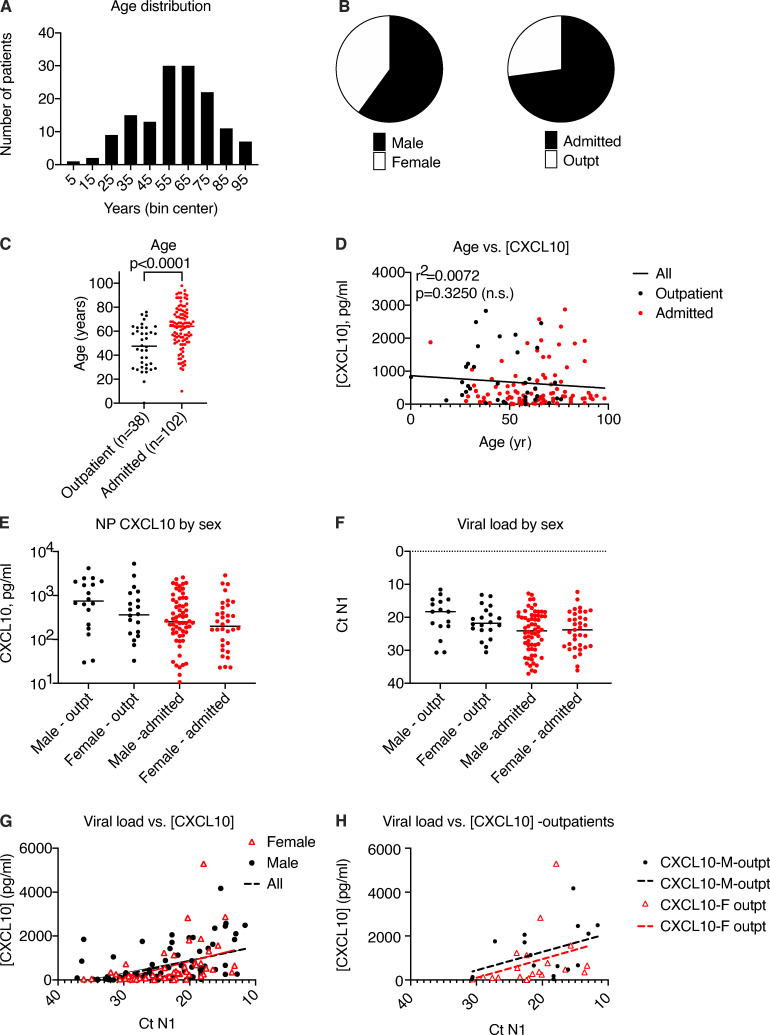
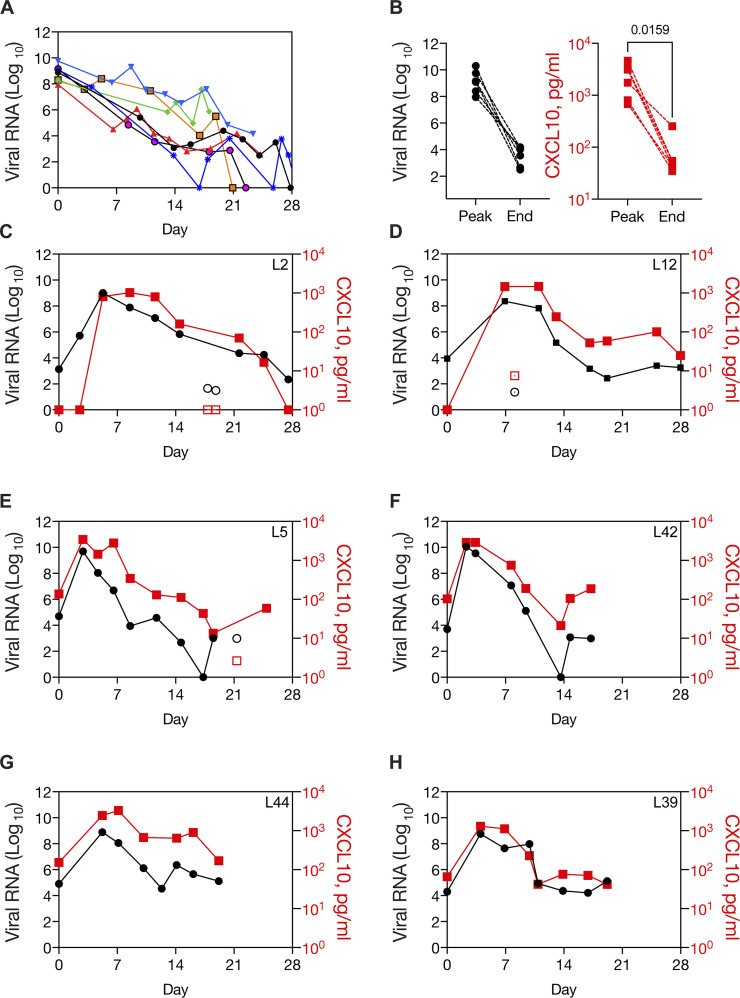
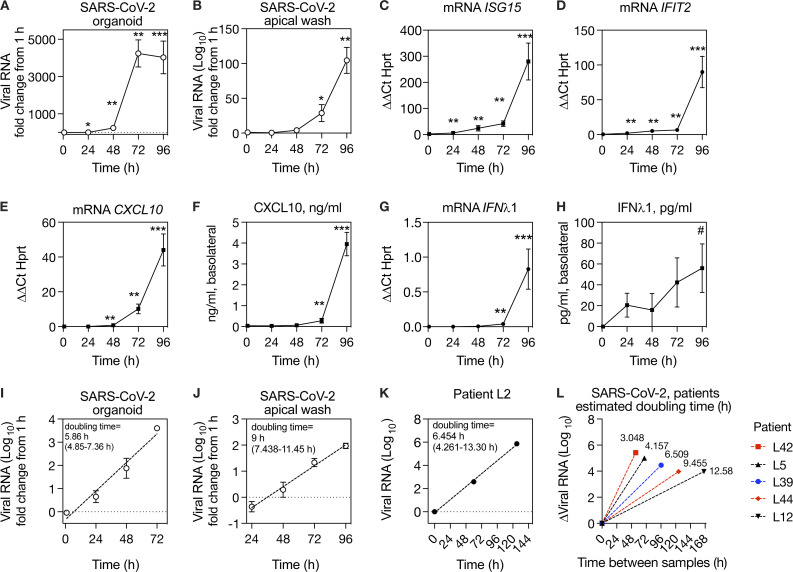
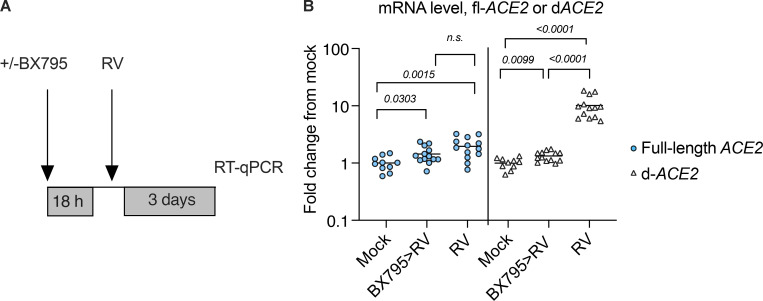
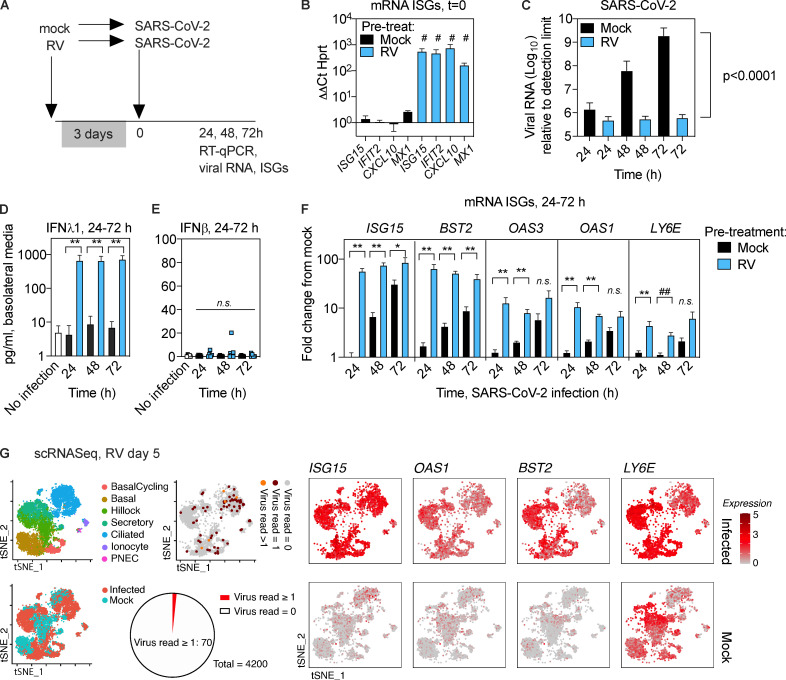
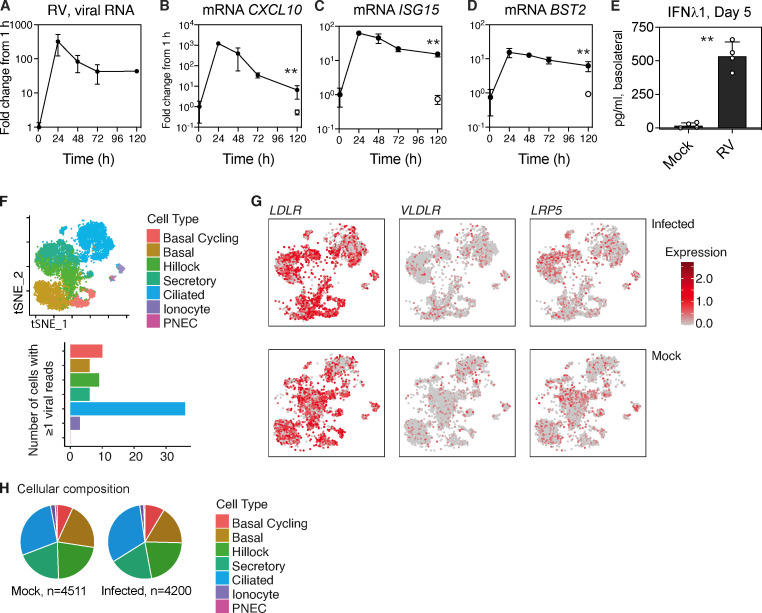
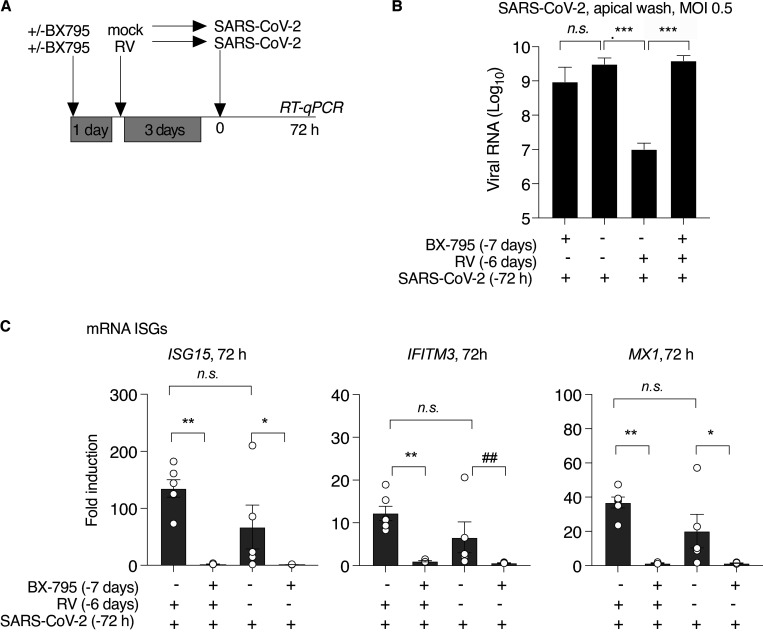
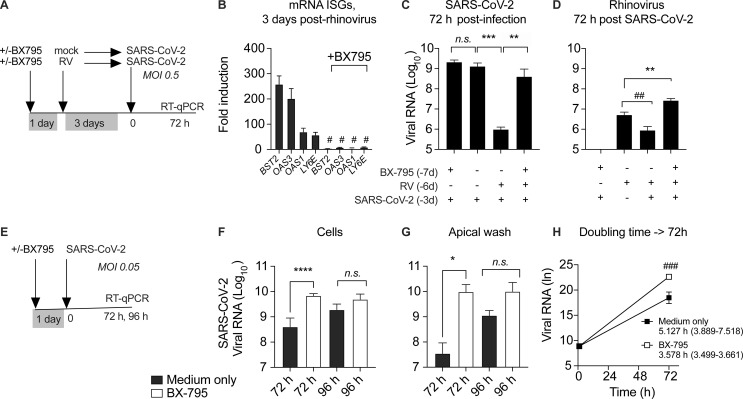
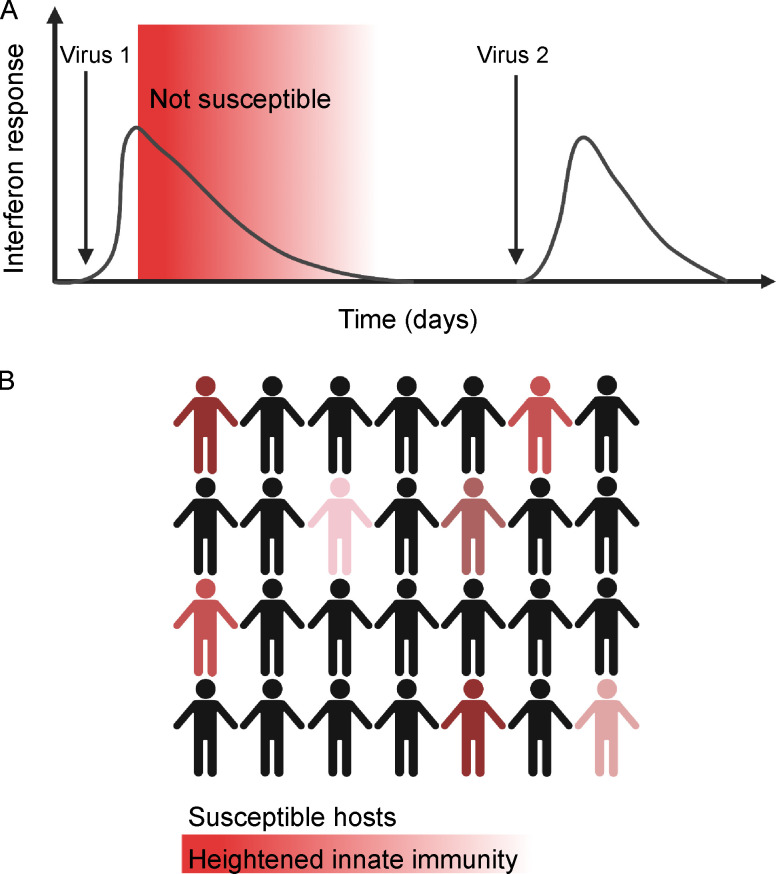
Initial replication of SARS-CoV-2 in the upper respiratory tract is required to establish infection, and the replication level correlates with the likelihood of viral transmission. Here, we examined the role of host innate immune defenses in restricting early SARS-CoV-2 infection using transcriptomics and biomarker-based tracking in serial patient nasopharyngeal samples and experiments with airway epithelial organoids. SARS-CoV-2 initially replicated exponentially, with a doubling time of ∼6 h, and induced interferon-stimulated genes (ISGs) in the upper respiratory tract, which rose with viral replication and peaked just as viral load began to decline. Rhinovirus infection before SARS-CoV-2 exposure accelerated ISG responses and prevented SARS-CoV-2 replication. Conversely, blocking ISG induction during SARS-CoV-2 infection enhanced viral replication from a low infectious dose. These results show that the activity of ISG-mediated defenses at the time of SARS-CoV-2 exposure impacts infection progression and that the heterologous antiviral response induced by a different virus can protect against SARS-CoV-2.


Conflict of interest statement

Disclosures: E.F. Foxman reported a patent application to WO2019/217296 A1 pending, and E.F. Foxman and M. L. Landry reported a patent application to WO2018/071498 pending. No other disclosures were reported.

Figures

None
Graphical abstract
Figure 1.
Figure 1.
Transcriptome analysis of RNA isolated from SARS-CoV-2–positive NP swabs. Related to Fig. S1 and Table S1, Table S2, Table S3, Table S4, Table S5, and Table S6. (A) Volcano plot showing significantly differentially expressed protein-coding genes based on RNA-seq of NP swab RNA from SARS-CoV-2 patients (n = 30) compared with control SARS-CoV-2–negative subjects (n = 8). Transcripts with FC > 2 and adjusted P value < 0.05 are highlighted in red. (B) Top 20 Ingenuity pathways enriched in SARS-CoV-2–positive patients compared with controls based on 1,770 differentially expressed RNAs. P value and Z score for each pathway are indicated on the x axis. Pathways related to IFN and IFN regulatory factor signaling are highlighted in blue. NK, natural killer; Th, T helper; NO, nitric oxide; IRF, IFN regulatory factor. (C) Transcription factor–binding sites associated with NP transcripts enriched in SARS-CoV-2–positive patients compared with controls. Bars show strength of association of motifs/tracks with enriched transcripts, indicated by normalized enrichment score (NES). The y axis label indicates top transcription factor associated with each cluster of motifs (M) or tracks (T) and the cluster code. The number of enriched transcripts associated with each track/motif is indicated to the right of each bar. Transcription factors associated with the IFN response are highlighted in blue. (D) Graphical summary of pathways and regulators enriched based on Ingenuity Pathway Analysis of differentially expressed genes enriched in NP RNA of SARS-CoV-2–positive patients compared with controls. Colored lines indicate relationship between nodes, with orange lines showing enhancement and blue arrows showing suppression of a biological process by an upstream regulator (e.g., IFNλ1→suppression of viral infection). (E) Heatmap showing relative expression level of the top 45 most significant differentially expressed genes in patients (left) or SARS-CoV-2–negative controls (right). Clinical characteristics of each patient are indicated by color: viral load (red = highest viral load/lowest Ct value, green = lowest viral load/highest Ct value); NP CXCL10 protein level (red = highest, green = lowest, white = data not available). Heatmap colors represent values from highest (red) to lowest (green) for viral load (based on Ct value), CXCL10 concentration (pg/ml), or gene expression level, scaled from minimum to maximum (green = 0; yellow = 0.5, red = 1) Patient characteristics indicated at the top of the graph include admission status (gray, outpatient; black, admitted), sex (blue, male; pink, female), and age (blue, <55 yr; purple, >60 yr); white, data not available. Outpt., outpatient. (F) Correlation between reads mapping to CXCL10 and reads mapping to other ISGs (IFIT2, OASL, and ISG15). (G) Correlation between reads mapping to CXCL10 and CXCL10 protein measured by ELISA in NP swab–associated viral transport medium. PRR, pattern recognition receptor; SLE, systemic lupus erythematosus; PKR, protein kinase R; iCOS-iCOSL, inducible T cell costimulator and inducible T cell costimulator ligand.
Figure S1.
Figure S1.
iRegulon analysis of transcription factor–binding sites enriched in RNA from control subjects compared with SARS-CoV-2–positive patients. Related to Fig 1. (A) Transcription factor (TF) motifs/track–binding sites enriched in NP RNA from control subjects. Bars show strength of association (normalized enrichment score [NES]) with motifs/tracks and associated transcription factors. Transcription factors associated with regulation of neuronal tissue–specific genes are highlighted in red. (B and C) Targets of transcription factors REST (B) and POU3F2 (C) enriched in NP RNA from control subjects. Red text indicates targets previously shown to be more highly expressed in olfactory compared with respiratory epithelium. Asterisks indicate transcripts also enriched in olfactory sensory neurons (olfactory epithelium, respiratory epithelium, and olfactory sensory neuron expression data are from Olender et al., 2016).
Figure 2.
Figure 2.
Relationship between NP CXCL10 and viral load in 140 SARS-CoV-2–positive patients. Related to Fig. S2. (A) NP CXCL10 level in patients testing positive for SARS-CoV-2 by RT-qPCR at Yale New Haven Hospital in March 2020. Black symbols indicate patients tested as outpatients or in the emergency department and not admitted to the hospital, and red symbols indicate patients admitted to the hospital. (B) Ct value for SARS-CoV-2 N1 gene in outpatients and admitted patients. Number in parentheses (A and B) indicates the number of outpatient (total n = 38) and admitted (total n = 102) samples for which data were available. Difference between groups was evaluated using an unpaired Student’s t test, with P values shown. (C) Regression analysis showing relationship between viral load and NP CXCL10 protein for all samples (black solid line, r2 and P value indicated) or only outpatients (dashed black line) or admitted patients (dotted red line). (D) Days of symptoms reported before testing for samples with this information available (number indicated in parentheses). Difference was not significant by a Student’s t test.
Figure S2.
Figure S2.
Relationship between age or sex and and NP CXCL10 in 140 SARS-CoV-2–positive patients. Related to Fig 2. (A) Age distribution of 140 patients studied. (B) Sex distribution of 140 patients studied. (B) Sex distribution and inpatient/outpatient status of 140 patients studied. (C) Comparison of age in outpatients versus admitted patients. Number of patients shown in parentheses. Groups were compared by unpaired t test, with P value shown. (D) Correlation analysis showing lack of significant correlation between age and NP CXCL10 protein level, based on 140 patients. (E and F) Comparison of NP CXCL10 protein level (E) and viral load (F) based on age and inpatient/outpatient status. No significant differences were detected between groups by unpaired t test. (G and H) Correlation between viral load and NP CXCL10 in all patients (G) and outpatients (H) in all patients or patients segregated by sex. For all patients, according to simple linear regression analysis, the slope of all samples is significantly nonzero (r2 = 0.2030, P < 0.0001), but slopes are not significantly different for each sex. For outpatients only, the slope of the regression line is not significantly nonzero, likely due to lower numbers (male [M] outpatient, n = 18; female [F] outpatient, n = 20).
Figure 3.
Figure 3.
Dynamic innate immune response to SARS-CoV-2 in the nasopharynx in patients diagnosed before peak viral load. Related to Fig. S3 and Table S7. (A) Viral load over time in longitudinal samples from seven patients with high viral load in the first sample (Ct N1 > 20). (B) Paired viral RNA and NP CXCL10 measurements at the peak viral load and at the end viral load, defined as the first sample with Ct N1 > 30, for six patients shown in G (data not available for one sample). CXCL10 level was significantly different in peak and end samples by paired t test. (C–H) Viral load and NP CXCL10 level in longitudinal samples from SARS-CoV-2–positive patients who presented with a low viral load (Ct N1 > 28) that increased to a high viral load (Ct N1 < 20). Viral load is expressed as FC from the limit of detection for the SARS-CoV-2 N1 gene (black circles) and CXCL10 is expressed as picograms per milliliter in the NP swab–associated viral transport medium (red squares). Samples with low levels of RNaseP, an indicator of sample quality, are shown with open symbols. Patient characteristics are described in Table S7.
Figure 4.
Figure 4.
Kinetics of SARS-CoV-2 replication in organoids and in vivo.(A and B) Time course of SARS-CoV-2 replication in human primary airway epithelial organoids, expressed as fold increase from 1 h (postinoculation time point). (C–E) ISG mRNA level relative to HPRT mRNA in organoids during SARS-CoV-2 infection. (F) CXCL10 protein in the basolateral medium during SARS-CoV-2 replication. (G) IFNλ1 mRNA level relative to HPRT in organoids during SARS-CoV-2 infection. (H) IFNλ1 protein in the basolateral medium during SARS-CoV-2 infection. (I) Exponential curve fit for increase in SARS-CoV-2 RNA in organoids from 1 to 72 h and calculated doubling time for exponential growth, based on data also shown in A, with 95% CI. (J) Exponential curve fit for increase in SARS-CoV-2 RNA shed from apical surface from 24 to 96 h and calculated doubling time for exponential growth, based on data also shown in B, with 95% CI. (K) Exponential curve fit for increase in viral RNA during SARS-CoV-2 replication for first three virus-positive samples from patient L2 and calculated doubling time for exponential growth with 95% CI. (L) Estimated doubling times for increase in viral RNA during SARS-CoV-2 replication in patients with one SARS-CoV-2–positive sample before peak viral load, shown in Fig 3, D–H. The y axis shows change in viral RNA, and the x axis shows time interval between samples. Doubling time calculation assumes exponential growth between first and peak viral load samples. For A–J, symbols show mean and SEM of four to six biological replicates per condition, and data are representative of two independent experiments with primary epithelial cells from different donors. For K and L, data from six individual patients are shown (one patient in K and five patients in L). Symbols indicate significant difference from the t = 1 h after inoculation time point by Mann–Whitney test (*, P = 0.0317; #, P = 0.0152; **, P = 0.0079; ***, P = 0.0043).
Figure S3.
Figure S3.
Expression level of full-length ACE2 and the truncated variant dACE2 in mock-treated airway epithelial organoids following RV infection (HRV-01A). Related to Fig 5. (A) Organoids were mock infected or infected with RV. Some RV-infected cultures were pretreated for 18 h with 6 μM BX795 before infection with RV. (B) RT-qPCR was performed to quantify transcripts for full-length ACE2 (blue circles) or dACE2 (white triangles). Plot shows compiled data from three independent experiments, each with three to five biological replicates per condition. Individual values are shown (10–13 per condition). Numbers indicate P values of the Mann–Whitney test for significant differences between conditions. The primers used for full-length ACE2 target the junction of exons 8 and 9 are unique to the full-length ACE2, and the primers used for dACE2 target the junction of exons 1 and 2 are unique to dACE2, as previously described by Onabajo et al., 2020.
Figure 5.
Figure 5.
Effect of prior RV infection on ISG induction and SARS-CoV-2 replication in human airway epithelial organoids.(A) Timing of infection of epithelial organoids with RV followed by SARS-CoV-2. (B) Expression of ISGs in airway epithelial organoids 3 d after RV infection, relative to mRNA for the housekeeping gene HPRT. (C) SARS-CoV-2 viral RNA at 24, 48, and 72 h after infection, with or without RV preinfection. P value represents difference between exponential growth curves fit to the data. (D) ELISA for IFNλ1 in basolateral media from uninfected organoid cultures or cultures infected with SARS-CoV-2 with or without RV preinfection. (E) ELISA for IFNβ in basolateral media from uninfected organoid cultures or cultures infected with SARS-CoV-2 with or without RV preinfection. (F) Expression of ISGs at 24, 48, and 72 h after SARS-CoV-2 infection, with or without RV preinfection, expressed as FC from uninfected cells. (G) Single-cell sequencing of human airway epithelial cell organoids, mock or 5 d after RV infection. Red and orange dots indicate 70/4,200 cells with detectable viral RNA at this time point in RV-infected cultures. tSNE plots show expression of mRNA for ISGs in mock and infected cultures at the same time point. Both conditions are from a single experiment using organoids from the same donor, with data from 8,711 cells (mock, n = 4,200 cells; infected, n = 4,511 cells). PNEC, pulmonary neuroendocrine cell. For B, bars show mean and SEM of four replicates per condition. Data are representative of three independent experiments with organoids from different primary cell donors. For C–F, bars show mean and SEM of four to six biological replicates per condition. Data are representative of two independent experiments with organoids from different primary cell donors. For B–F, significant differences between conditions were evaluated by the Mann–Whitney test (*, P = 0.0317; #, P = 0.0286; ##, P = 0.0159; **, P = 0.0079).
Figure S4.
Figure S4.
Effects of RV1A replication in differentiated primary human bronchial epithelial cultures. Related to Fig 5. (A–E) HRV-01A replication in bronchial epithelial organoids and host response over 5 d. (A–D) Viral RNA level and ISG mRNA levels are graphed as FC from ISG level at t = 1 h (postinoculation time point). Open symbols represent ISG levels in mock-infected cultures at day 5. Each point shows mean and SD of four biological replicates per condition. Results are representative of two independent experiments. Significant difference between mock and infected at day 5 is indicated by asterisks (**, P = 0.0286, Mann–Whitney test). (E) Protein level of IFNλ1 in the basolateral media at day 5 for mock- and RV-infected cultures. Graphs show mean and SD of four biological replicates per condition (A–E). Significant difference between mock and infected at day 5 is indicated by asterisks (**, P = 0.0286, Mann–Whitney test). (F) Cell type–specific RV infection in human bronchial epithelial organoid cultures 5 d after infection with RV (HRV-01A) or mock infection. Top panel shows cell types present, and bottom panel shows cell type–specific distribution of 70 cells containing at least one viral read. (G) Expression level of entry receptors for HRV-01A (LDLR, VLDLR, and LRP5) in RV-infected (top) or in mock-treated cultures (bottom panels). (H) Cellular composition of mock- or RV-1A–infected organoids at day 5 after infection.
Figure S5.
Figure S5.
SARS-CoV-2 viral load in apical wash, and ISG expression in organoids following pretreatment with BX795 in sequential RV, SARS-CoV-2 infection. Related to Fig 6, A–D. (A–C) Organoid cultures were pretreated with or without BX795 for 18 h, mock infected or infected with HRV-01A, incubated for 3 d, and then infected with SARS-CoV-2, MOI 0.5 (from the experiment shown in Fig 6, A–D). SARS-CoV-2 viral RNA level relative to the limit of detection in RNA isolated from the apical wash collected 72 h after SARS-CoV-2 infection, with and without BX795 and/or RV pretreatment. ISG mRNA levels relative to levels in mock-treated cultures. Bars show mean, and symbols show individual replicates. Bars show mean and SEM of five or six replicates per condition. Symbols indicate significant difference by Mann–Whitney test (***, P = 0.0043; ##, P = 0.0079; **, P = 0.0095; *, P = 0.0159). Data are representative of two independent experiments each with at four to six biological replicates per condition.
Figure 6.
Figure 6.
Effect of pretreatment with BX795 during sequential RV, SARS-CoV-2 infection, and low-MOI SARS-COV-2 infection. (A) Organoid cultures were pretreated with or without BX795 for 18 h, mock infected or infected with HRV-01A, incubated for 3 d, and then infected with SARS-CoV-2 MOI 0.5. BX795 was present throughout the experiment. (B) Effect of BX795 pretreatment on ISG induction 3 d after RV infection. Bars show FC in ISG mRNA level in RV infected cultures compared with mock without (left) or with (right) BX795 pretreatment. Bars shown mean and SEM of four replicates per condition and are representative of three independent experiments using primary cells from different donors. Significant difference in ISG level by Mann–Whitney is indicated (#, P = 0.0303). (C) SARS-CoV-2 viral RNA level relative to the limit of detection in organoid cultures 72 h after SARS-CoV-2 infection, with and without BX795 and/or RV pretreatment. (D) HRV-01A viral RNA level relative to the limit of detection in organoid cultures 72 h after SARS-CoV-2 infection, with and without BX795 and/or RV pretreatment. This graph also includes cultures infected with RV, but not subsequently infected with SARS-CoV-2. (E) Cultures were pretreated with 6 µM BX795 or medium only for 18 h and then inoculated with SARS-CoV-2, MOI 0.05, at t = 0 (F–H). (F) SARS-CoV-2 viral RNA level relative to the limit of detection in organoid cultures 72 h after infection, with and without BX795 pretreatment (black or white bars, respectively. (G) SARS-CoV-2 viral RNA level relative to the limit of detection in apical wash 72 h after infection, with and without BX795 pretreatment (black or white bars, respectively). (H) Doubling time calculations for SARS-CoV-2 in organoids with and without BX795 pretreatment, assuming exponential growth between 1 and 72 h. Exponential growth curves were compared by the extra sum-of-squares F-test and found to be significantly different (###, P = 0.0011). For C, D, F, and G, bars show mean and SEM of four to six biological replicates per condition. P values indicate significant differences in ISG or viral RNA by Mann–Whitney test (*, P = 0.0449; ##, P = 0.0286; **, P = 0.0095; ***, P = 0.0043; ****, P < 0.0001). Data are representative of two independent experiments using primary cells from different donors.
Figure 7.
Figure 7.
Model. Heterologous innate immunity creates a subset of individuals refractory to infection during periods of high respiratory virus circulation. (A) Virus 1 induces a mucosal IFN response, which creates a refractory period following infection during which ISGs are elevated and the host is protected from a second viral infection (red shading). After ISGs return to baseline, the host is again susceptible and can be infected with virus 2. (B) During periods of high respiratory virus circulation, a fraction of the population is refractory to infection at any given time due to ISG activation from a recent infection (red shaded figures). Thus, heterologous innate immune protection could mitigate against viral transmission at times of high respiratory virus circulation. Figure created with BioRender.com.

Update of

Comment in

References

    1. Ånestad, G., and Nordbø S.A.. 2011. Virus interference. Did rhinoviruses activity hamper the progress of the 2009 influenza A (H1N1) pandemic in Norway? Med. Hypotheses. 77:1132–1134. 10.1016/j.mehy.2011.09.021 - DOI - PubMed
    1. Asgari, S., Schlapbach L.J., Anchisi S., Hammer C., Bartha I., Junier T., Mottet-Osman G., Posfay-Barbe K.M., Longchamp D., Stocker M., et al. . 2017. Severe viral respiratory infections in children with IFIH1 loss-of-function mutations. Proc. Natl. Acad. Sci. USA. 114:8342–8347. 10.1073/pnas.1704259114 - DOI - PMC - PubMed
    1. Baker, R.E., Park S.W., Yang W., Vecchi G.A., Metcalf C.J.E., and Grenfell B.T.. 2020. The impact of COVID-19 nonpharmaceutical interventions on the future dynamics of endemic infections. Proc. Natl. Acad. Sci. USA. 117:30547–30553. 10.1073/pnas.2013182117 - DOI - PMC - PubMed
    1. Banerjee, A.K., Blanco M.R., Bruce E.A., Honson D.D., Chen L.M., Chow A., Bhat P., Ollikainen N., Quinodoz S.A., Loney C., et al. . 2020a. SARS-CoV-2 Disrupts Splicing, Translation, and Protein Trafficking to Suppress Host Defenses. Cell. 183:1325–1339.e21. 10.1016/j.cell.2020.10.004 - DOI - PMC - PubMed
    1. Banerjee, A.K., Blanco M.R., Bruce E.A., Honson D.D., Chen L.M., Chow A., Bhat P., Ollikainen N., Quinodoz S.A., Loney C., et al. . 2020b. SARS-CoV-2 Disrupts Splicing, Translation, and Protein Trafficking to Suppress Host Defenses. Cell. 183:1325–1339.e21. 10.1016/j.cell.2020.10.004 - DOI - PMC - PubMed

Publication types

MeSH terms