. 2021 Sep 4;144(8):2471-2485.
doi: 10.1093/brain/awab226.

Induced pluripotent stem cell-derived motor neurons of CMT type 2 patients reveal progressive mitochondrial dysfunction

Affiliations

Induced pluripotent stem cell-derived motor neurons of CMT type 2 patients reveal progressive mitochondrial dysfunction

Jonas Van Lent et al. Brain. .

Abstract

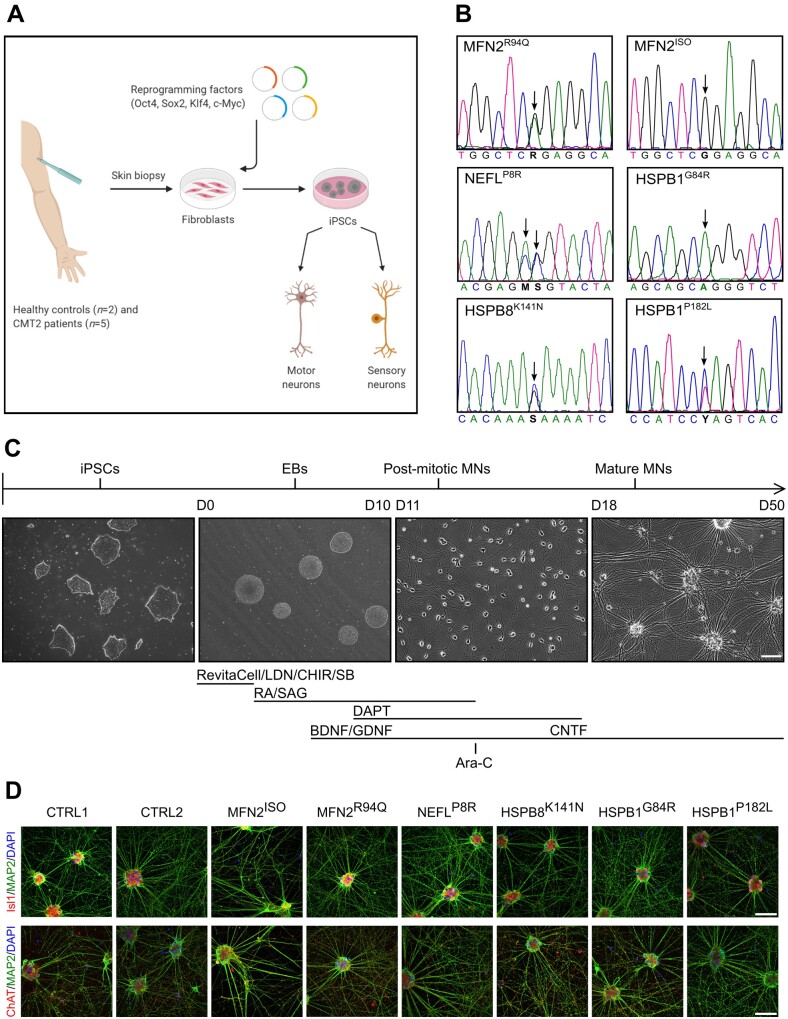
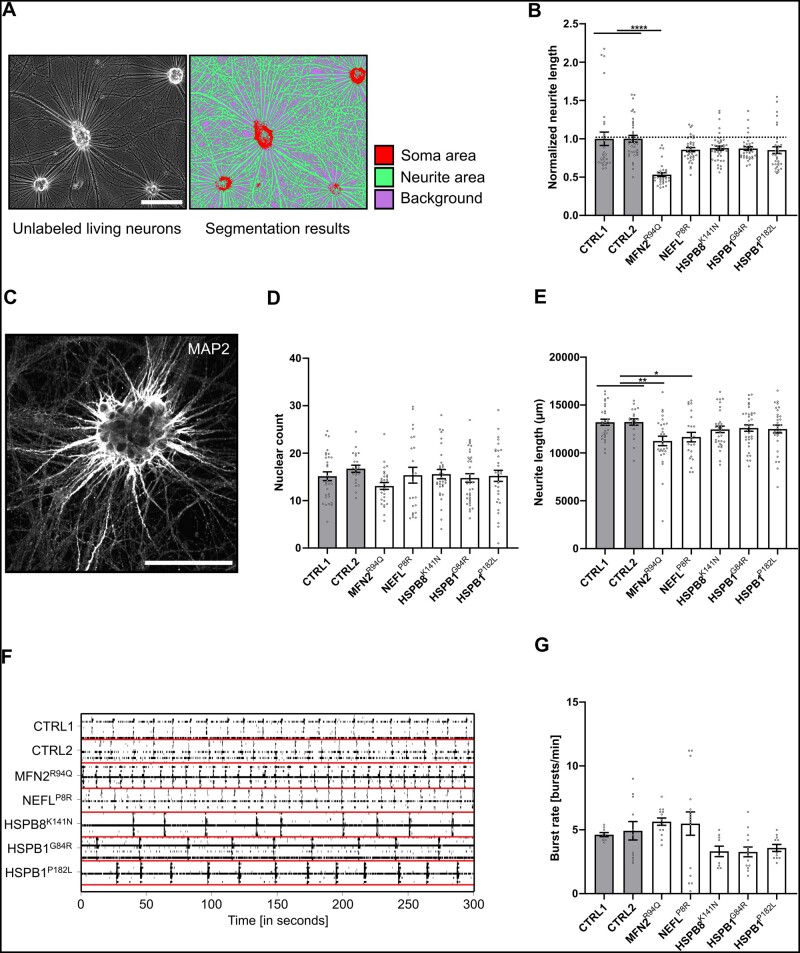
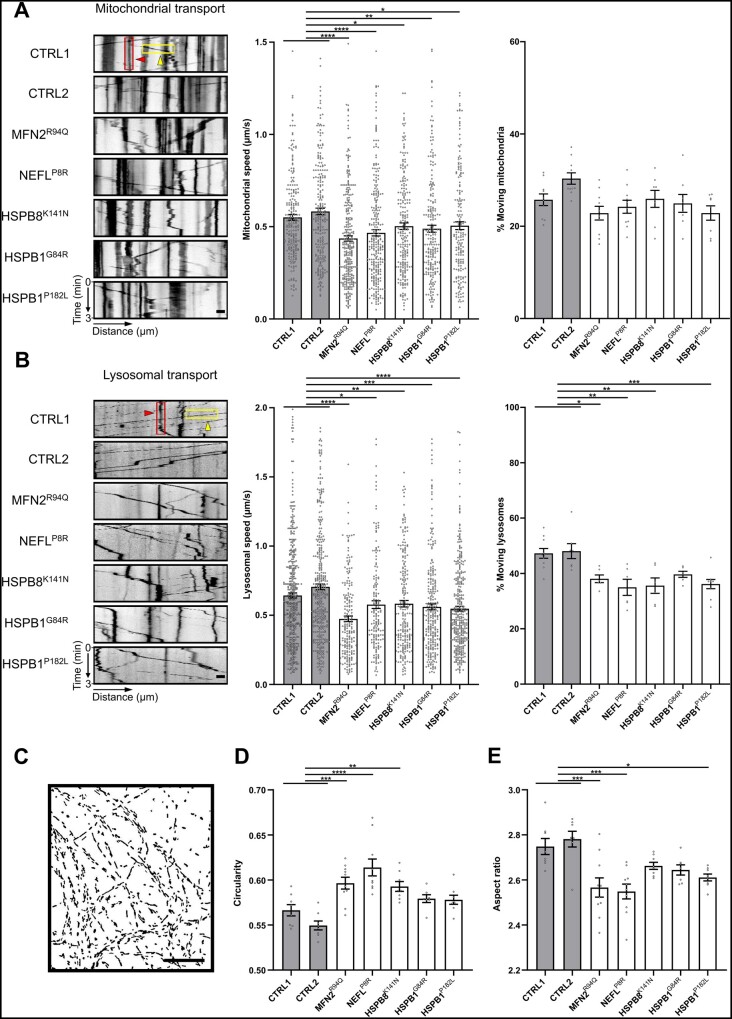
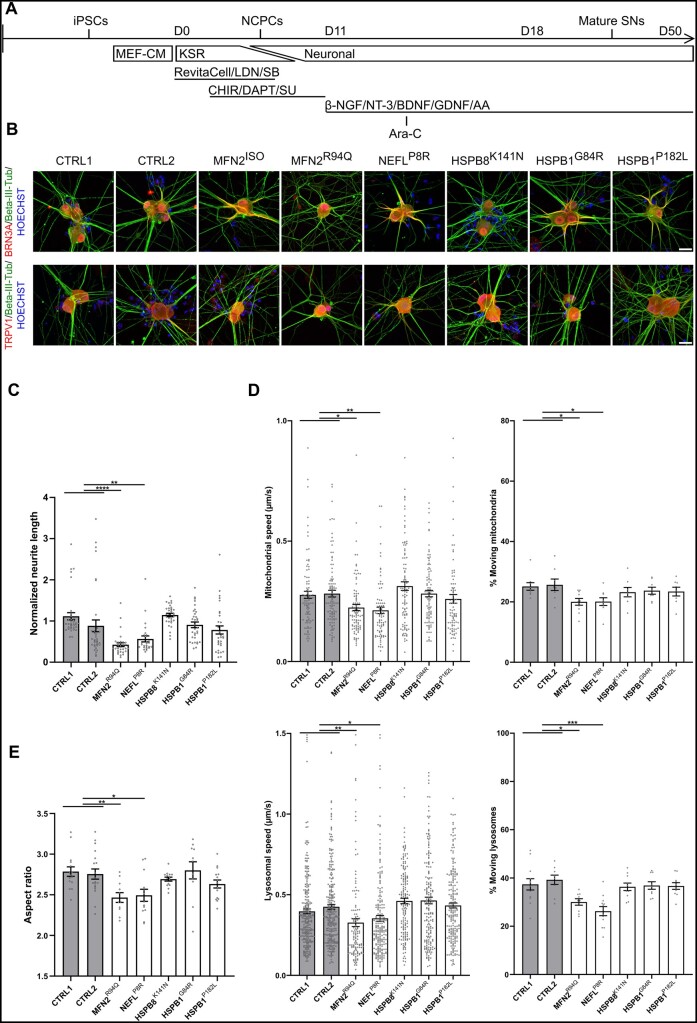
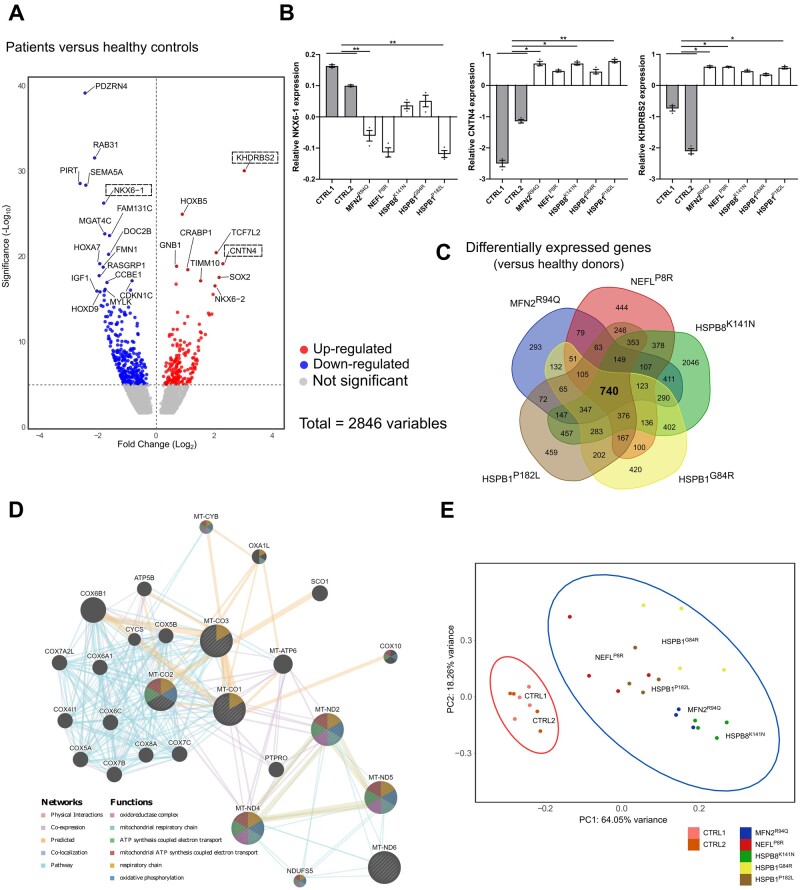
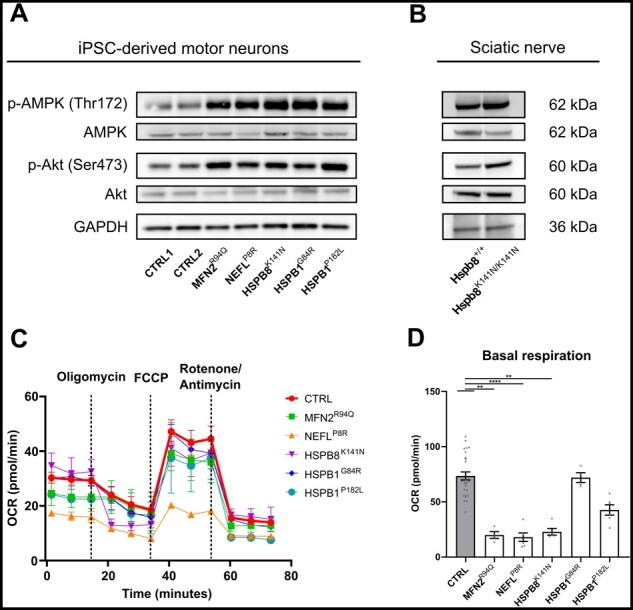
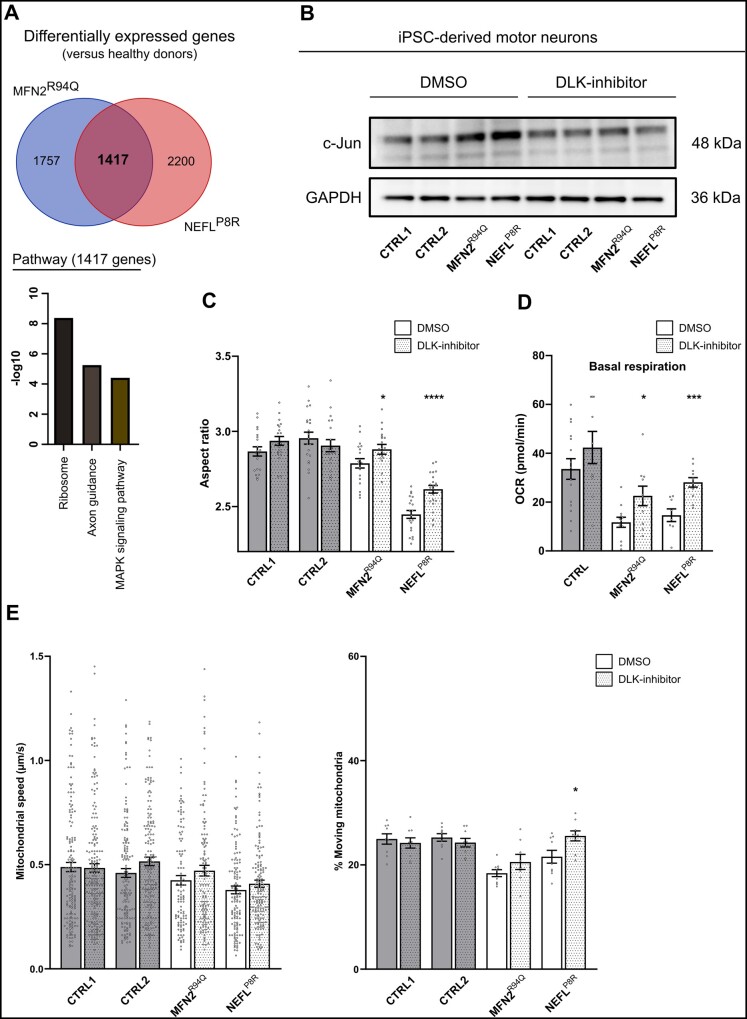
Axonal Charcot-Marie-Tooth neuropathies (CMT type 2) are caused by inherited mutations in various genes functioning in different pathways. The types of genes and multiplicity of mutations reflect the clinical and genetic heterogeneity in CMT2 disease, which complicates its diagnosis and has inhibited the development of therapies. Here, we used CMT2 patient-derived pluripotent stem cells (iPSCs) to identify common hallmarks of axonal degeneration shared by different CMT2 subtypes. We compared the cellular phenotypes of neurons differentiated from CMT2 patient iPSCs with those from healthy controls and a CRISPR/Cas9-corrected isogenic line. Our results demonstrated neurite network alterations along with extracellular electrophysiological abnormalities in the differentiated motor neurons. Progressive deficits in mitochondrial and lysosomal trafficking, as well as in mitochondrial morphology, were observed in all CMT2 patient lines. Differentiation of the same CMT2 iPSC lines into peripheral sensory neurons only gave rise to cellular phenotypes in subtypes with sensory involvement, supporting the notion that some gene mutations predominantly affect motor neurons. We revealed a common mitochondrial dysfunction in CMT2-derived motor neurons, supported by alterations in the expression pattern and oxidative phosphorylation, which could be recapitulated in the sciatic nerve tissue of a symptomatic mouse model. Inhibition of a dual leucine zipper kinase could partially ameliorate the mitochondrial disease phenotypes in CMT2 subtypes. Altogether, our data reveal shared cellular phenotypes across different CMT2 subtypes and suggests that targeting such common pathomechanisms could allow the development of a uniform treatment for CMT2.

Keywords: Charcot-Marie-Tooth neuropathy; dual leucine kinase inhibitor; iPSC-derived motor and sensory neurons; mitochondrial dysfunction; phenotyping.


Figures

Figure 1
Figure 1
Generation of CMT2 iPSCs and characterization of iPSC-derived motor neurons. (A) Graphic scheme of procedures for iPSC generation and the neuronal differentiation required to conduct this study. (B) Sequencing analysis confirming the mutations of the patient lines used in this study. (C) Protocol and small molecules used to obtain motor neurons. (D) Immunostaining at Day 25 with ChAT, Isl1, MAP2 and DAPI for patient-specific motor neurons. Scale bar = 100 µm. Ara-C = cytosine β-d-arabinofuranoside; BDNF = brain-derived neurotrophic factor; CHIR = CHIR99021; CNTF = ciliary neurotrophic factor; DAPT = a γ-secretase inhibitor; EB = embryoid body; GDNF = glial cell-derived neurotrophic factor; LDN = LDN-193189; MN = motor neuron; RA = retinoic acid; SAG = smoothened agonist; SB = SB431542.
Figure 2
Figure 2
Neurite network analysis of patient-specific motor neurons. (A) Example of neurite and cell body segmentation of phase contrast images using Weka-based pixel classification. (B) Quantification of normalized neurite length at Days 38–50 performed using phase-contrast images. Each dot represents a normalized microscopic field (n =29–42; data pooled from two independent differentiations; mean ± SEM). (C) Example of a high-content image using MAP2 staining. (D and E) High-content imaging analysis at Days 25–30. Quantification of nuclear count and neurite length, respectively. Each dot represents the average value per well (n =21–36; data pooled from five independent differentiations; mean ± SEM). (F) Representative raster plot of bursts recorded over 300 s. Each bar indicates a spike and each line an electrode. (G) Quantification of the burst rate (Days 31–32). Individual data-points represent the average value of one well (n =9–16; data pooled from two independent differentiations; mean ± SEM). (BH) Statistical significance was calculated using Kruskal-Wallis test with Dunn’s multiple comparison (*P <0.05, **P <0.01, ***P <0.001, **** P <0.0001). Scale bar = 100 µm.
Figure 3
Figure 3
CMT2-derived motor neurons cause axonal transport deficits and altered mitochondrial morphology. (A) Mitochondrial transport analysis at Days 38–50 using kymographs (left). Quantification of mitochondrial speed (n =182–295) and percentage of moving mitochondria (n =8–11) was performed after MitoTrackerTM labelling and imaging for 3 min. (B) Lysosomal transport analysis at Days 38–50 using kymographs (left). Quantification of lysosomal speed (n =161–433) and percentage of moving lysosomes (n =6–10) was performed after LysoTrackerTM labelling and imaging for 3 min. (A and B) Examples of representative kymographs showing moving (yellow boxes and arrowheads) and stationary (red boxes and arrowheads) organelles. Dots represent either individual organelles (speed) or the average value of the kymographs per recording (% moving) (data pooled from two independent differentiations; mean ± SEM). (C) Representative fluorescence mask (MitoTrackerTM) used to study the mitochondrial shape. (D and E) Quantification of mitochondrial circularity and aspect ratio. Data-points represent the average values for the mitochondria present in the image (n =8–10; data pooled from two independent differentiations; mean ± SEM). Statistical significance to evaluate speed was calculated using one-way ANOVA followed by Dunnett’s multiple comparisons test, while Kruskal-Wallis test with Dunn’s multiple comparison was used to perform statistics on the percentage of moving organelles and mitochondrial morphology (*P <0.05, **P <0.01, ***P <0.001, ****P <0.0001). Scale bar = 20 µm.
Figure 4
Figure 4
Motor neuron-specific subtypes of CMT2 do not change axonal transport and mitochondrial morphology in iPSC-derived sensory neurons. (A) Protocol and small molecules used to obtain peripheral sensory neurons. (B) Immunostaining at Day 37 with Beta-III-Tub, BRN3A, TRPV1 and Hoechst 33342 for iPSC-derived sensory neurons. (C) Quantification of normalized neurite length at Days 38–50, performed using phase-contrast images. Each dot represents a normalized microscopic field (n =26–36; data pooled from two independent differentiations; mean ± SEM). (D) Top: Mitochondrial transport analysis at Days 38–50 using kymographs. Quantification of mitochondrial speed (left) (n =84–101) and percentage of moving mitochondria (right) (n =8–10) was performed using MitoTrackerTM labelling. Bottom: Lysosomal transport analysis at Days 38–50 using kymographs. Quantification of lysosomal speed (left) (n =129–258) and percentage of moving lysosomes (right) (n =9–12) was performed using LysoTrackerTM labelling. Dots represent either individual mitochondria (speed) or the average value of the kymographs per recording (% moving) (data pooled from two independent differentiations; mean ± SEM). (E) Quantification of mitochondrial aspect ratio. Data-points represent the average values for the mitochondria present in the image (n =11–19; data pooled from two independent differentiations; mean ± SEM). Statistical significance to evaluate speed was calculated using one-way ANOVA followed by Dunnett’s multiple comparisons test, while Kruskal-Wallis test with Dunn’s multiple comparison was used to perform statistics on the neurite network analysis, percentage of moving organelles and mitochondrial morphology (*P <0.05, **P <0.01, ***P <0.001, ****P <0.0001). Scale bar = 100 µm. AA = ascorbic acid; Ara-C = cytosine β-d-arabinofuranoside; β-NGF = β-nerve growth factor; BDNF = brain-derived neurotrophic factor; CHIR = CHIR99021; DAPT = a γ-secretase inhibitor; GDNF = glial cell-derived neurotrophic factor; KSR = knockout serum replacement medium; LDN = LDN-193189; MEF-CM = mouse embryonic fibroblast-conditioned medium; NCPC = neural crest stem cell; Neuronal = neuronal medium; NT-3 = neurotrophin-3; SB = SB431542; SU = SU5402; SN = sensory neuron.
Figure 5
Figure 5
Transcriptional profile of CMT2 iPSC-derived motor neurons at Day 50. (A) Volcano plot of log2 fold change versus mean comparing the control lines with the patients. Boxes are used to indicate genes that were validated using RT-qPCR. (B) RT-qPCR to confirm the relative expression of differentially expressed genes (DEGs) in iPSC-derived neurons at Day 50 (n =3; data pooled from two independent differentiations; mean ± SEM). (C) Venn-diagram of the DEGs of CMT2 models compared with healthy donors. (D) Network analysis of the DEGs responsible for the top terms shown in Cellular Component terms. (E) PCA of all mitochondrial coded genes in healthy control and patient samples. Statistical significance of RT-qPCR results was calculated using one-way ANOVA followed by Dunnett’s multiple comparisons test (*P <0.05, **P <0.01, ***P <0.001, ****P <0.0001).
Figure 6
Figure 6
Mitochondrial function is impaired in CMT2 iPSC-derived motor neurons. (A) Expression levels of p-AMPK and p-Akt at Day 45 in iPSC-derived motor neurons determined using western blot. (B) Expression levels of p-AMPK and p-Akt in the sciatic nerve of 12-month-old Hspb8K141N/K141N mice. (C) Oxygen consumption rate (OCR) in iPSC-derived motor neurons at Days 24–25 using a Mito Stress Test [n =4–25; data pooled from two independent differentiations; mean ± standard deviation (SD)]. (D) Quantification of basal respiration at Days 38–39. Individual data-points represent the average value per well (n =4–27; data pooled from two independent differentiations; mean ± SEM). Statistical significance was calculated using one-way ANOVA followed by Dunnett’s multiple comparisons test (*P <0.05, **P <0.01, ***P <0.001, ****P <0.0001).
Figure 7
Figure 7
DLK inhibition restores mitochondrial dysfunction in motor neurons from CMT2A and CMT2E patients. (A) Venn diagram of the common DEGs of the MFN2R94Q and NEFLP8R mutations compared with healthy donors. Enriched pathways of the common overlapping differentially expressed genes (DEGs) are shown (bottom). (B) Total c-Jun levels at Day 40 in untreated (DMSO) and treated (DLK-inhibitor) iPSC-derived motor neurons determined using western blot. (C) Quantification of mitochondrial aspect ratio. Data-points represent the average values for the mitochondria present in the image (n =19–21; data pooled from two independent differentiations; mean ± SEM). (D) Quantification of basal respiration at Days 38–39. Individual data-points represent the average value per well (n =8–15; data pooled from two independent differentiations; mean ± SEM). (E) Quantification of mitochondrial speed (n =107–187) and percentage of moving (n =8–9) mitochondria was performed after MitoTrackerTM labelling and imaging for 3 min. Dots represent either individual mitochondria (speed) or the average value of the kymographs per recording (% moving) (data pooled from two independent differentiations; mean ± SEM). (CE) Statistical significance of the rescue of mitochondrial morphology, basal respiration and percentage of moving mitochondria was calculated using the Mann-Whitney U-test, while the effect of the treatment on mitochondrial speed was evaluated using the unpaired t-test (*P <0.05, **P <0.01, ***P <0.001, ****P <0.0001).

Comment in

References

    1. Baets J, De Jonghe P, Timmerman V.. Recent advances in Charcot-Marie-Tooth disease. Curr Opin Neurol. 2014;27(5):532–540. - PubMed
    1. Pisciotta C, Shy ME.. Neuropathy. Handbook Clin Neurol. 2018;148:653–665. - PubMed
    1. Pareyson D.Axonal Charcot-Marie-Tooth disease: The fog is only slowly lifting. Neurology. 2007;68(20):1649–1650. - PubMed
    1. Pipis M, Rossor AM, Laura M, Reilly MM.. Next-generation sequencing in Charcot–Marie–Tooth disease: Opportunities and challenges. Nat Rev Neurol. 2019;15(11):644–656. - PubMed
    1. Takahashi K, Yamanaka S.. Induction of pluripotent stem cells from mouse embryonic and adult fibroblast cultures by defined factors. Cell. 2006;126(4):663–676. - PubMed

Publication types