Review
. 2021 Jul 14;121(13):7957-8094.
doi: 10.1021/acs.chemrev.1c00138. Epub 2021 Jun 15.

Metallo-β-lactamases in the Age of Multidrug Resistance: From Structure and Mechanism to Evolution, Dissemination, and Inhibitor Design

Affiliations
Review

Metallo-β-lactamases in the Age of Multidrug Resistance: From Structure and Mechanism to Evolution, Dissemination, and Inhibitor Design

Guillermo Bahr et al. Chem Rev. .

Abstract

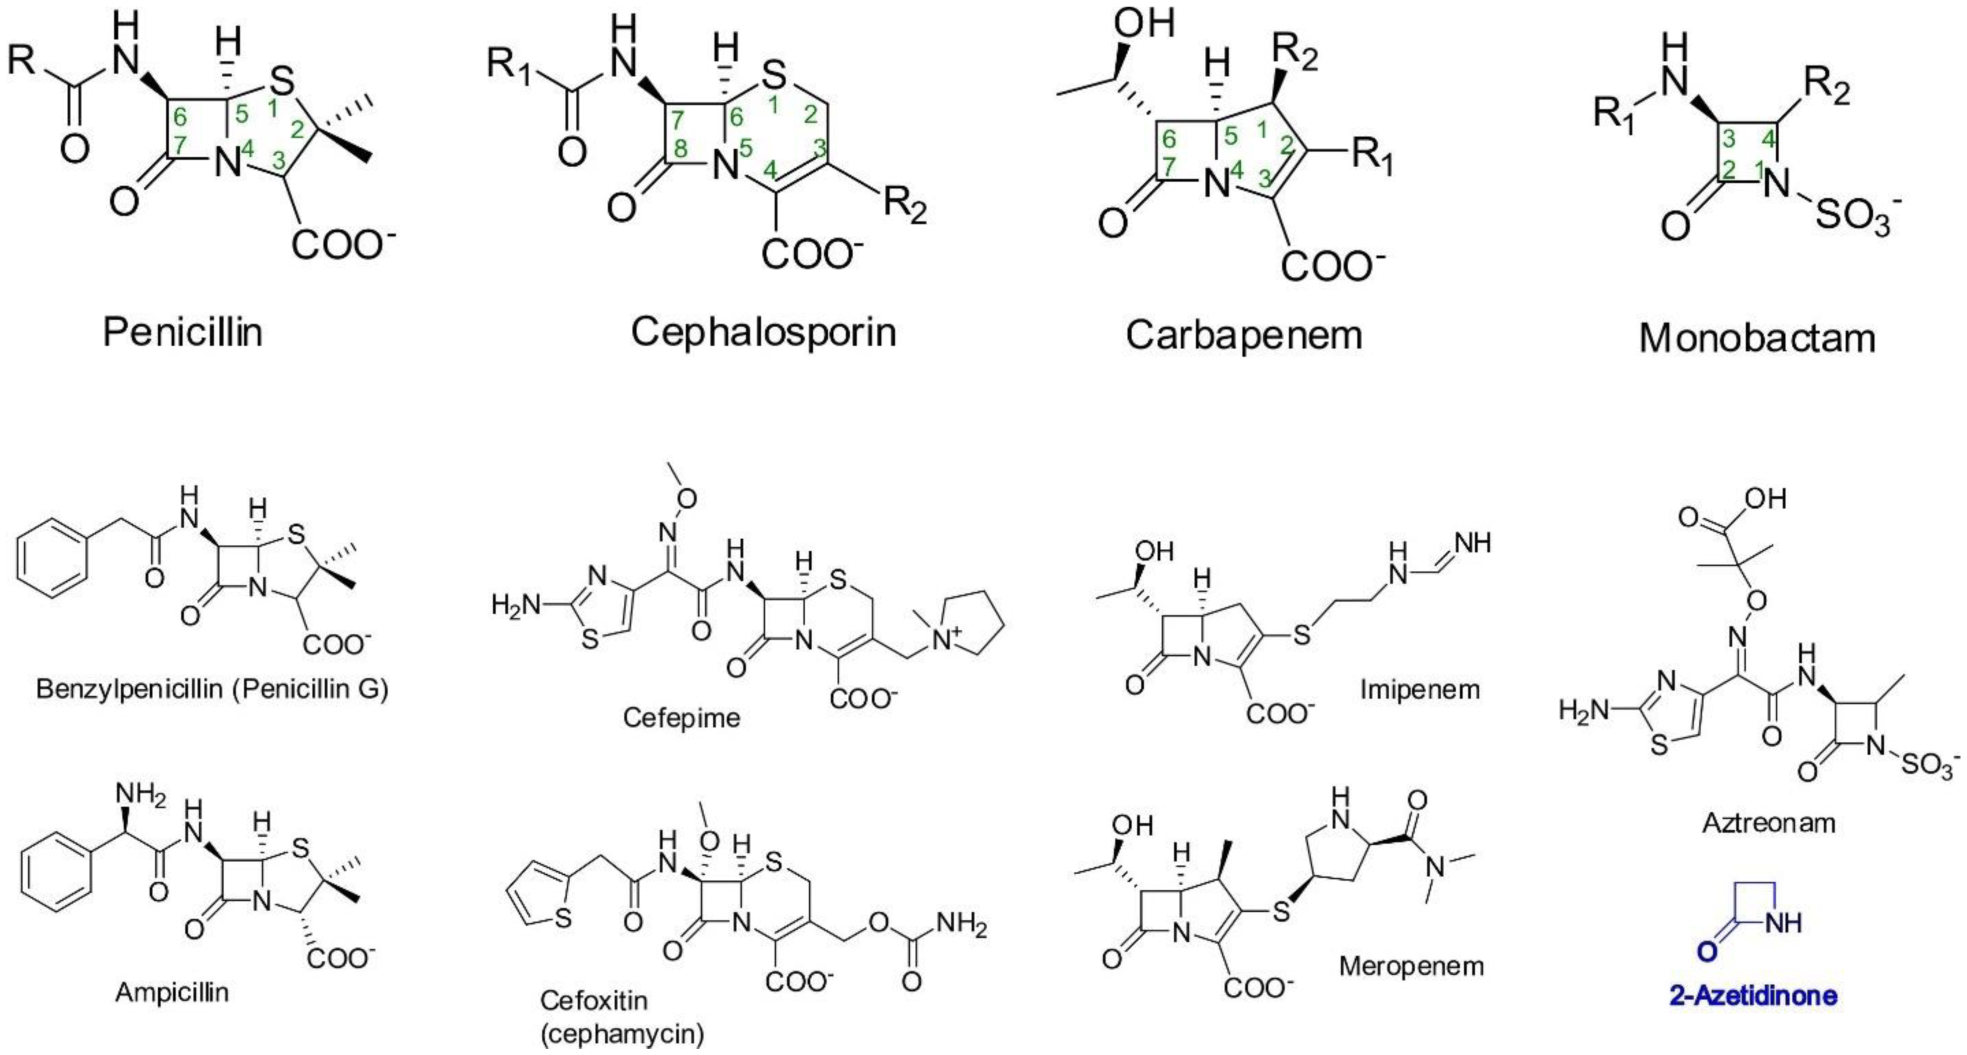
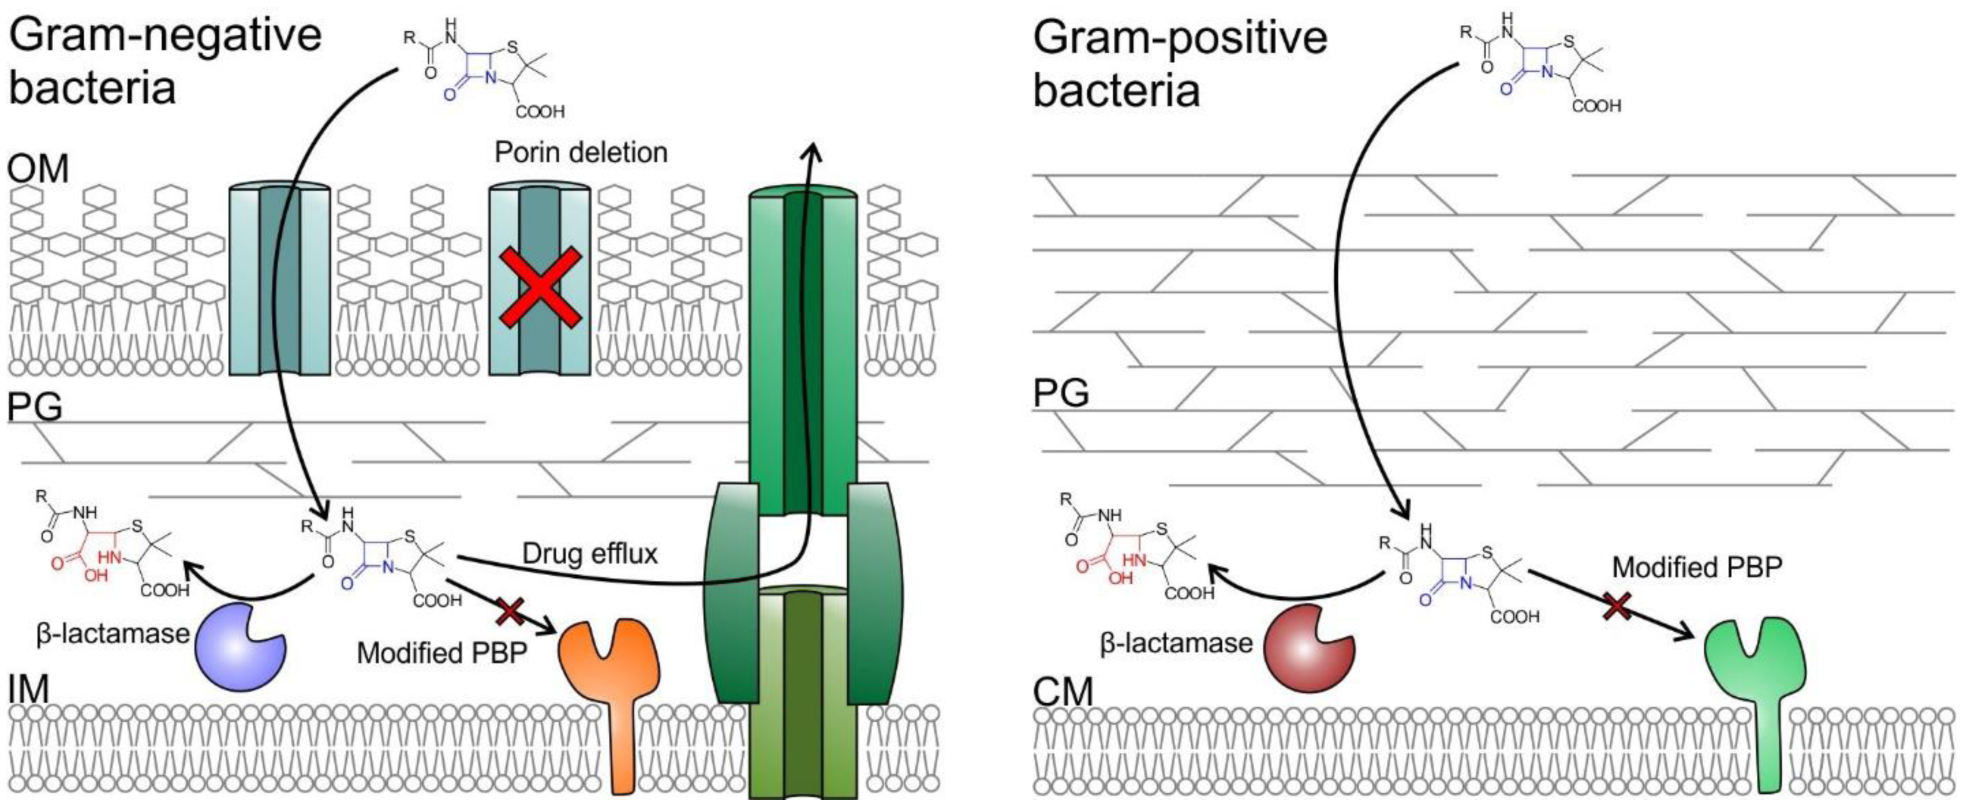
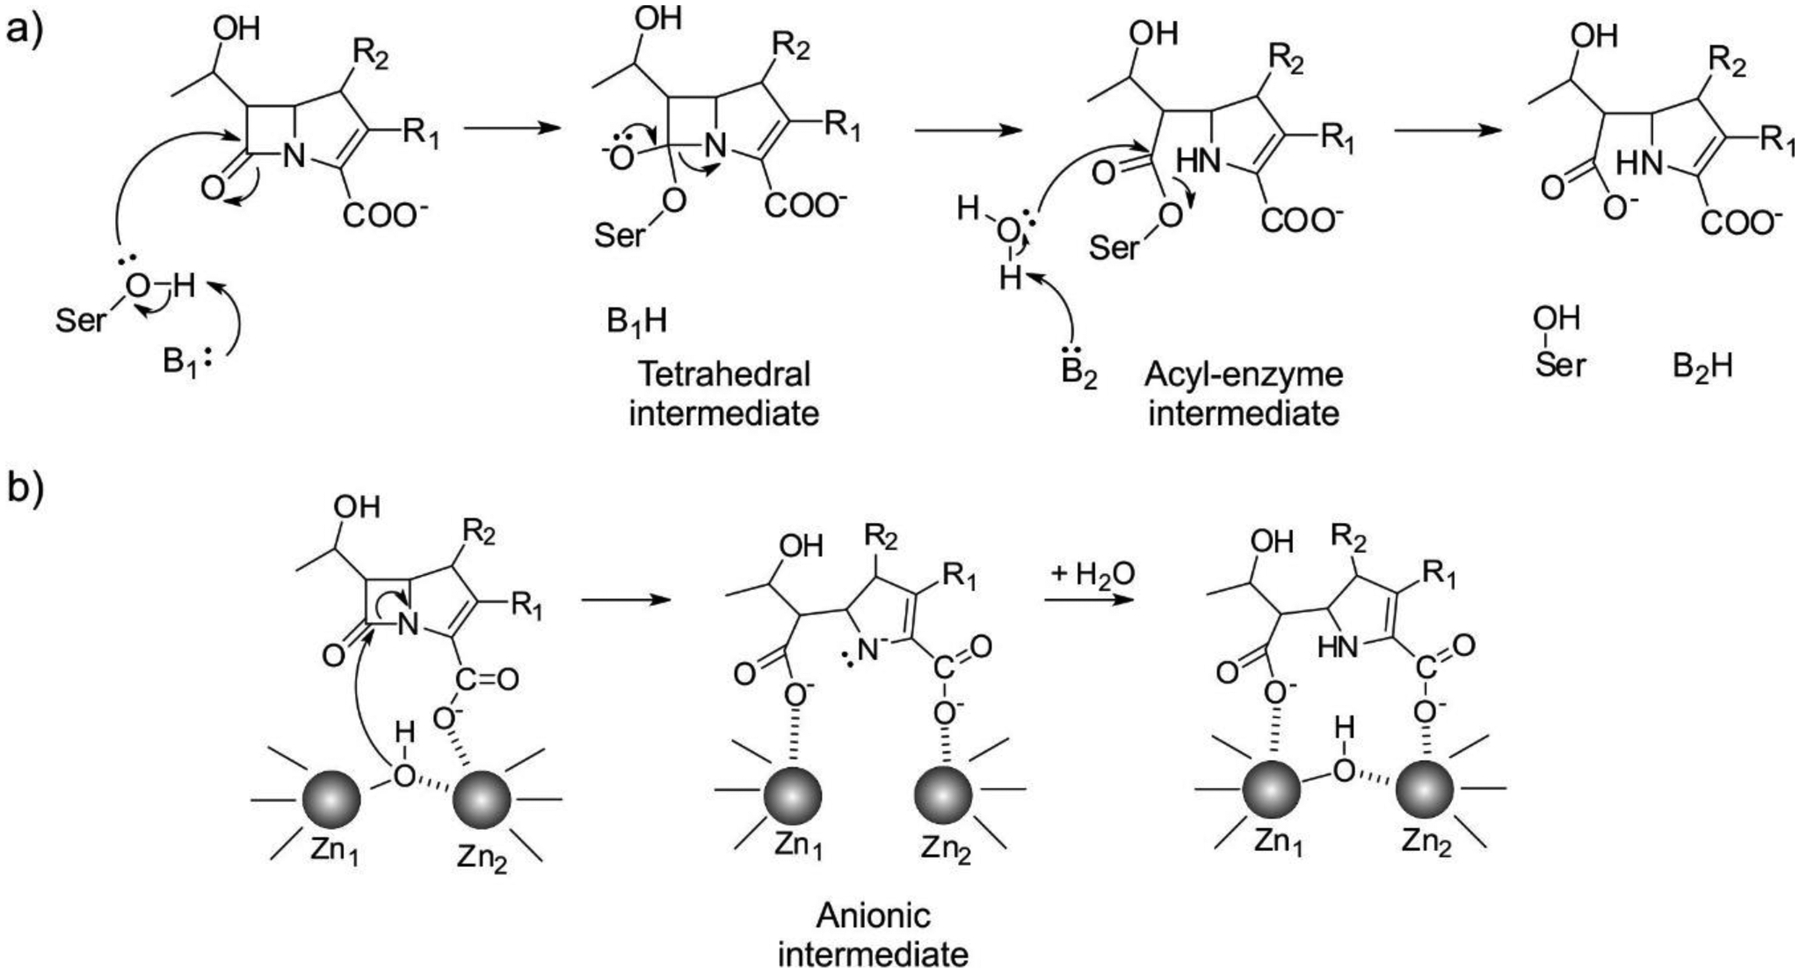
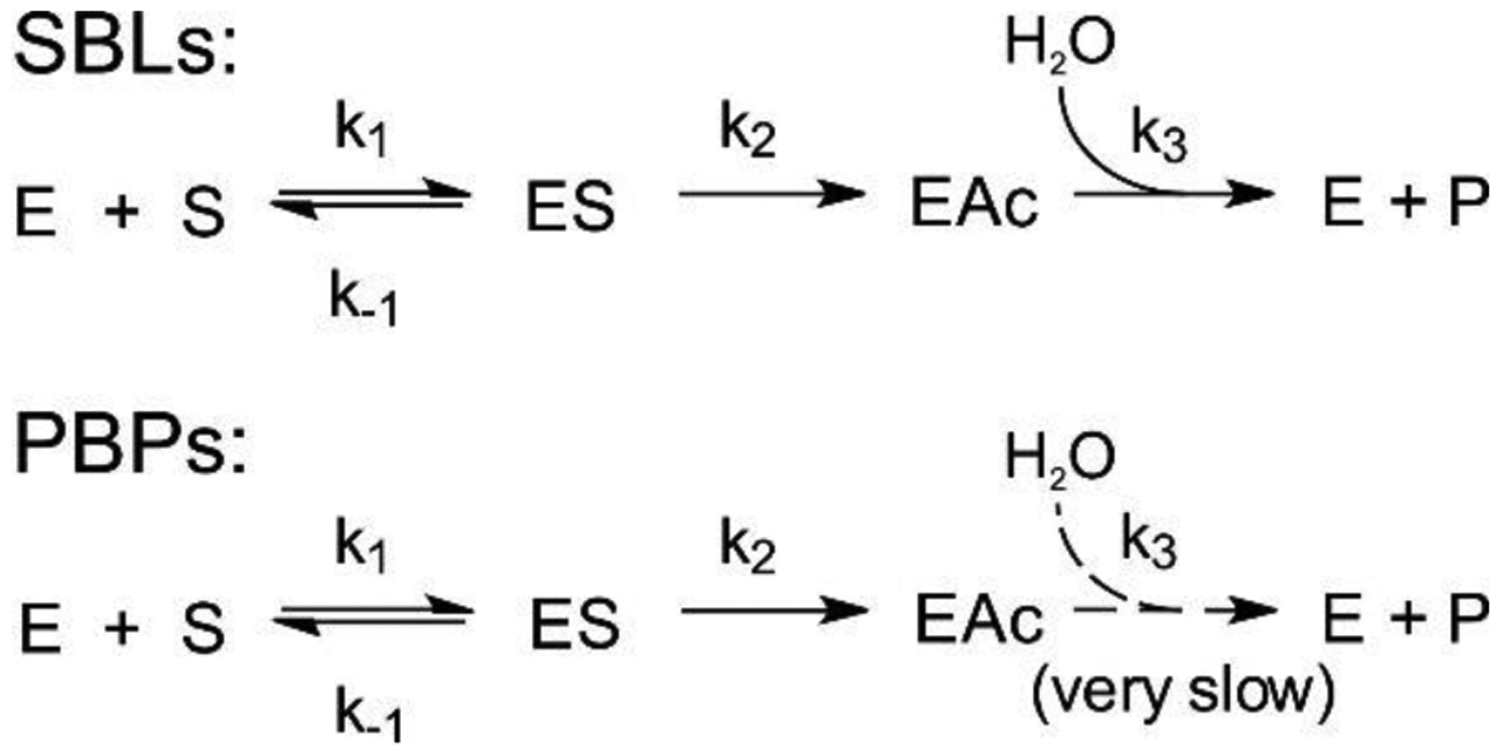
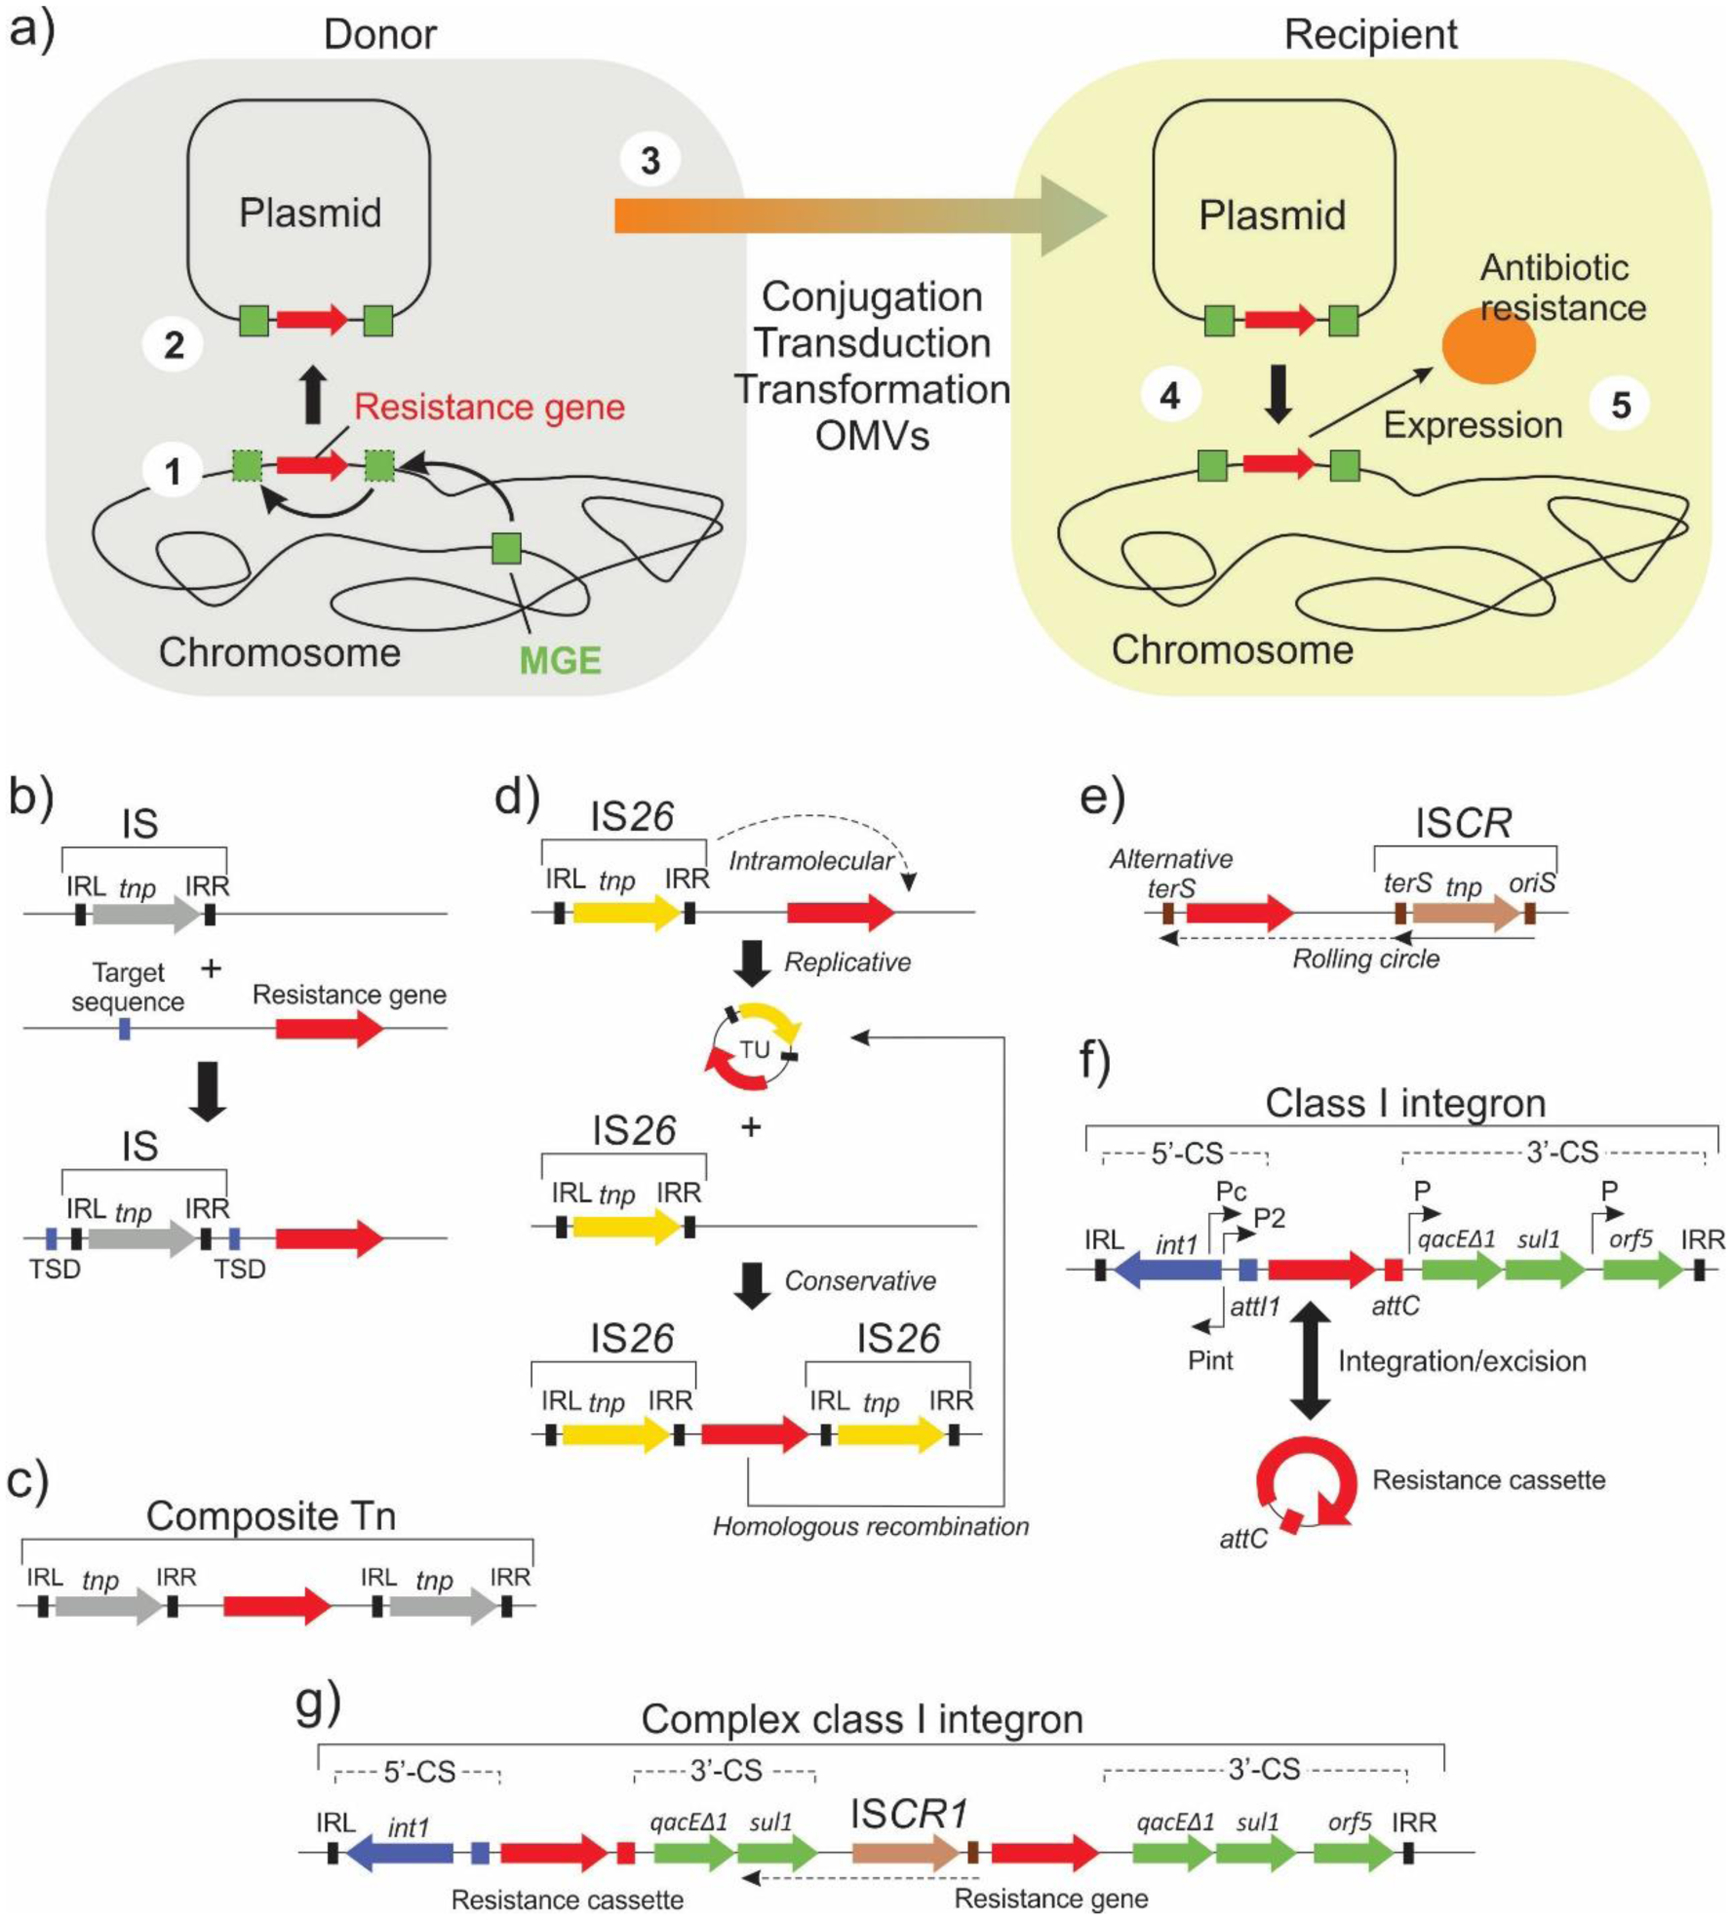
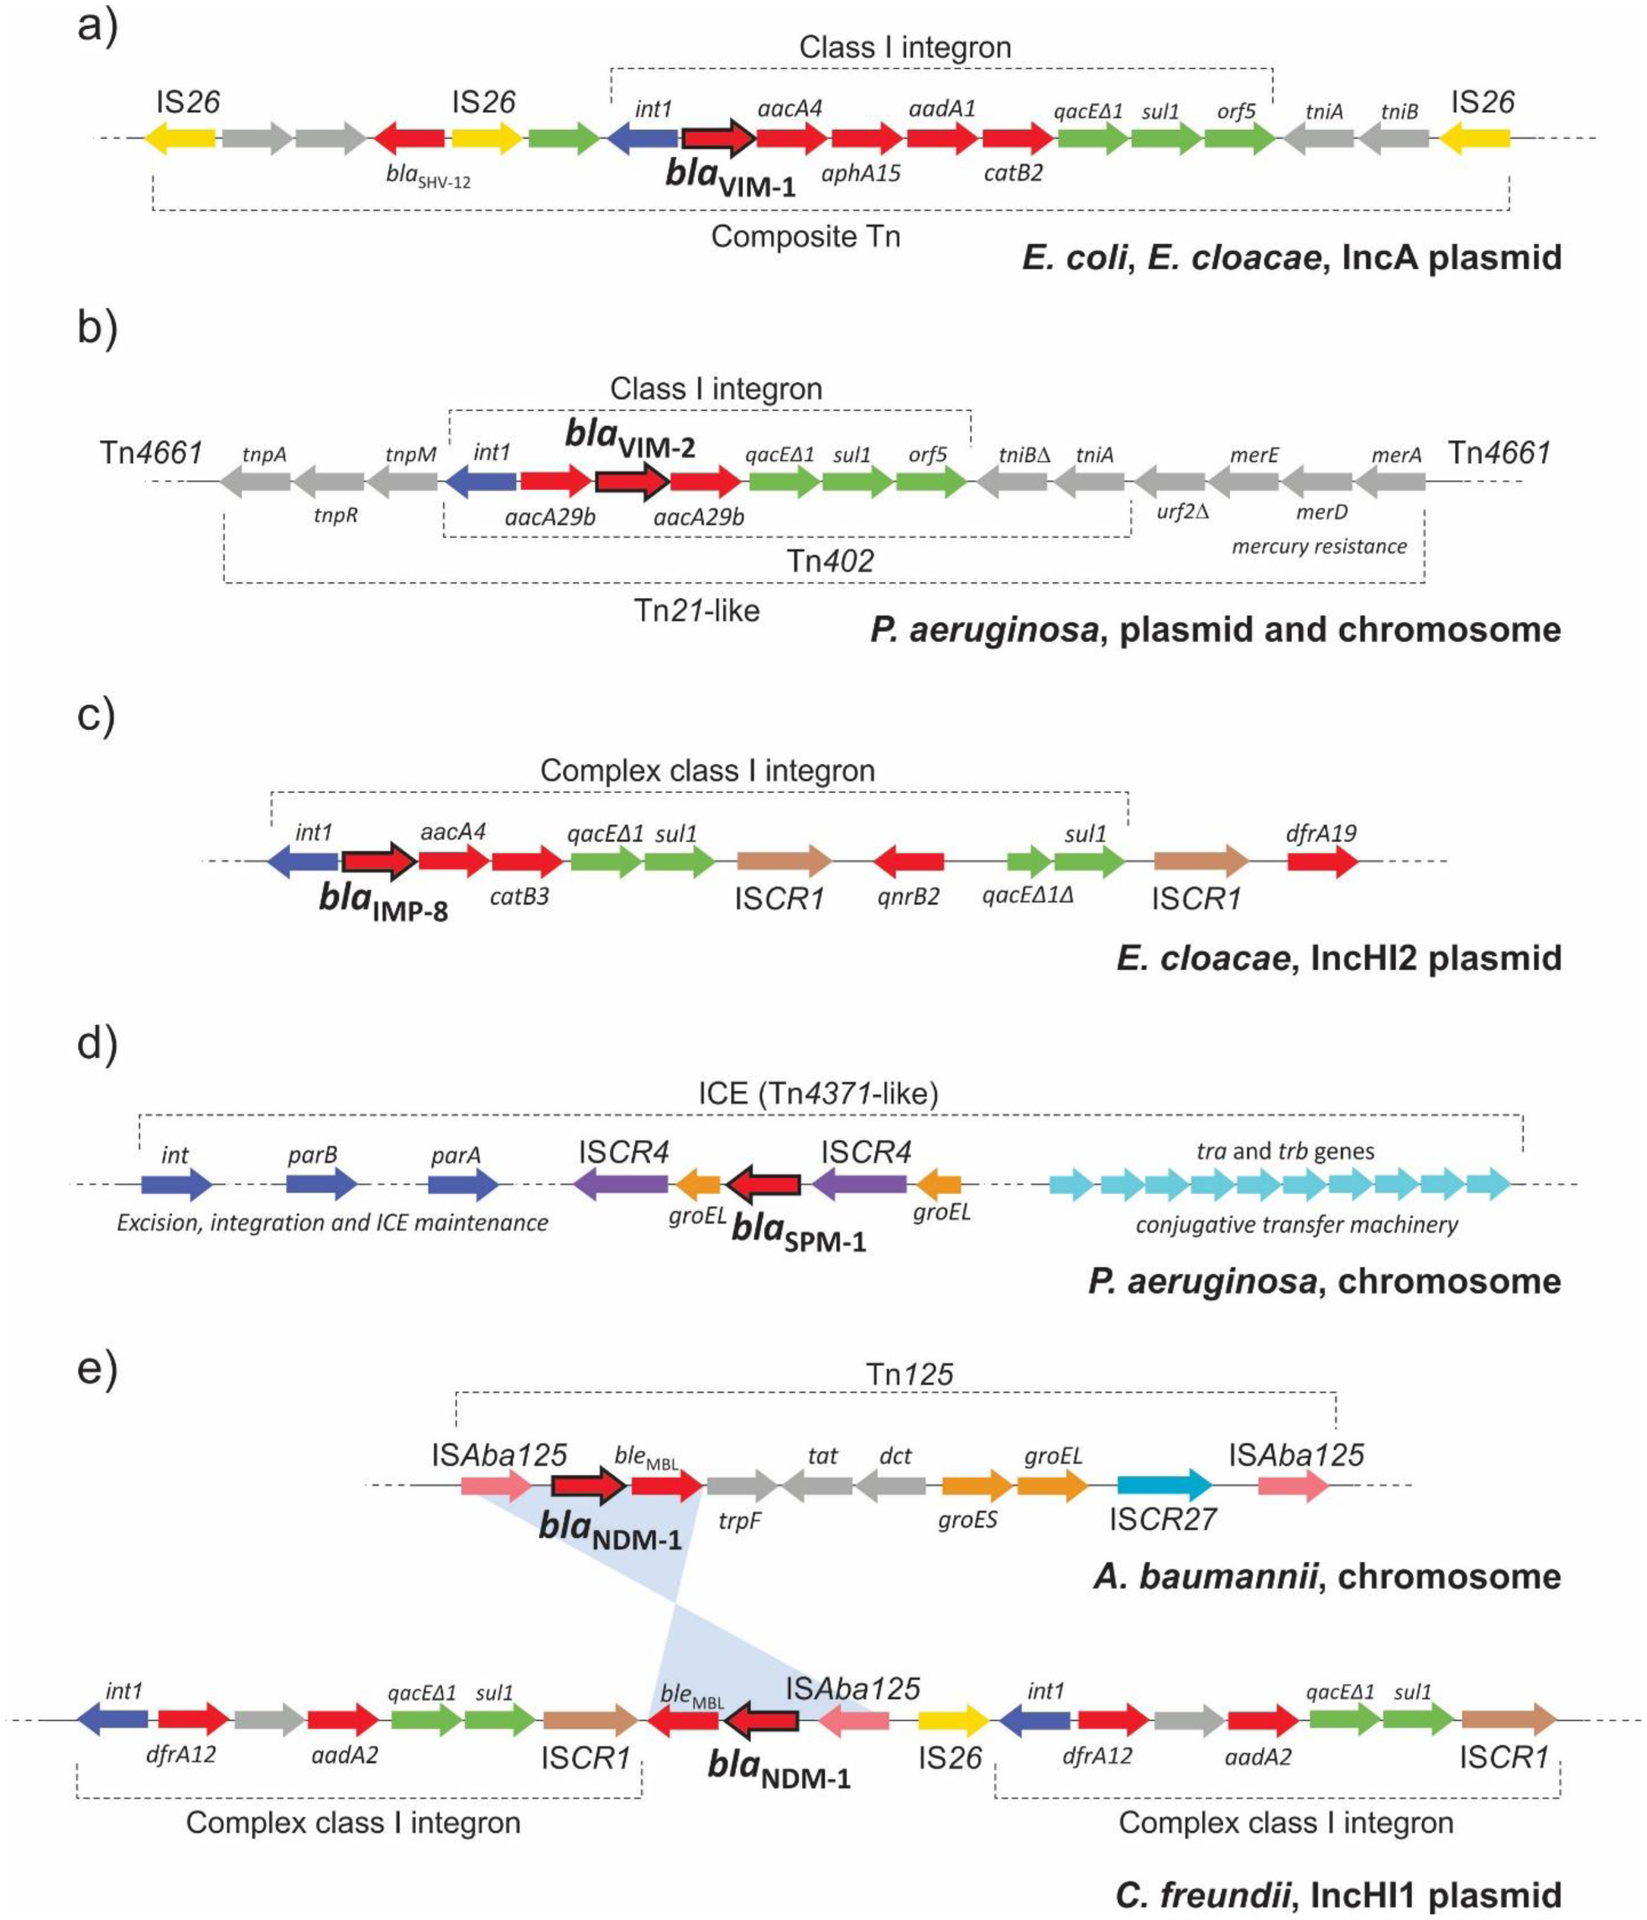
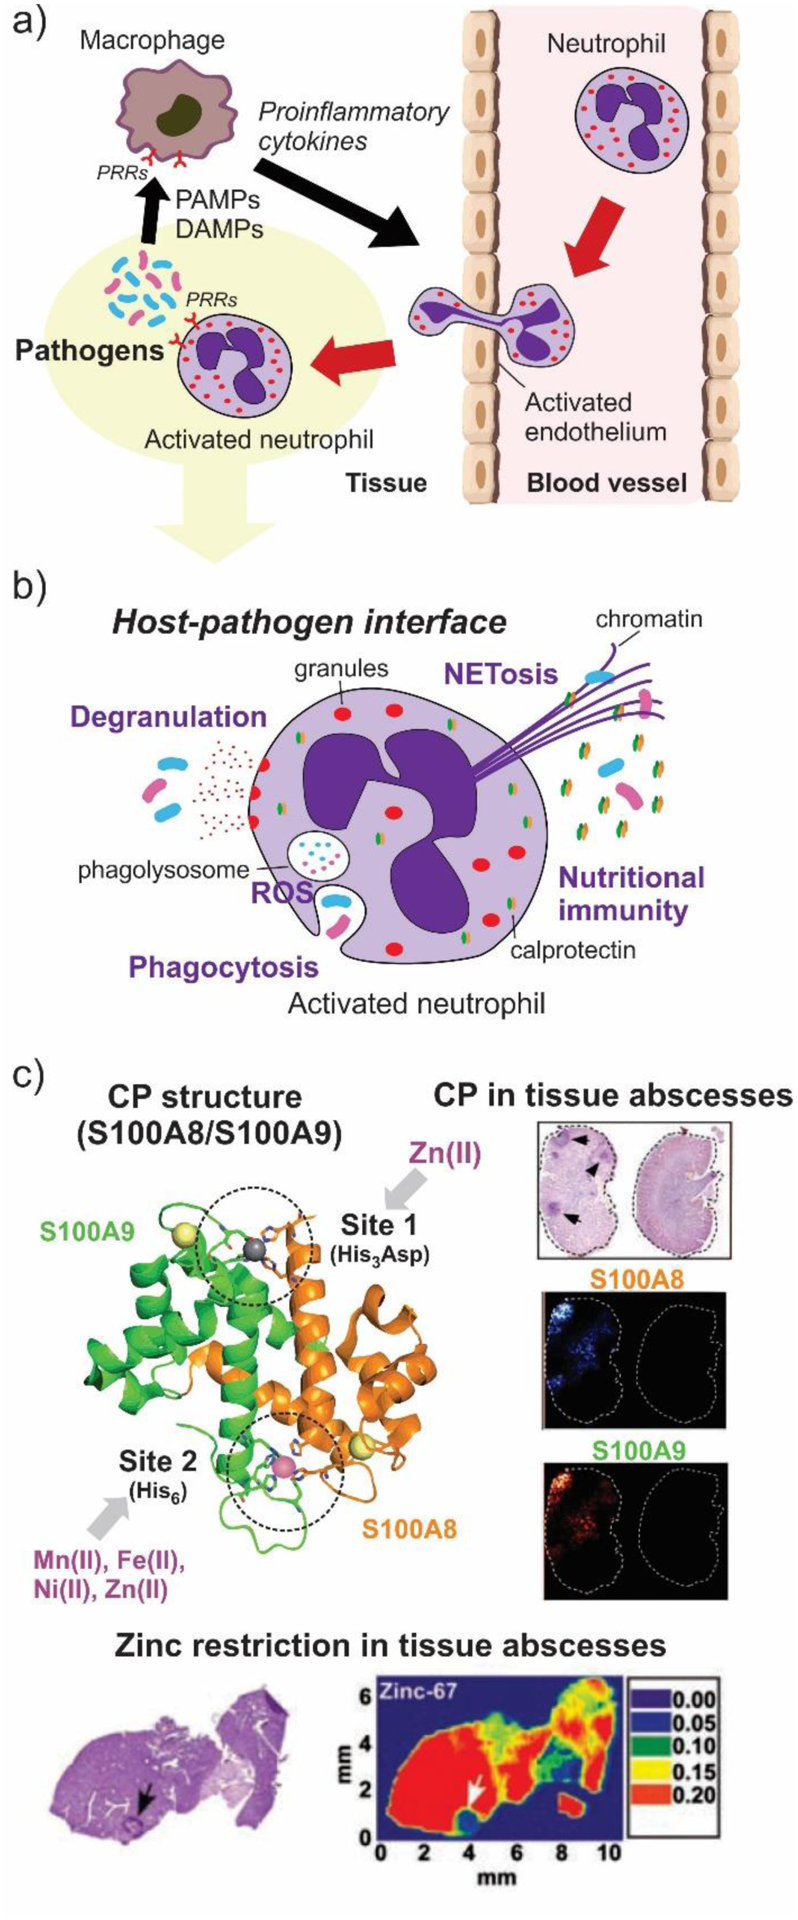
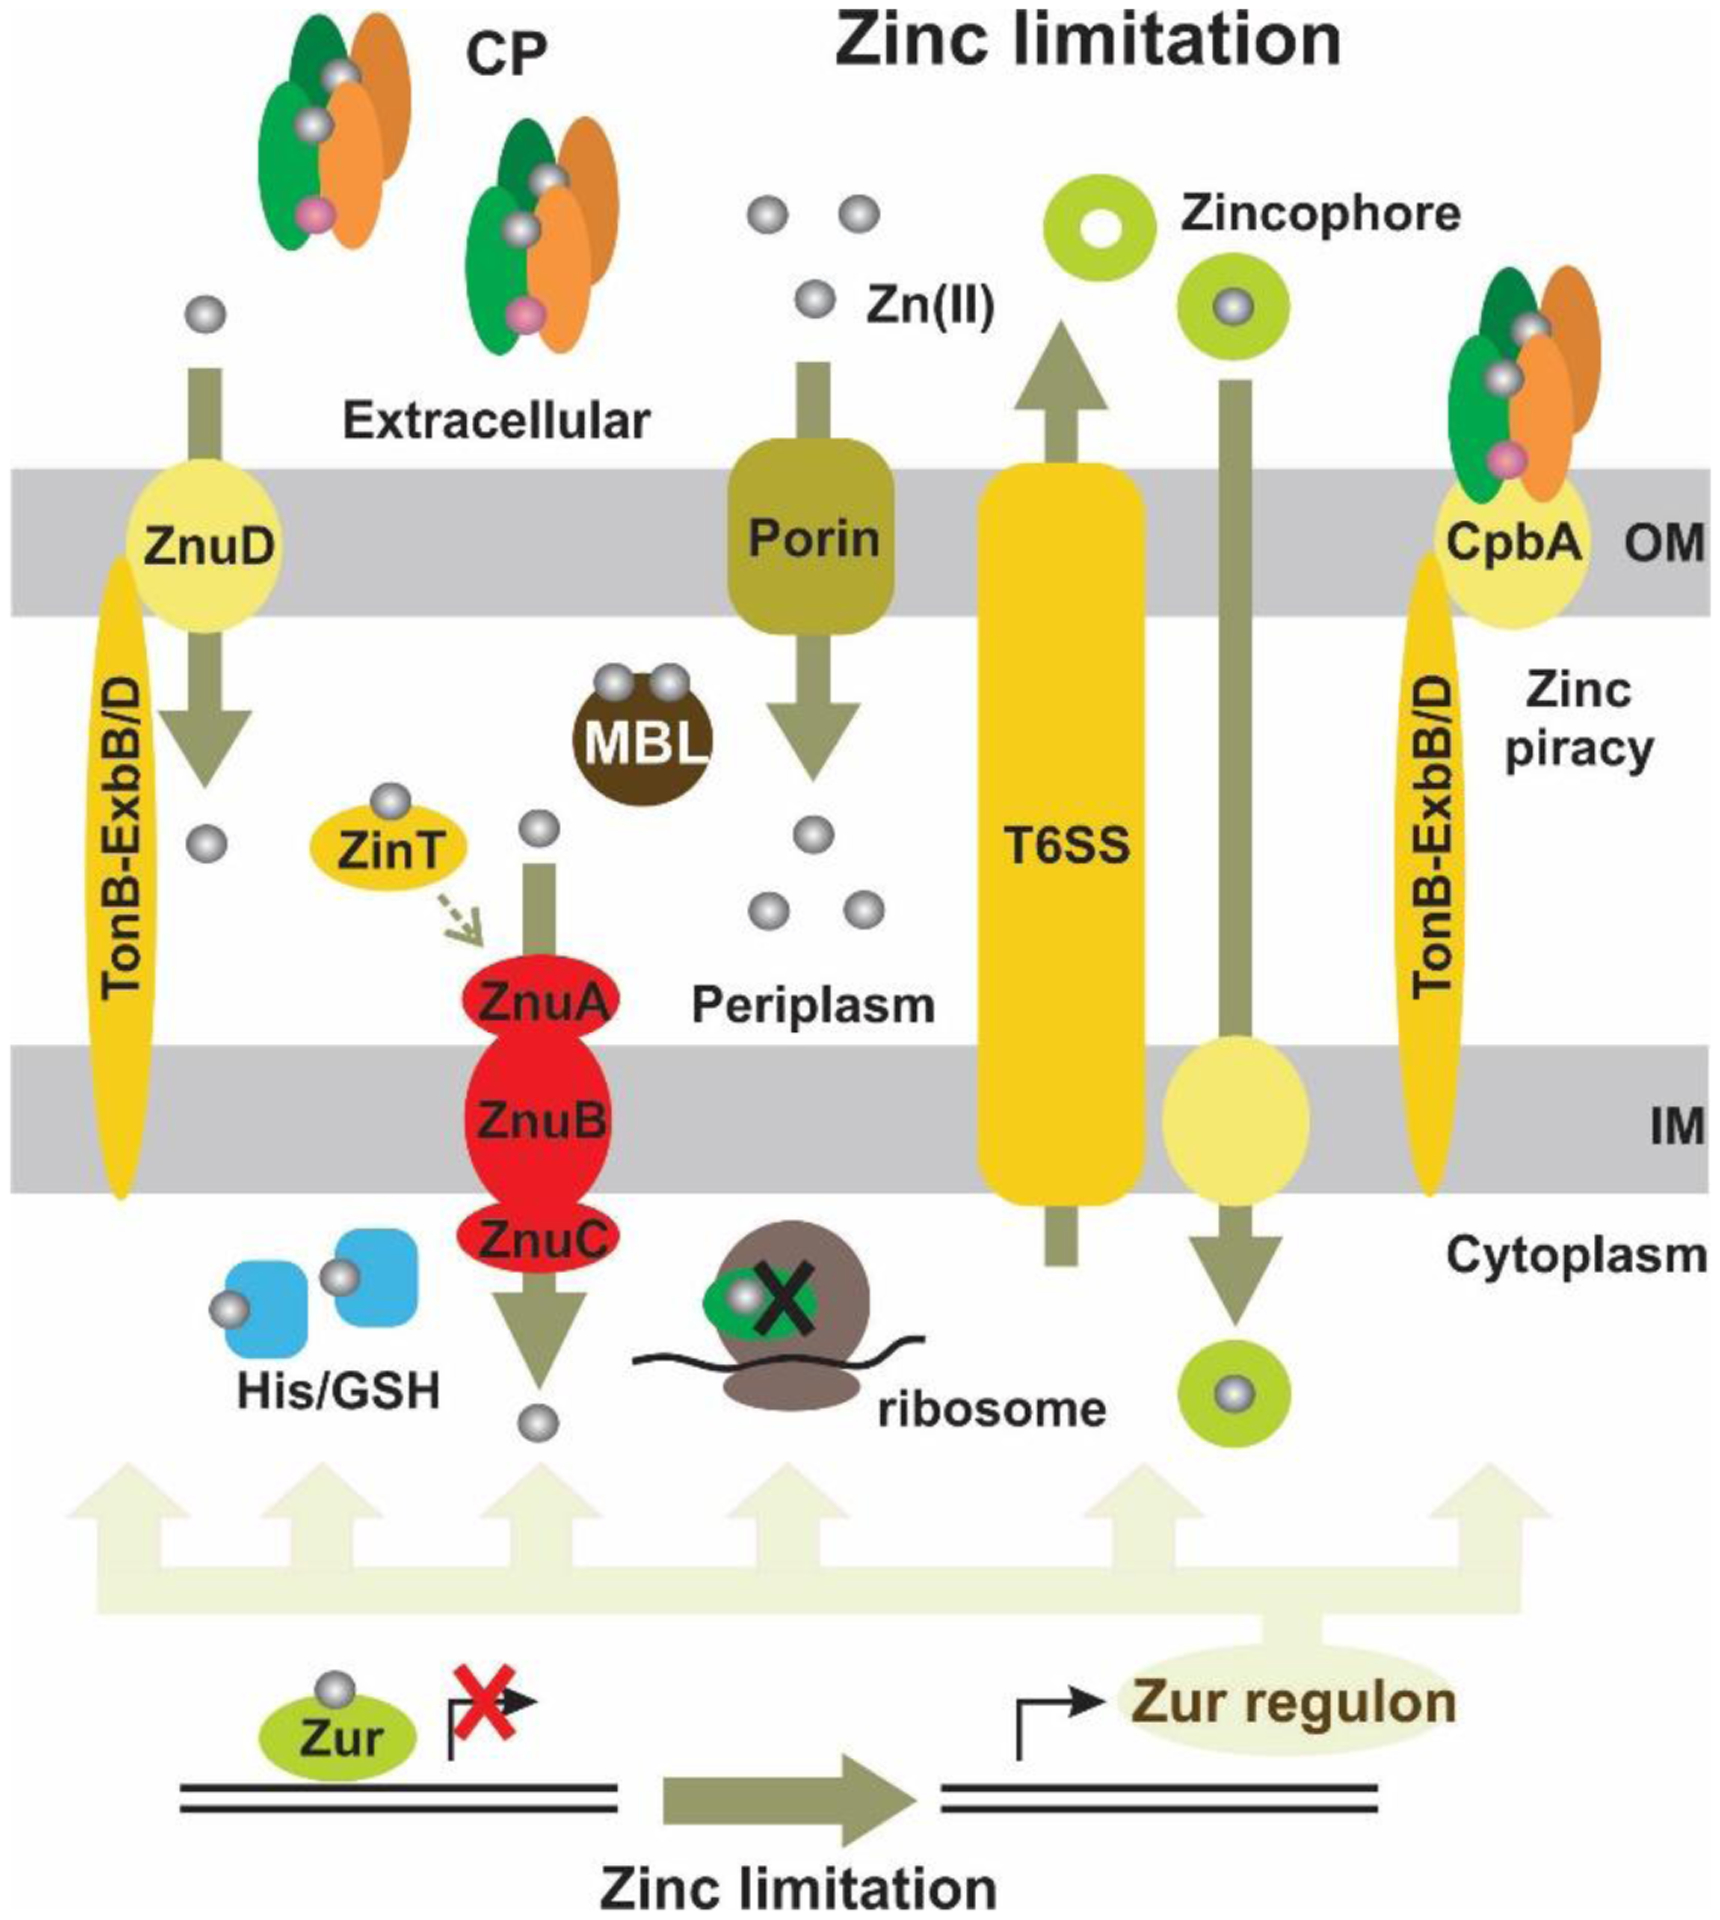
Antimicrobial resistance is one of the major problems in current practical medicine. The spread of genes coding for resistance determinants among bacteria challenges the use of approved antibiotics, narrowing the options for treatment. Resistance to carbapenems, last resort antibiotics, is a major concern. Metallo-β-lactamases (MBLs) hydrolyze carbapenems, penicillins, and cephalosporins, becoming central to this problem. These enzymes diverge with respect to serine-β-lactamases by exhibiting a different fold, active site, and catalytic features. Elucidating their catalytic mechanism has been a big challenge in the field that has limited the development of useful inhibitors. This review covers exhaustively the details of the active-site chemistries, the diversity of MBL alleles, the catalytic mechanism against different substrates, and how this information has helped developing inhibitors. We also discuss here different aspects critical to understand the success of MBLs in conferring resistance: the molecular determinants of their dissemination, their cell physiology, from the biogenesis to the processing involved in the transit to the periplasm, and the uptake of the Zn(II) ions upon metal starvation conditions, such as those encountered during an infection. In this regard, the chemical, biochemical and microbiological aspects provide an integrative view of the current knowledge of MBLs.


Figures

Figure 1.
Figure 1.
(Top) Structures of the four main classes of β-lactam antibiotics. (Bottom) Representative structures of antibiotics from each subclass, and of 2-azetidinone (shown in blue), the simplest compound containing a β-lactam ring.
Figure 2.
Figure 2.
Representation of the main mechanisms of β-lactam resistance in Gram-negative (left) and Gram-positive (right) bacteria. OM (outer membrane), PG (peptidoglycan), IM (inner membrane), CM (cytoplasmic membrane). The β-amino acid moiety resulting from β-lactam cleavage is shown in red.
Figure 3.
Figure 3.
Minimalistic outlines of β-lactam hydrolysis mechanisms by SBLs (a) and MBLs (b). B1 is a general base activating the nucleophilic Ser residue in SBLs, and B2 is a general base involved in the deacylation step of SBL-mediated hydrolysis. The specific residues involved in the mechanism are discussed in the text.
Figure 4.
Figure 4.
Reaction scheme of SBLs and PBPs with β-lactam antibiotics, showing the formation of the Michaelis complex, enzyme acylation and the final deacylation step that regenerates the enzyme.
Figure 5.
Figure 5.
a) Structural comparison of the global fold of the transpeptidase domain of a PBP enzyme (PBP2a – PDB 3ZG0) and SBLs from classes A (KPC-2 – PDB 20V5), C (PDC-3 – PDB 4GZB) and D (OXA-10 – PDB 1K55), and a class B enzyme, i.e., an MBL (NDM-1 – PDB 4EYL). The Ω-loop region in SBLs are highlighted in yellow. b) Active sites of class A, C and D SBLs, with key catalytic residues displayed as sticks.
Figure 6.
Figure 6.
Correlation between consensus BBL numbering positions, and actual residue numbers in various MBLs.
Figure 7.
Figure 7.
Structures showing the general fold of the B1, B2 and B3 subclasses of MBLs. Enzymes represented are B1: IMP-1 (PDB 1DD6), B2: CphA (PDB 1X8G) and B3: BJP-1 (3LVZ). Zn(II) ions are shown as grey spheres.
Figure 8.
Figure 8.
Typical active-site metal coordination geometry for B1, B2, and B3 MBLs (Top). The non-standard Zn(II) coordination spheres for the enzymes SPS-1 (B1) and GOB-18 (B3) are displayed (Bottom). Zn(II) ions and water molecules / hydroxide ions are displayed as grey and red spheres, respectively. For SPS-1, Gly116(bb) and Tyr117(bb) indicate that only the backbone atoms for these residues are represented, while only side chains are represented for all other residues. In images showing binuclear enzymes, Zn1 is displayed at the left, and Zn2 is displayed at the right. The PDB codes for the structures used are: 5N5G (B1 – VIM-1), 3SD9 (B2 – Sfh-I), 3LVZ (B3 – BJP-1), 6CQS (SPS-1), 5K0W (GOB-18).
Figure 9.
Figure 9.
Percent sequence identity matrix for a representative set of B1, B2 and B3 MBLs. Sequences (without leader peptides) were aligned using PSI-Coffee, and the resulting alignment was manually edited in Jalview to match as closely as possible the latest published BBL alignment. The percent sequence identity among each pair of MBLs was calculated by dividing the number of matching residues by the average of the length of the two proteins.
Figure 10.
Figure 10.
a) Structural model of non-hydrolyzed cephalexin bound to NDM-1. Structural model kindly provided by Dr. Nisanth N. Nair. b) Structure of cyclobutanone inhibitor bound to SPM-1 (PDB 5NDB). Zn(II) ions are shown as grey spheres and water molecules / hydroxide ions as red spheres, while bound compounds are shown as colored sticks and protein residues as white sticks (Zn(II) ligands are displayed as thinner sticks). Interactions between the compound and the protein residues and Zn(II) ions are indicated with yellow dashed lines, while coordination interactions of Zn(II) ions by protein residues are shown as green dashed lines.
Figure 11.
Figure 11.
Binding of imipenem (solid lines) or cefotaxime (dashed lines) to apo-BcII (gray lines) and to Zn(II)-BcII (black lines) followed by Trp fluorescence. The absence of changes in the fluorescence of apo-BcII upon substrate addition reveals the lack of binding to this variant. Reproduced with permission from reference Rasia et al. Copyright 2004 American Society for Biochemistry and Molecular Biology.
Figure 12.
Figure 12.
Crystal structure of the adduct of a bi-Zn(II) model complex synthesized by Meyer and coworkers with sulbactam. The oxygen atoms of the carboxylate from sulbactam (O1 and O2) bind the binuclear metal center. Reproduced with permission from reference Meyer et al. Copyright 2012 American Chemical Society.
Figure 13.
Figure 13.
Structural model of aztreonam binding to the active site of BcII. Structural model based on NMR data from Poeylaut-Palena et al..
Figure 14.
Figure 14.
Structures of MBLs from each subclass highlighting key structural features. Zn(II) ions are shown as grey spheres and the metal ligands as white sticks. The L3 loop (and its shorter counterpart in B2 enzymes) is shown in orange, while the α3-β7 loop in B3 enzymes, the L7 loop and the L10 loop are shown in cyan, magenta and red, respectively. The extended α3 helix present in SPM and B2 enzymes is displayed in dark green, and the extended N-terminus in the L1 enzyme is highlighted in blue. PDB codes for the structures: NDM-1 – 4EXY, SPM-1 – 4BP0, CphA – 1X8G, L1 – 1SML, FEZ-1 – 1K07.
Figure 15.
Figure 15.
Equilibrium between the ‘open’ (PDB 2FHX) and ‘closed’ (PDB 4BP0) conformations of SPM-1. Mobile regions are highlighted in blue (L3 loop), red (L10 loop) and green (α3 region). Reproduced with permission from reference Brem et al. Published by The Royal Society of Chemistry.
Figure 16.
Figure 16.
Active-site bonding networks in subclass B1 MBLs : BcII (PDB 1BC2), NDM-1 (PDB 6TWT), BlaB (PDB 1M2X), IMP-1 (PDB 1DDK), CcrA (PDB 1ZNB), VIM-2 (PDB 1KO3) and SPM-1 (PDB 4BP0). Hydrogen bonding and ionic interactions are shown as dashed green lines. The different protein regions connected through the conserved interaction network are depicted as cartoon representations of different colors. Zinc ions are rendered as grey spheres, sodium ions as magenta spheres and water molecules as red spheres
Figure 17.
Figure 17.
Phylogenetic tree of the IMP enzyme family. The location of IMP-1 is shown in green. Protein sequences were aligned using Clustal Omega, phylogenetic trees were constructed using PhyML (via the phylogeny.fr web server) and tree representations were generated with iTOL.
Figure 18.
Figure 18.
Structure of IMP-1 (PDB 4C1G) highlighting the positions presenting sequence variation within the IMP family. The positions are colored (from black to red) in the cartoon representation according to an increasing absolute frequency of mutation within all IMP enzymes with respect to IMP-1. The side chains of positions with a frequency of substitution in the top 4 categories are shown as sticks.
Figure 19.
Figure 19.
Front and back view of IMP-1 showing the active-site loops (L10 and L3) and second-shell sphere regions involved in substrate recognition and turnover. Side chains of most relevant residues are shown as sticks, metal ligands as lines and Zn(II) ions as spheres (PDB 5EV6). L3 loop and Phe87 are shown in magenta, L10 in cyan.
Figure 20.
Figure 20.
Structures of unbound IMP-1 (PDB 1DDK, open) and IMP-1 in complex with a mercaptocarboxylate inhibitor (PDB 1DD6, closed). The change in the position of Trp64 side chain is highlighted.
Figure 21.
Figure 21.
Binding of substrates/inhibitors to IMP enzymes. a) Cartoon representation of of IMP-1 active site in complex with mercaptocarboxylate inhibitor (PDB 1DD6). b) Surface of IMP-13 in complex with hydrolyzed doripenem (PDB 6S0H). c) Cartoon representation of IMP-13 active site with hydrolyzed meropenem (PDB 6S0H). Residues involved in interactions (dashed lines) with inhibitor/substrate are shown as sticks. L3 loop and Phe87 are shown in magenta, L10 in cyan.
Figure 22.
Figure 22.
Conformation of the L3 loop from IMP-1 (PDB 1DDK, open), IMP-1 in complex with mercaptocarboxylate (PDB 1DD6, closed), IMP-2 (PDB 4UBQ) and IMP-18 (PDB 5B3R).
Figure 23.
Figure 23.
Phylogenetic tree of the VIM enzyme family. The 5 groups present within the family are highlighted in colors, and the locations of the reference enzymes within each group are shown in green. Protein sequences were aligned using Clustal Omega, phylogenetic trees were constructed using PhyML (via the phylogeny.fr web server) and tree representations were generated with iTOL.
Figure 24.
Figure 24.
Structures of VIM-1 (a, PDB 5N5G) and VIM-2 (b, PDB 1KO3) highlighting the positions presenting sequence variation within the VIM-1 and VIM-2 enzyme groups. The positions are colored in the cartoon representation according to increasing absolute frequency of mutation within VIM enzymes belonging to each group. The side chains of those positions with a frequency of substitution in the top 4 categories are shown as sticks.
Figure 25.
Figure 25.
Comparison of VIM active sites. a) Active site of VIM-1, showing positions of His224 and Ser228 and location of Cys221-bound water Wat3. Hydrogen bonding interactions are shown as dashed lines (PDB 5N5G). b) Active site superpositions of VIM-2 (PDB 4BZ3, orange) and VIM-4 (PDB 2WHG, white) showing variations at positions 224 and 228.
Figure 26.
Figure 26.
Binding of hydrolyzed meropenem to VIM-1 (PDB 5N5I, green) and NDM-1 (PDB 5N0H, gray). Bound hydrolyzed meropenem is shown in pink and orange for VIM-1 and NDM-1, respectively. Interactions of substrate C3/C4 carboxylate with active site residues or water molecules are shown as dashed lines.
Figure 27.
Figure 27.
Phylogenetic tree of the NDM enzyme family. The location of NDM-1 is shown in green. Protein sequences were aligned using Clustal Omega, phylogenetic trees were constructed using PhyML (via the phylogeny.fr web server) and tree representations were generated with iTOL.
Figure 28.
Figure 28.
Structure of NDM-1 (PDB 4EXY) highlighting the positions presenting sequence variation within the NDM enzyme family. The positions are colored in the cartoon representation according to increasing absolute frequency of mutation within NDM enzymes belonging to each group. The side chains of those positions with a frequency of substitution in the top 4 categories are shown as sticks.
Figure 29.
Figure 29.
Network diagram of the NDM family, showing residue substitutions generating the different allelic variants. The color coding indicates the number of mutations with respect to NDM-1, as indicated in the figure.
Figure 30.
Figure 30.
Allelic variants of NDM display an increased tolerance to Zn(II) starvation with respect to that of NDM-1. MIC values of cefotaxime for E. coli cells expressing different NDM variants in growth medium supplemented with increasing concentrations of dipicolinic acid (DPA), shown relative to the MIC in 0 μM DPA.
Figure 31.
Figure 31.
Angle determined by the loop L3 and the plane of the active site of NDM-1 (PDB 3SPU, green), and L3IMP (PDB 6C6I, cyan) and L3Pro (PDB 6CAC, yellow) mutants. Angles between Zn1, Cα of Ser69 and Cα of Gly63 are as follows: L3IMP, 68°; NDM-1, 88°; and L3Pro, 110°. L3IMP corresponds to NDM-1 in which the L3 loop (residues 57 to 68) was replaced by the one from IMP-1; L3Pro is a mutant of NDM-1 with a Pro inserted after Ala68.
Figure 32.
Figure 32.
Active-site topology in B1, B2 and B3 enzymes. Structures of NDM-1 (B1) (PDB 3S0Z), CphA (B2) (PDB 1X8G) and L1 (B3) (PDB 1SML) are shown as surfaces. Zn(II) ions are depicted as grey spheres.
Figure 33.
Figure 33.
Phylogenetic tree showing the clustering of the different subclasses of MBLs with respect to other members of the MBL superfamily. Protein sequences were aligned with PSI-Coffee, alignments were trimmed using JalView to remove highly gapped and poor-quality regions, and phylogenetic trees were calculated using PhyML (via the phylogeny.fr web server). Tree representations were constructed using iTOL.
Figure 34.
Figure 34.
a) Comparison of the general structures of various members of the MBL superfamily. For each protein, the characteristic MBL fold domain is indicated in green, while additional domains present in some MBL superfamily members are highlighted in other colors. Metal ions within the active site are shown as spheres, and the Zn2 (or equivalent) site is oriented towards the front. Proteins names ending in an asterisk indicate that the physiological form of protein comprises homodimers or other homooligomers, which are not shown. b) Active-site metal coordination spheres for the MBL superfamily members indicated in panel a). Zn(II), Fe(II)/Fe(III) and Mn(II) ions are represented as grey, orange and light violet spheres, respectively, while water molecules / hydroxide ions are shown as red spheres. PDB codes for the structures are: CcrA – 1ZNB, ZipD – 2CBN, SdsA1 – 2CFU, CPSF73 – 2I7V, FlRd – 4D02, GloB – 2QED, UlaG – 2WYM, PhnP – 3P2U.
Figure 35.
Figure 35.
Photodiode array stopped-flow spectra of di-Co(II) BcII showing changes in the ligand-to-metal charge transfer (LMCT, 343 nm) and ligand field bands (d-d, 500–650 nm) during the hydrolysis of benzylpenicillin. The inset shows an amplification of the ligand field bands (in the 450–700 nm region of the spectra). The arrows indicate whether there is an increase or a decrease in the intensity of the corresponding absorption bands in the transition from an ES complex to the resting state enzyme. Adapted with permission from reference Llarrull et al. Copyright 2008 American Chemical Society.
Figure 36.
Figure 36.
Titration of apo-BcII with Co(II). The simultaneous growth of the LMCT band and the ligand field bands shows that (under these conditions) both metal sites are simultaneously loaded. Adapted with permission from reference Llarrull et al. Copyright 2007 American Society for Biochemistry and Molecular Biology.
Figure 37.
Figure 37.
Mechanism of penicillin hydrolysis by bi-Zn(II) MBLs, with two proposed pathways for the protonation step. a) The nucleophilic hydroxide (blue) detaches from Zn2 upon substrate binding in ES. The water ligand originally bound to Zn2 (red) becomes a bridging ligand, becoming acidic and acting as the proton donor and regenerating the nucleophilic hydroxide. Based on the work from Llarrull, Vila and coworkers. b) The Zn2-bound apical water (red) is detached from the metal site upon substrate binding. An additional water molecule from the bulk solvent (green) is incorporated into the active site in the subsequent step, acting as the proton donor. Based on the work from Nair and coworkers.
Figure 38.
Figure 38.
Structure of NDM-1 bound to hydrolyzed oxacillin (PDB 4EYB). Zn(II) ions and water molecules / hydroxide ions are shown as grey and red spheres, respectively, while the ligand is shown as green sticks and protein residues as white sticks. Interactions between the Zn(II) ions and their coordination residues are shown as green dashed lines, and interactions of the ligand with the protein are shown as yellow dashed lines.
Figure 39.
Figure 39.
possible reactions occurring after hydrolysis of the β-lactam ring in cephalosporins.
Figure 40.
Figure 40.
Chromogenic cephalosporin substrates.
Figure 41.
Figure 41.
a) Spectral changes during nitrocefin hydrolysis by CcrA, monitored by stopped-flow absorbance meassurements. The first spectrum was acquired at 1.28 ms after mixing, and each subsequent spectrum 2.56 ms after its predecessor. Reproduced with permission from reference Wang and Benkovic. Copyright 1998 American Chemical Society. b) Structure postulated for the anionic reaction intermediate of nitrocefin hydrolyzed by a binuclear Zn(II) complex. Adapted with permission from reference Kaminskaia, Lippard et al. Copyright 2001 American Chemical Society.
Figure 42.
Figure 42.
Mechanism of nitrocefin hydrolysis by bi-Zn(II) MBLs. Based on the work from Wang, Fast and Benkovic.
Figure 43.
Figure 43.
Structure of NDM-1 bound to hydrolyzed cefuroxime (PDB 4RL0). Zn(II) ions and water molecules / hydroxide ions are shown as grey and red spheres, respectively, while the ligand is shown as orange sticks and protein residues as white sticks. Interactions between the Zn(II) ions and their coordination residues are shown as green dashed lines, and interactions of the ligand with the protein are shown as yellow dashed lines.
Figure 44.
Figure 44.
possible tautomers in hydrolyzed carbapenems.
Figure 45.
Figure 45.
Spectral changes during hydrolysis of imipenem by bi-Co(II) BcII, monitored by stopped-flow absorbance meassurements. The absorption at 408 nm is due to the anionic intermediate, obscuring the Cys-Co(II) LMCT band. The inset shows changes in the ligand field band during turnover, that reveal modifications in geometry of the Co(II) center. Adapted with permission from reference Tioni, Llarrull, Vila and coworkers. Copyright 2008 American Chemical Society.
Figure 46.
Figure 46.
Mechanism of carbapenem hydrolysis by di-Zn(II) MBLs. Reproduced with permission from reference Lisa, Palacios and coworkers. Copyright 2017 Springer Nature under Creative Commons Attribution 4.0 International License https://creativecommons.org/license/by/4.0/.
Figure 47.
Figure 47.
Structure of NDM-1 bound to meropenem (PDB 5YPN). Zn(II) ions are shown as grey spheres, while the ligand is shown as orange sticks and protein residues as white sticks. Interactions between the Zn(II) ions and their coordination residues are shown as green dashed lines, and interactions of the ligand with the protein are shown as yellow dashed lines.
Figure 48.
Figure 48.
Mechanism of carbapenem hydrolysis by mono-Zn(II) MBLs. Reproduced with permission from reference Lisa, Palacios and coworkers. Copyright 2017 Springer Nature under Creative Commons Attribution 4.0 International License https://creativecommons.org/license/by/4.0/.
Figure 49.
Figure 49.
a) Structure of the bi-Zn(II) form of CphA (PDB 3F9O). b) Structure of NDM-1 (PDB 3SPU, chain B). Zn(II) ions and water molecules / hydroxide ions are shown as grey and red spheres, respectively, while protein residues are shown as sticks. Interactions between the Zn(II) ions and their coordination residues are shown as green dashed lines.
Figure 50.
Figure 50.
a) Structure of the penicillin core, and β-lactam based SBL inhibitors. b) Diazabyciclooctanone (DBO) β-lactamase inhibitors.
Figure 51.
Figure 51.
Dendrogram of NDM-1 inhibitors. Inhibitors are classified into three main categories (small molecules, natural compounds, and β-lactams) and clustered based on their chemical similarity. Each inhibitor is represented by a colored dot at the end of each branch. The color coding indicates the potency of the inhibitor against NDM-1, as indicated in the color bar at the bottom. Gray colors correspond to compounds with no inhibitory action. Reproduced with permission from reference Linciano et al. Copyright 2019 American Chemical Society.
Figure 52.
Figure 52.
a) MBL inhibitors inspired on β-lactam scaffolds. b) Crystal complex of L-15:NDM-1 (PDB 4U4L) c) Crystal complex of D-15:IMP-1 (PDB 5EV8). Zn(II) ions are shown as grey spheres, protein residues are shown as white sticks, while the bound ligands are shown as colored sticks and water molecules are shown as red spheres. Protein-ligand interactions are shown as dashed lines.
Figure 53.
Figure 53.
a) Thiol-based inhibitors. b) Model of meropenem bound to NDM-1 (base PDB 3SPU). c – e) Crystal complexes of 17:IMP-1 (c, PDB 1DD6), D-22:IMP-1 (d, PDB 4C1G), and 24:NDM-1 (e, PDB 6ZYP). Zn(II) ions are shown as grey spheres, protein residues are shown as white sticks (green sticks for residues involved in hydrophobic interactions with the ligand), while the bound ligands are shown as colored sticks and water molecules are shown as red spheres. Protein-ligand interactions are shown as dashed lines.
Figure 54.
Figure 54.
a) Structure of carboxylate-based inhibitor 25. b) Crystal complex of 25:IMP-1 (PDB 1JJT). Zn(II) ions are shown as grey spheres, protein residues are shown as white sticks, while the bound ligand is shown as colored sticks. Protein-ligand interactions are shown as dashed lines.
Figure 55.
Figure 55.
a) Phosphonate-based inhibitors. b) Crystal complex of 26:IMP-1 (PDB 5HH4). c) Crystal complex of 27:NDM-1 (PDB 6D1D). Zn(II) ions are shown as grey spheres, protein residues are shown as white sticks (green sticks for residues involved in hydrophobic interactions with the ligand), while the bound ligands are shown as colored sticks. Protein-ligand interactions are shown as dashed lines.
Figure 56.
Figure 56.
a) Boronate-based inhibitors. b-e) Crystal complexes of 29:VIM-2 (b, PDB 6SP7), 29:NDM-1 (c, PDB 6RMF), 30:NDM-1 (d, PDB 6V1M) and 31:BcII (e, PDB 5FQB). Zn(II) ions are shown as grey spheres, protein residues are shown as white sticks, while the bound ligands are shown as colored sticks and water molecules are shown as red spheres. Protein-ligand interactions are shown as dashed lines.
Figure 57.
Figure 57.
a) Rhodanine inhibitor ML302 32a, and its product generated upon MBL-mediated hydrolysis 32b. b) Crystal complex of 32b:VIM-2 (PDB 4PVO). Zn(II) ions are shown as grey spheres, protein residues are shown as white sticks, while the bound ligands are shown as colored sticks. Protein-ligand interactions are shown as dashed lines.
Figure 58.
Figure 58.
a) Inhibitors that covalently bind to the Cys ligand. b) Inhibitors that covalently bind to Lys224. c) Crystal complex of 36:IMP-1 (PDB 1VGN) d) Crystal complex of 37:NDM-1 (PDB 6OVZ). Zn(II) ions are shown as grey spheres, protein residues are shown as white sticks, while the bound ligands are shown as colored sticks. Protein-ligand interactions are shown as dashed lines.
Figure 59.
Figure 59.
Metal chelator MBL inhibitors.
Figure 60.
Figure 60.
a) Structure of inhibitors leading to metal replacement in MBLs. b) Metal coordination sphere of NDM-1 bound to Bi(III) (PDB 5XP9). c) Metal coordination sphere of NDM-1 bound to Au(I) ions (PDB 6LHE). Bi(III) and Au(I) ions are shown as purple and gold spheres, respectively, while protein residues are shown as sticks and water molecules are shown as red spheres. Ligand-metal interactions are shown as dashed lines.
Figure 61.
Figure 61.
General scheme for the regulation of β-lactamase by AmpR, and its interface with the PG recycling pathway in Gram-negative bacteria. Reproduced with permission from reference. Copyright 2015 American Society for Biochemistry and Molecular Biology.
Figure 62.
Figure 62.
a) Biogenesis pathways for Gram-negative bacterial lipoproteins vs. soluble periplasmic proteins secreted through the Sec system. b) General structure a tri-acylated bacterial lipoprotein. The amide-linked acyl group is highlighted in green, while the S-linked diacylglycerol is shown in blue.
Figure 63.
Figure 63.
Structural model of the interaction of NDM-1 with the surface of lipid membranes (obtained from MD simulations by Prunotto et al.). Active-site Zn(II) ions are shown as grey spheres. The N-terminal lipidated Cys and key residues for membrane interaction (Arg 39 and Arg46) are shown as spheres.
Figure 64.
Figure 64.
a) Schematic representation of the mechanism of OMV biogenesis. Reproduced with permission from reference Jan. Copyright 2017 Markley and Wencewicz under Creative Commons Attribution License (CCBY) https://creativecommons.org/licenses/by/4.0/ b) Scanning electron micrograph of OMVs (indicated by arrows) attached to the surface of Prochlorococcus cells. Scale bar, 1 μm. Reproduced with permission from reference Biller et al. Copyright 2014 American Association for the Advancement of Science c) Transmission electron micrographs of S. Typhimurium cells expressing PagL from a vector, or containing the empty vector, showing induction of OMV production by PagL. Adapted with permission from reference Elhenawy, Feldman et al. Copyright 2016 American Society for Micrbiology under Creative Commons Attribution 4.0 International License https://creativecommons.org/license/by/4.0/.
Figure 65
Figure 65
a) Schematic representation of antibiotic resistance gene mobilization and horizontal transfer into a new host. b – g: Structure of commonly encountered mobile genetic elements (MGEs).
Figure 66.
Figure 66.
Examples of genetic contexts of blaVIM-1, blaVIM-2, blaIMP-8, blaSPM-1 and blaNDM-1, genes. Resistance genes are indicated as red arrows, and MBL genes are highlighted with bold outlines.
Figure 67.
Figure 67.
The action of neutrophils in bacterial infections. a) Migration to the sites of infection. b) Mechanisms of pathogen clearance. c) Metal limitation at sites of infection through secretion of calprotectin. Adapted with permission from reference Corbin, Skaar et al. Copyright 2008 American Association for the Advancement of Science.
Figure 68.
Figure 68.
Mechanisms of Zn(II) homeostasis in Gram-negative bacteria, including Zn(II) import by the ZnuABC transporter, replacement of Zn(II)-dependent ribosomal proteins, Zn(II) passive entry into the periplasm through porins and through active transport by the action of ZnuD, and the acquisition of this metal ion by the use of zincophores and zinc piracy.
Figure 69.
Figure 69.
Kinetic stability of MBLs in the bacterial periplasm depends on a balance between competing processes of MBL metallation (kon), de-metallation (koff), apo enzyme degradation (kdeg) and aggregation (kagg).
Figure 70.
Figure 70.
Model of zinc-dependent modulation of MBL stability in vivo for NDMs, VIMs, BcII and SPM-1. Apo enzymes generated during metal limitation are susceptible to degradation and aggregation. Anchoring of NDM-1 to the outer membrane prevents degradation by DegP due to the permeability barrier of the peptidoglycan layer preventing passage of this high molecular weight protease. Mutations H254R (in VIM-2) and M150aL and A248V (in NDM-1) improve tolerance of these MBLs to Zn(II) depletion either by improving stability of the apo enzymes or by increasing their Zn(II) affinity.
Figure 71.
Figure 71.
Methods for carbapenemase detection. a) Modified Hodge Test (MHT). b) Carba NP positive result, showing tube with no imipenem added (red) and with imipenem added (yellow). c-d) Modified carbapenem inactivation method (mCIM) positive (c) and negative (d) results. e-f) mCIM and EDTA-mCIM (eCIM) for a SBL producer (e) and for an MBL producer (f). g) double disk synergy test for detection of MBLs, using imipenem (IMP) and EDTA disks. h) NG-Test Carba 5 (NG Biotech) lateral flow immunoassay (LFIA) showing the different carbapenemase detected. Panels a), b), c), d), e), f) and h) adapted with permission from refence Tamma et al. Copyright 2018 American Society for Microbiology. Panel g) adapted with permission from reference Lee et al. Copyright 2003 American Society for Microbiology.
Figure 72.
Figure 72.
Structure of evolved variant of BcII, M5 (PDB 3FCZ). Mutations with respect to wild type BcII are indicated as spheres. Zinc ions are shown as magenta spheres.

References

    1. Fleming A On the Antibacterial Action of Cultures of a Penicillium, with Special Reference to Their Use in the Isolation of B. Influenzæ. British Journal of Experimental Pathology 1929, 10, 226–236.
    1. Fleming A Streptococcal Meningitis Treated with Penicillin.: Measurement of Bacteriostatic Power of Blood and Cerebrospinal Fluid. The Lancet 1943, 242, 434–438.
    1. Abraham EP History of B-Lactam Antibiotics. In Antibiotics: Containing the Beta-Lactam Structure, Demain AL; Solomon NA, Eds. Springer Berlin Heidelberg: Berlin, Heidelberg, 1983; pp 1–14.
    1. Bennett JW; Chung KT Alexander Fleming and the Discovery of Penicillin. Adv. Appl. Microbiol 2001, 49, 163–184. - PubMed
    1. Bush K; Bradford PA Beta-Lactams and Beta-Lactamase Inhibitors: An Overview. Cold Spring Harb Perspect Med 2016, 6. - PMC - PubMed

Publication types

MeSH terms