Meta-Analysis
. 2021 Jun 15;15(6):e0009156.
doi: 10.1371/journal.pntd.0009156. eCollection 2021 Jun.

Covid-19 in end-stage renal disease patients with renal replacement therapies: A systematic review and meta-analysis

Affiliations
Meta-Analysis

Covid-19 in end-stage renal disease patients with renal replacement therapies: A systematic review and meta-analysis

Tanawin Nopsopon et al. PLoS Negl Trop Dis. .

Abstract

Background: The novel coronavirus (COVID-19), caused by SARS-CoV-2, showed various prevalence and case-fatality rates (CFR) among patients with different pre-existing chronic conditions. End-stage renal disease (ESRD) patients with renal replacement therapy (RRT) might have a higher prevalence and CFR due to reduced immune function from uremia and kidney tropism of SARS-CoV-2, but there was a lack of systematic study on the infection and mortality of the SARS-CoV-2 infection in ESRD patients with various RRT.

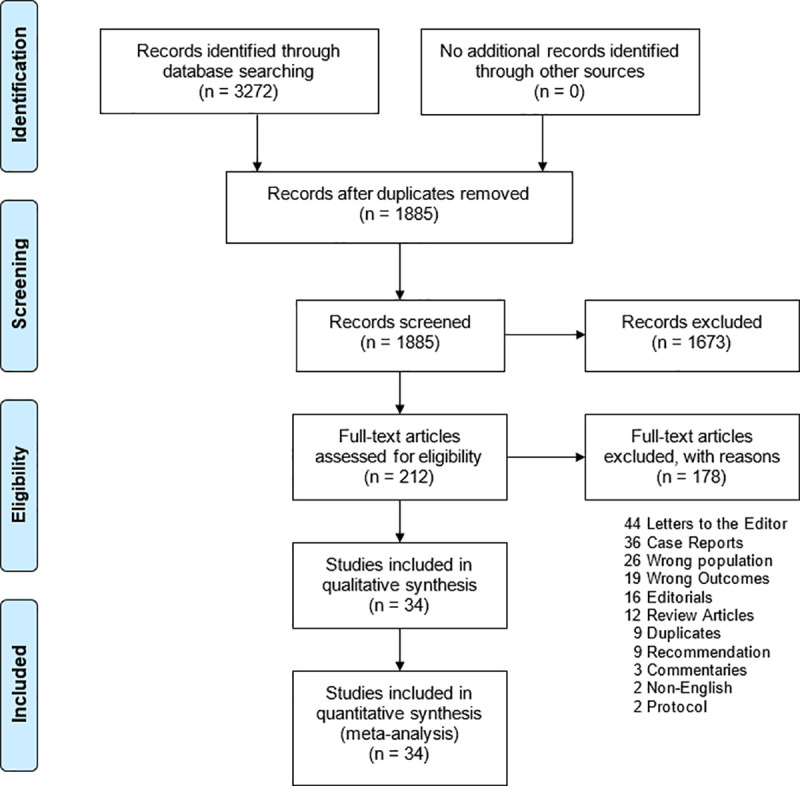
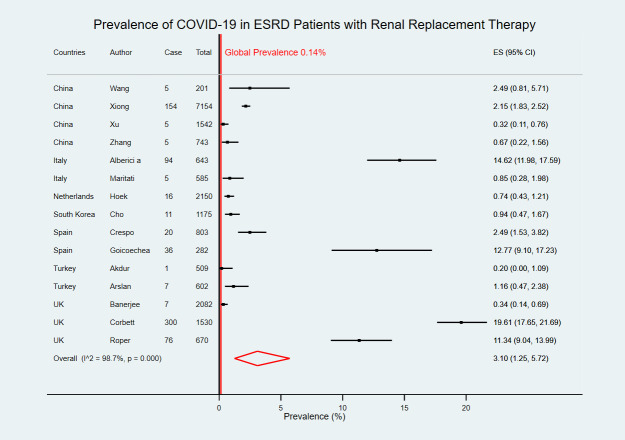
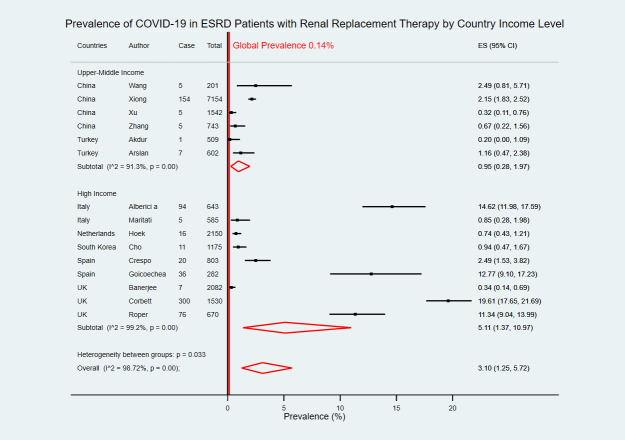
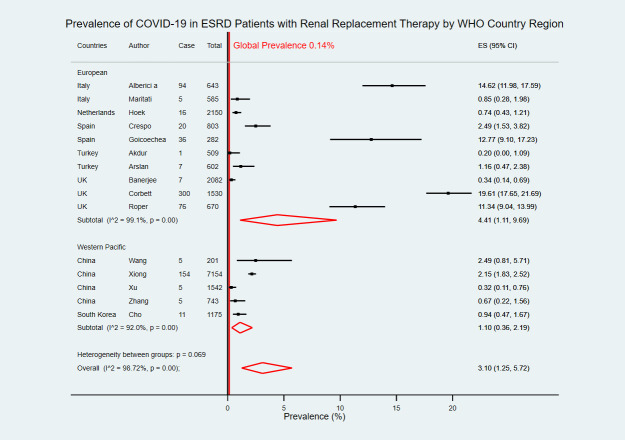
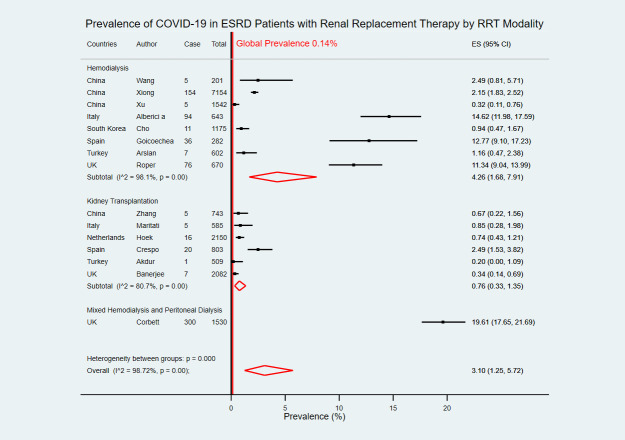
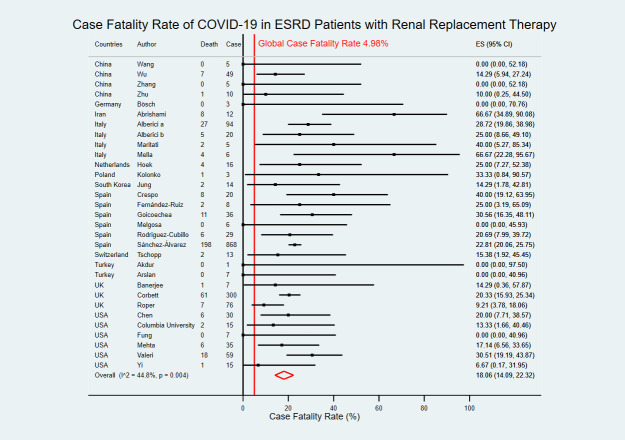
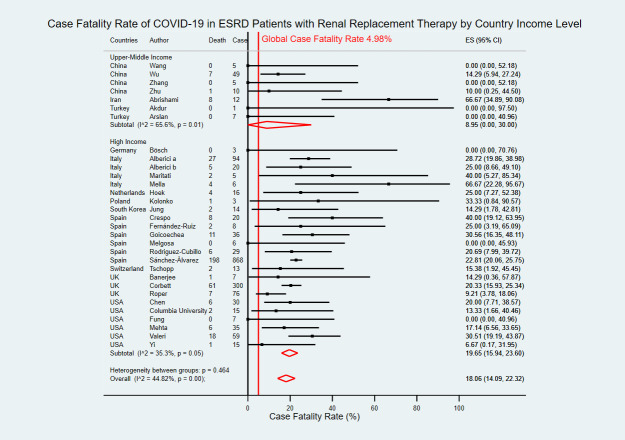
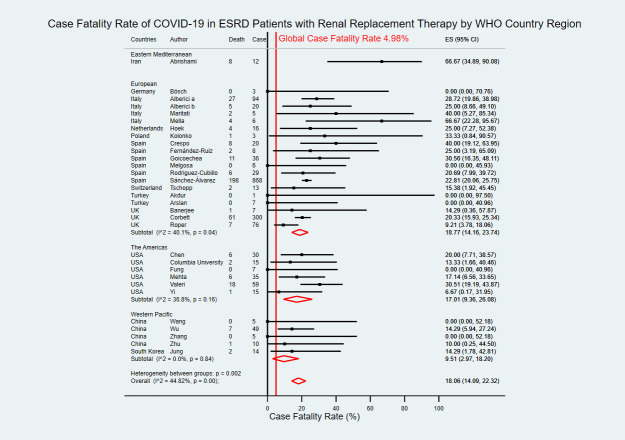
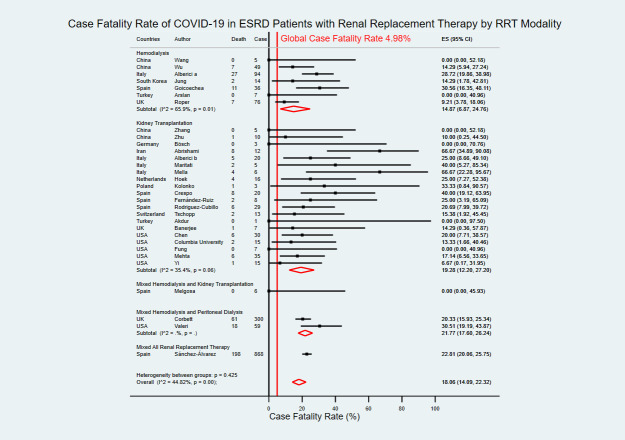
Methodology/principal findings: We searched five electronic databases and performed a systematic review and meta-analysis up to June 30, 2020, to evaluate the prevalence and case fatality rate (CFR) of the COVID-19 infection among ESRD patients with RRT. The global COVID-19 data were retrieved from the international database on June 30, 2020, for estimating the prevalence and CFR of the general population as referencing points. Of 3,272 potential studies, 34 were eligible studies consisted of 1,944 COVID-19 confirmed cases in 21,873 ESRD patients with RRT from 12 countries in four WHO regions. The overall pooled prevalence in ESRD patients with RRT was 3.10% [95% confidence interval (CI) 1.25-5.72] which was higher than referencing 0.14% global average prevalence. The overall estimated CFR of COVID-19 in ESRD patients with RRT was 18.06% (95% CI 14.09-22.32) which was higher than the global average at 4.98%.

Conclusions: This meta-analysis suggested high COVID-19 prevalence and CFR in ESRD patients with RRT. ESRD patients with RRT should have their specific protocol of COVID-19 prevention and treatment to mitigate excess cases and deaths.


Conflict of interest statement

The authors have declared that no competing interests exist.

Figures

Fig 1
Fig 1. Preferred Reporting Items for Systematic Reviews and Meta-Analyses flowchart of study selection and database search.
Fig 2
Fig 2. Forest plot of the prevalence of COVID-19 in ESRD patients with RRT.
The figure summarizes the number of COVID-19 confirmed cases in end-stage renal disease (ESRD) patients with renal replacement therapy (RRT) and the total number of ESRD patients with RRT in 15 eligible studies. The forest plot represents the estimated prevalence of COVID-19 in ESRD patients with RRT for each study (black boxes), with 95% confidence intervals (95% CI; horizontal black lines). The estimated pooled prevalence (red diamond) was 3.10% (95% CI 1.25–5.72). The global average prevalence (vertical red line) was 0.14%. The meta-analysis used a random-effects model with the exact method for confidence interval estimation. ES, effect size. I2, test for heterogeneity.
Fig 3
Fig 3. Forest plot of the prevalence of COVID-19 in ESRD patients with RRT by country income level.
The figure summarizes the number of COVID-19 confirmed cases in ESRD patients with RRT and the total number of ESRD patients with RRT in 15 eligible studies with subgroup analysis by the World Bank country income level. The forest plot represents the estimated prevalence of COVID-19 in ESRD patients with RRT for each study (black boxes), with 95% confidence intervals (95% CI; horizontal black lines). The estimated pooled prevalence for each subgroup was presented with a red diamond. The overall estimated pooled prevalence (last red diamond) was 3.10% (95% CI 1.25–5.72). The global average prevalence (vertical red line) was 0.14%. The meta-analysis used a random-effects model with the exact method for confidence interval estimation. ES, effect size. I2, test for heterogeneity.
Fig 4
Fig 4. Forest plot of the prevalence of COVID-19 in ESRD patients with RRT by WHO country region.
The figure summarizes the number of COVID-19 confirmed cases in ESRD patients with RRT and the total number of ESRD patients with RRT in 15 eligible studies with subgroup analysis by WHO country regions. The forest plot represents the estimated prevalence of COVID-19 in ESRD patients with RRT for each study (black boxes), with 95% confidence intervals (95% CI; horizontal black lines). The estimated pooled prevalence for each subgroup was presented with a red diamond. The overall estimated pooled prevalence (last red diamond) was 3.10% (95% CI 1.25–5.72). The global average prevalence (vertical red line) was 0.14%. The meta-analysis used a random-effects model with the exact method for confidence interval estimation. ES, effect size. I2, test for heterogeneity.
Fig 5
Fig 5. Forest plot of the prevalence of COVID-19 in ESRD patients with RRT by RRT modality.
The figure summarizes the number of COVID-19 confirmed cases in ESRD patients with RRT and the total number of ESRD patients with RRT in 15 eligible studies with subgroup analysis by types of RRT modality. The forest plot represents the estimated prevalence of COVID-19 in ESRD patients with RRT for each study (black boxes), with 95% confidence intervals (95% CI; horizontal black lines). The estimated pooled prevalence for each subgroup was presented with a red diamond. The overall estimated pooled prevalence (last red diamond) was 3.10% (95% CI 1.25–5.72). The global average prevalence (vertical red line) was 0.14%. The meta-analysis used a random-effects model with the exact method for confidence interval estimation. ES, effect size. I2, test for heterogeneity.
Fig 6
Fig 6. Forest plot of the case fatality rate of COVID-19 in ESRD patients with RRT.
The figure summarizes the number of COVID-19 deaths in ESRD patients with RRT and the number of COVID-19 confirmed cases in ESRD patients with RRT in 31 eligible studies. The forest plot represents the estimated case fatality rate of COVID-19 in ESRD patients with RRT for each study (black boxes), with 95% confidence intervals (95% CI; horizontal black lines). The estimated pooled case fatality rate (red diamond) was 18.06% (95% CI 14.09–22.32). The global case fatality rate (vertical red line) was 4.98%. The meta-analysis used a random-effects model with the exact method for confidence interval estimation. ES, effect size. I2, test for heterogeneity.
Fig 7
Fig 7. Forest plot of the case fatality rate of COVID-19 in ESRD patients with RRT by country income level.
The figure summarizes the number of COVID-19 deaths in ESRD patients with RRT and the number of COVID-19 confirmed cases in ESRD patients with RRT in 31 eligible studies with subgroup analysis by the World Bank country income level. The forest plot represents the estimated case fatality rate of COVID-19 in ESRD patients with RRT for each study (black boxes), with 95% confidence intervals (95% CI; horizontal black lines). The estimated pooled case fatality rate for each subgroup was presented with a red diamond. The overall estimated pooled case fatality rate (last red diamond) was 18.06% (95% CI 14.09–22.32). The global case fatality rate (vertical red line) was 4.98%. The meta-analysis used a random-effects model with the exact method for confidence interval estimation. ES, effect size. I2, test for heterogeneity.
Fig 8
Fig 8. Forest plot of the case fatality rate of COVID-19 in ESRD patients with RRT by WHO country region.
The figure summarizes the number of COVID-19 deaths in ESRD patients with RRT and the number of COVID-19 confirmed cases in ESRD patients with RRT in 31 eligible studies with subgroup analysis by WHO country regions. The forest plot represents the estimated case fatality rate of COVID-19 in ESRD patients with RRT for each study (black boxes), with 95% confidence intervals (95% CI; horizontal black lines). The estimated pooled case fatality rate for each subgroup was presented with a red diamond. The overall estimated pooled case fatality rate (last red diamond) was 18.06% (95% CI 14.09–22.32). The global case fatality rate (vertical red line) was 4.98%. The meta-analysis used a random-effects model with the exact method for confidence interval estimation. ES, effect size. I2, test for heterogeneity.
Fig 9
Fig 9. Forest plot of the case fatality rate of COVID-19 in ESRD patients with RRT by RRT modality.
The figure summarizes the number of COVID-19 deaths in ESRD patients with RRT and the number of COVID-19 confirmed cases in ESRD patients with RRT in 31 eligible studies with subgroup analysis by types of RRT modality. The forest plot represents the estimated case fatality rate of COVID-19 in ESRD patients with RRT for each study (black boxes), with 95% confidence intervals (95% CI; horizontal black lines). The estimated pooled case fatality rate for each subgroup was presented with a red diamond. The overall estimated pooled case fatality rate (last red diamond) was 18.06% (95% CI 14.09–22.32). The global case fatality rate (vertical red line) was 4.98%. The meta-analysis used a random-effects model with the exact method for confidence interval estimation. ES, effect size. I2, test for heterogeneity.

References

    1. Zhu N, Zhang D, Wang W, Li X, Yang B, Song J, et al.. A Novel Coronavirus from Patients with Pneumonia in China, 2019. N Engl J Med. 2020;382(8):727–33. Epub 2020/01/25. doi: 10.1056/NEJMoa2001017 - DOI - PMC - PubMed
    1. World Health Organization. Coronavirus disease 2019 (COVID-19). Situation Report 51. https://www.who.int/docs/default-source/coronaviruse/situation-reports/2....
    1. Worldometers.info. COVID-19 Coronavirus Pandemic: Reported Cases and Deaths by Country, Territory, or Conveyance. https://www.worldometers.info/coronavirus/#countries.
    1. Wang D, Hu B, Hu C, Zhu F, Liu X, Zhang J, et al.. Clinical Characteristics of 138 Hospitalized Patients With 2019 Novel Coronavirus-Infected Pneumonia in Wuhan, China. Jama. 2020;323(11):1061–9. Epub 2020/02/08. doi: 10.1001/jama.2020.1585 - DOI - PMC - PubMed
    1. Cheng Y, Luo R, Wang K, Zhang M, Wang Z, Dong L, et al.. Kidney disease is associated with in-hospital death of patients with COVID-19. Kidney Int. 2020;97(5):829–38. Epub 2020/04/06. doi: 10.1016/j.kint.2020.03.005 - DOI - PMC - PubMed