. 2021 Jun;18(179):20201006.
doi: 10.1098/rsif.2020.1006. Epub 2021 Jun 16.

A dynamic, ensemble learning approach to forecast dengue fever epidemic years in Brazil using weather and population susceptibility cycles

Affiliations

A dynamic, ensemble learning approach to forecast dengue fever epidemic years in Brazil using weather and population susceptibility cycles

Sarah F McGough et al. J R Soc Interface. 2021 Jun.

Abstract

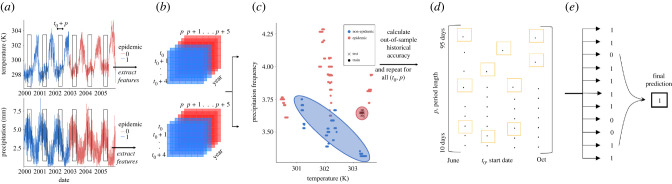
Transmission of dengue fever depends on a complex interplay of human, climate and mosquito dynamics, which often change in time and space. It is well known that its disease dynamics are highly influenced by multiple factors including population susceptibility to infection as well as by microclimates: small-area climatic conditions which create environments favourable for the breeding and survival of mosquitoes. Here, we present a novel machine learning dengue forecasting approach, which, dynamically in time and space, identifies local patterns in weather and population susceptibility to make epidemic predictions at the city level in Brazil, months ahead of the occurrence of disease outbreaks. Weather-based predictions are improved when information on population susceptibility is incorporated, indicating that immunity is an important predictor neglected by most dengue forecast models. Given the generalizability of our methodology to any location or input data, it may prove valuable for public health decision-making aimed at mitigating the effects of seasonal dengue outbreaks in locations globally.

Keywords: dengue; ensemble; forecasting.


Figures

Figure 1.
Figure 1.
Ensemble forecast workflow. (a) To predict next year's epidemic status, we extract features from a daily time series of temperature (K) and precipitation (mm) over a defined (t0, p) time interval and for each year in the training period. (b) We produce an array of features corresponding to the mean value of temperature and precipitation over the (t0, p) interval and (c) train an SVM to classify next year's epidemic status. (d) This process is repeated for all 432 (t0, p) intervals, and the top 11 models are automatically selected to (e) contribute to a majority voting system based on historical out-of-sample accuracy.
Figure 2.
Figure 2.
The 10 year (2008–2017) out-of-sample forecast accuracy (%) for each time window of temperature and precipitation, by the municipality. The x-axis (t0) indicates the start date of the time interval, and the y-axis (p) indicates the length of the time interval from which weather data were gathered (10–95 days). Models achieving at least 7/10 correct out-of-sample forecasts are shown in shades of yellow. Municipalities are ordered by decreasing ensemble prediction accuracy; that is, the proportion of years correctly forecast by the ensemble method over the years 2012–2017.
Figure 3.
Figure 3.
Weather-based prediction results for 120 municipality years. (a) Annual out-of-sample forecasts of outbreak status (epidemic/non-epidemic) for 20 Brazilian municipalities from 2012 to 2017, shaded by the mean posterior probability of the true outbreak status. Correct forecasts are indicated by a plus (+) sign, and cells with light shading indicate that the model predicted the class with low probability. Municipalities are ordered by decreasing ensemble prediction accuracy; that is, the proportion of years correctly forecast by the ensemble method over the years 2012–2017. (b) The number of total epidemic and non-epidemic years correctly forecast across 20 municipalities, by year. The dashed white line indicates the number correctly forecast after the incorporation of empirically observed dengue cycles. (c) The mean posterior class probability across municipalities, by year and epidemic status.
Figure 4.
Figure 4.
Periods of the year selected into the ensemble forecast model for 2012–2017, by the municipality. The x-axis (t0) indicates the start date of the time interval, and the y-axis (p) indicates the length of the time interval from which weather data were gathered (10–95 days). Municipalities with smaller and brighter yellow centres are those which exhibit the highest consistency in the predictive performance of weather patterns. Municipalities are ordered by decreasing ensemble prediction accuracy; that is, the proportion of years correctly forecast by the ensemble method over the years 2012–2017.

References

    1. Ford TE, Colwell RR, Rose JB, Morse SS, Rogers DJ, Yates TL. 2009. Using satellite images of environmental changes to predict infectious disease outbreaks. Emerg. Infect. Dis. 15, 1341-1346. (10.3201/eid/1509.081334) - DOI - PMC - PubMed
    1. Sewe MO, Tozan Y, Ahlm C, Rocklöv J. 2017. Using remote sensing environmental data to forecast malaria incidence at a rural district hospital in Western Kenya. Sci. Rep. 7, 2589. (10.1038/s41598-017-02560-z) - DOI - PMC - PubMed
    1. McGough SF, Brownstein JS, Hawkins JB, Santillana M. 2017. Forecasting Zika incidence in the 2016 Latin America outbreak combining traditional disease surveillance with search, social media, and news report data. PLoS Negl. Trop. Dis. 11, e0005295. (10.1371/journal.pntd.0005295) - DOI - PMC - PubMed
    1. Yang S, Santillana M, Kou SC. 2015. Accurate estimation of influenza epidemics using Google search data via ARGO. Proc. Natl Acad. Sci. USA 112, 14 473-14 478. (10.1073/pnas.1515373112) - DOI - PMC - PubMed
    1. Marques-Toledo CdA, Degener CM, Vinhal L, Coelho G, Meira W, Codeço CT, Teixeira MM. 2017. Dengue prediction by the web: tweets are a useful tool for estimating and forecasting Dengue at country and city level. PLoS Negl. Trop. Dis. 11, e0005729. (10.1371/journal.pntd.0005729) - DOI - PMC - PubMed

Publication types