. 2021 Jun 14;39(6):827-844.e10.
doi: 10.1016/j.ccell.2021.05.007.

STAG2 loss rewires oncogenic and developmental programs to promote metastasis in Ewing sarcoma

Affiliations

STAG2 loss rewires oncogenic and developmental programs to promote metastasis in Ewing sarcoma

Biniam Adane et al. Cancer Cell. .

Abstract

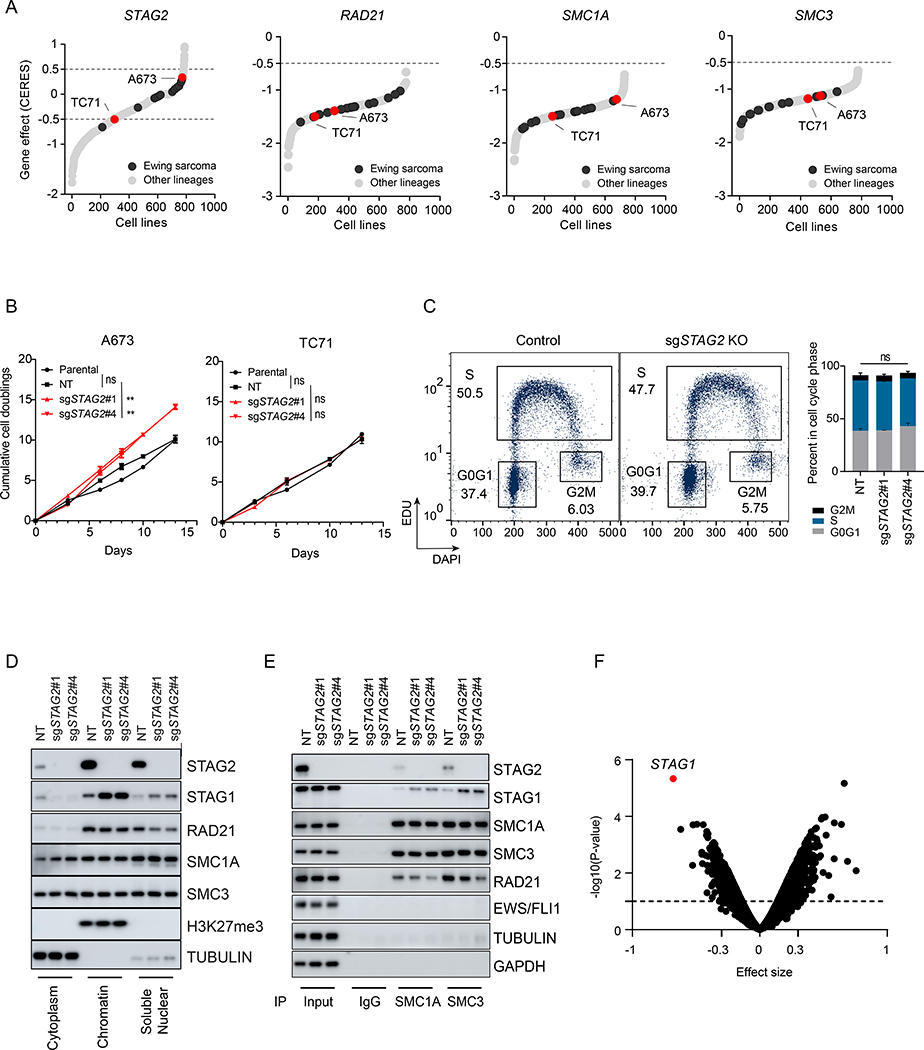
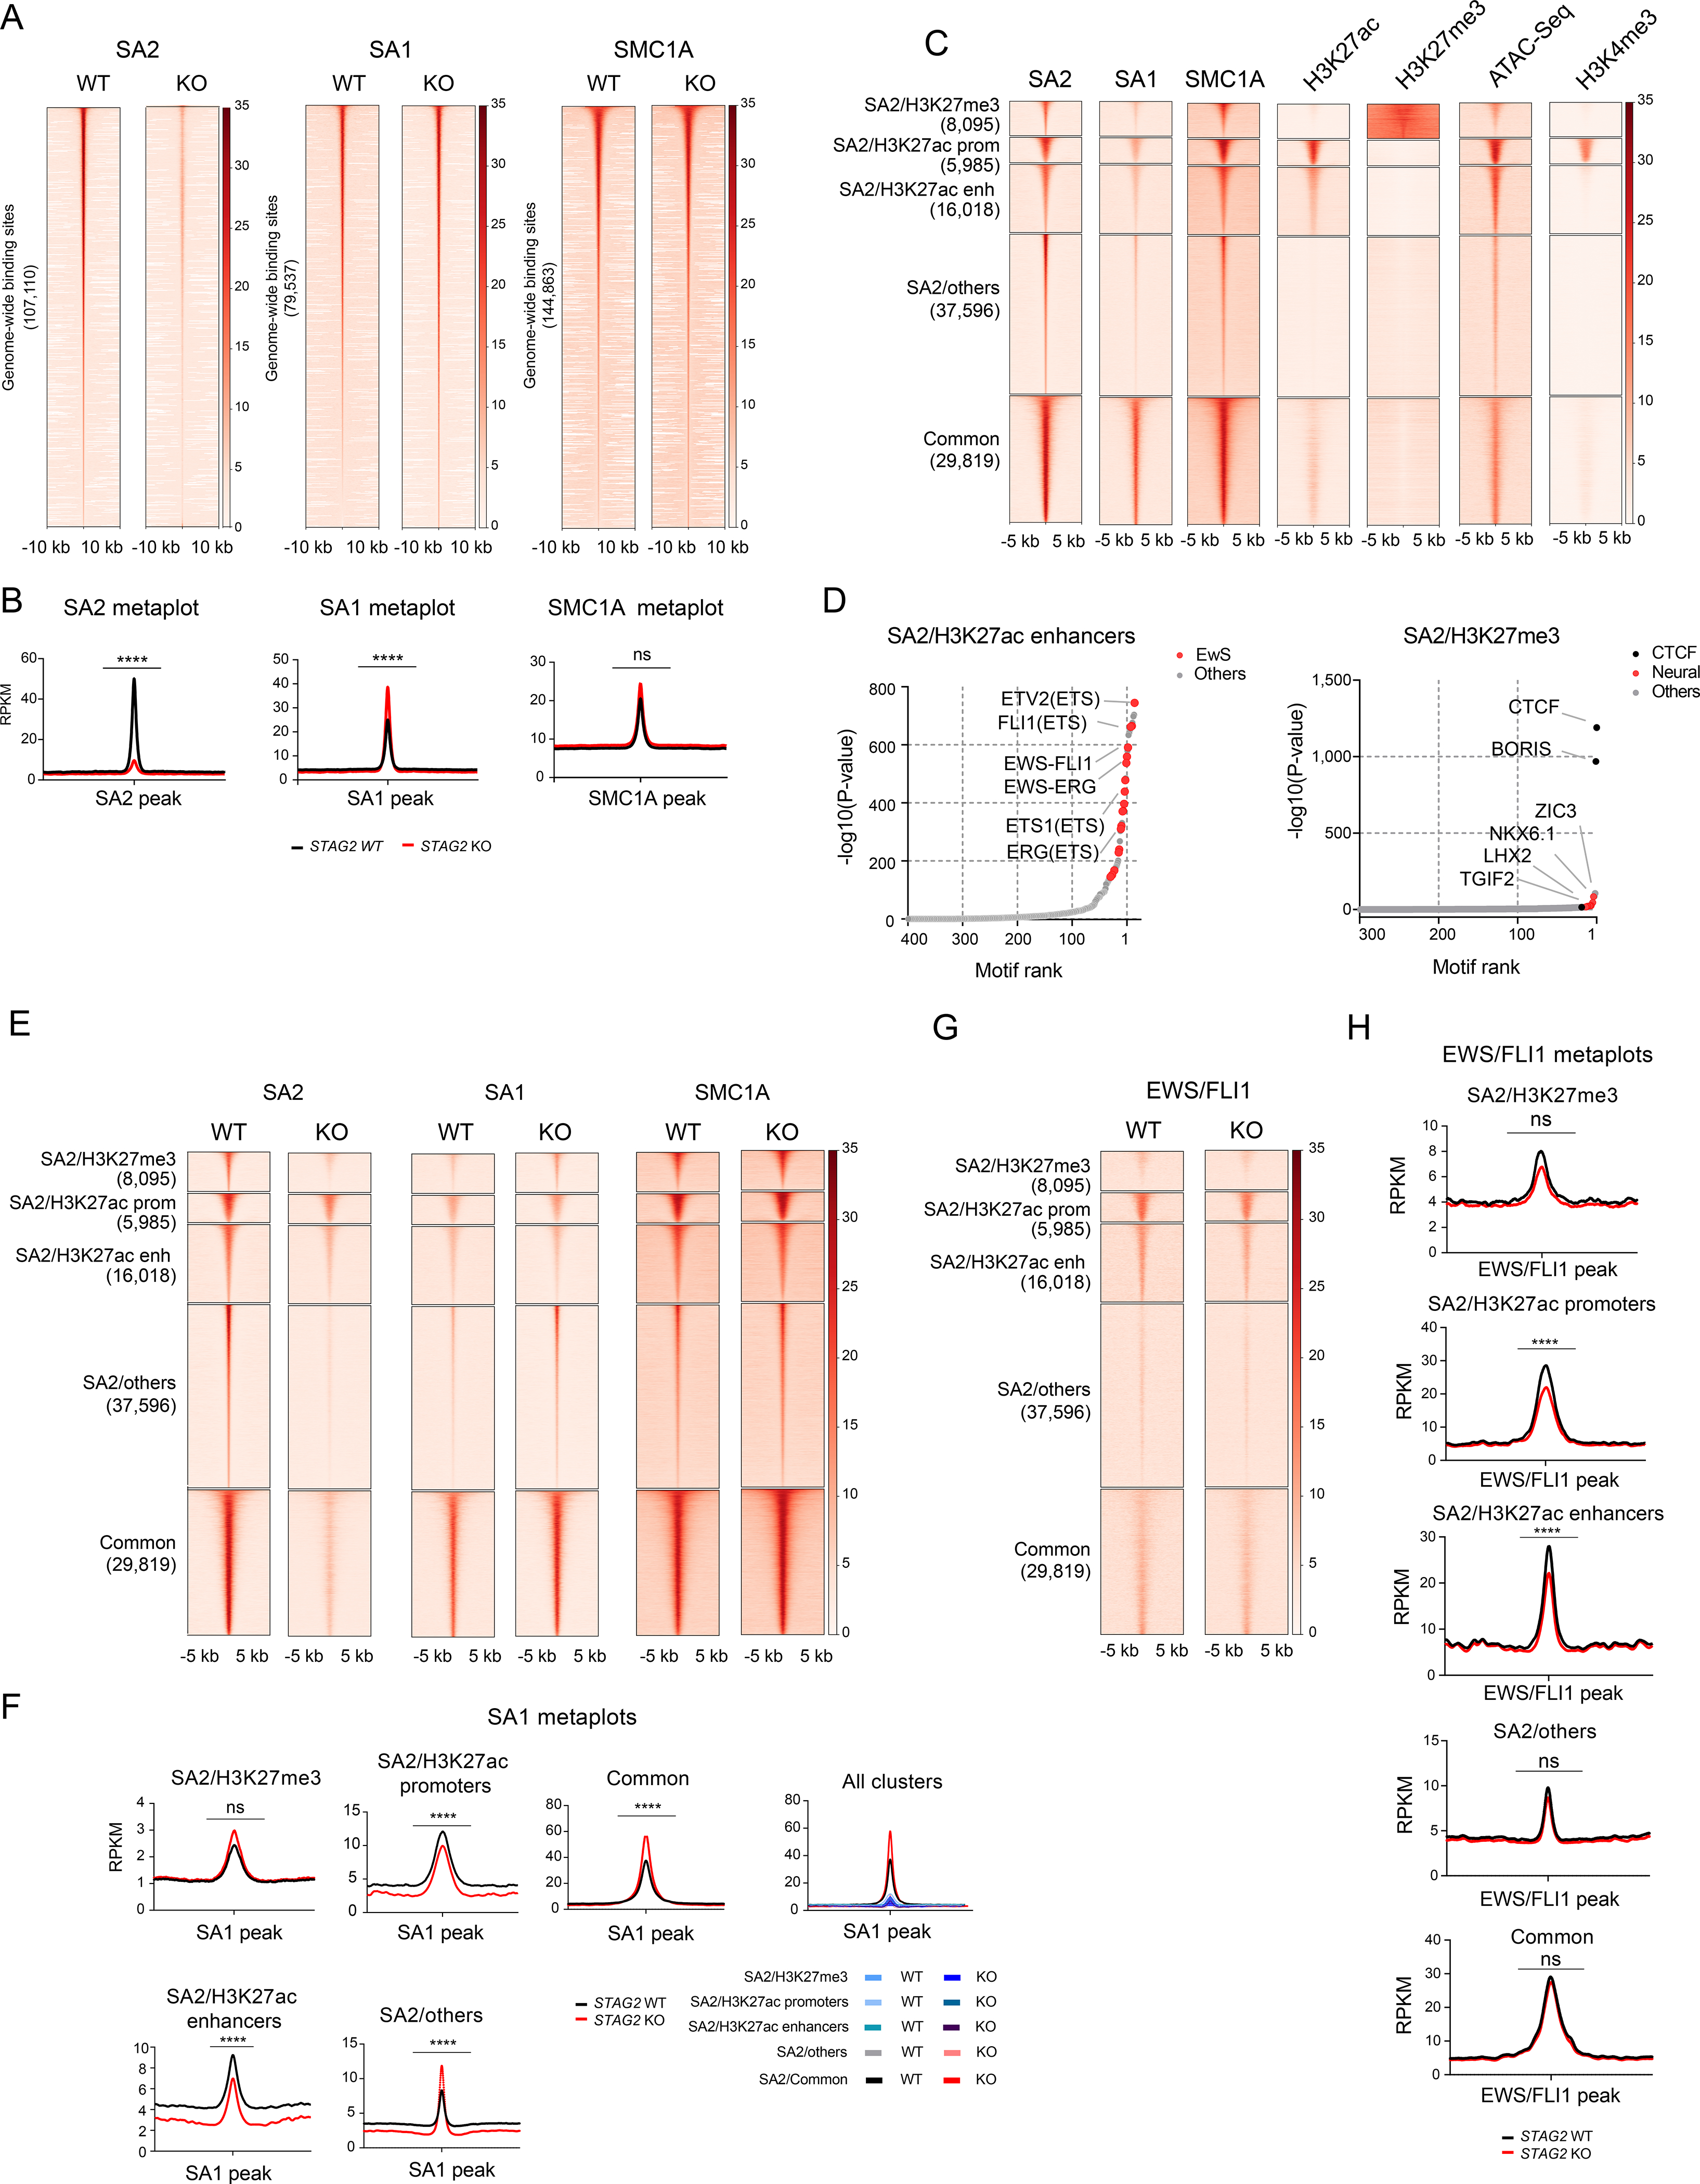
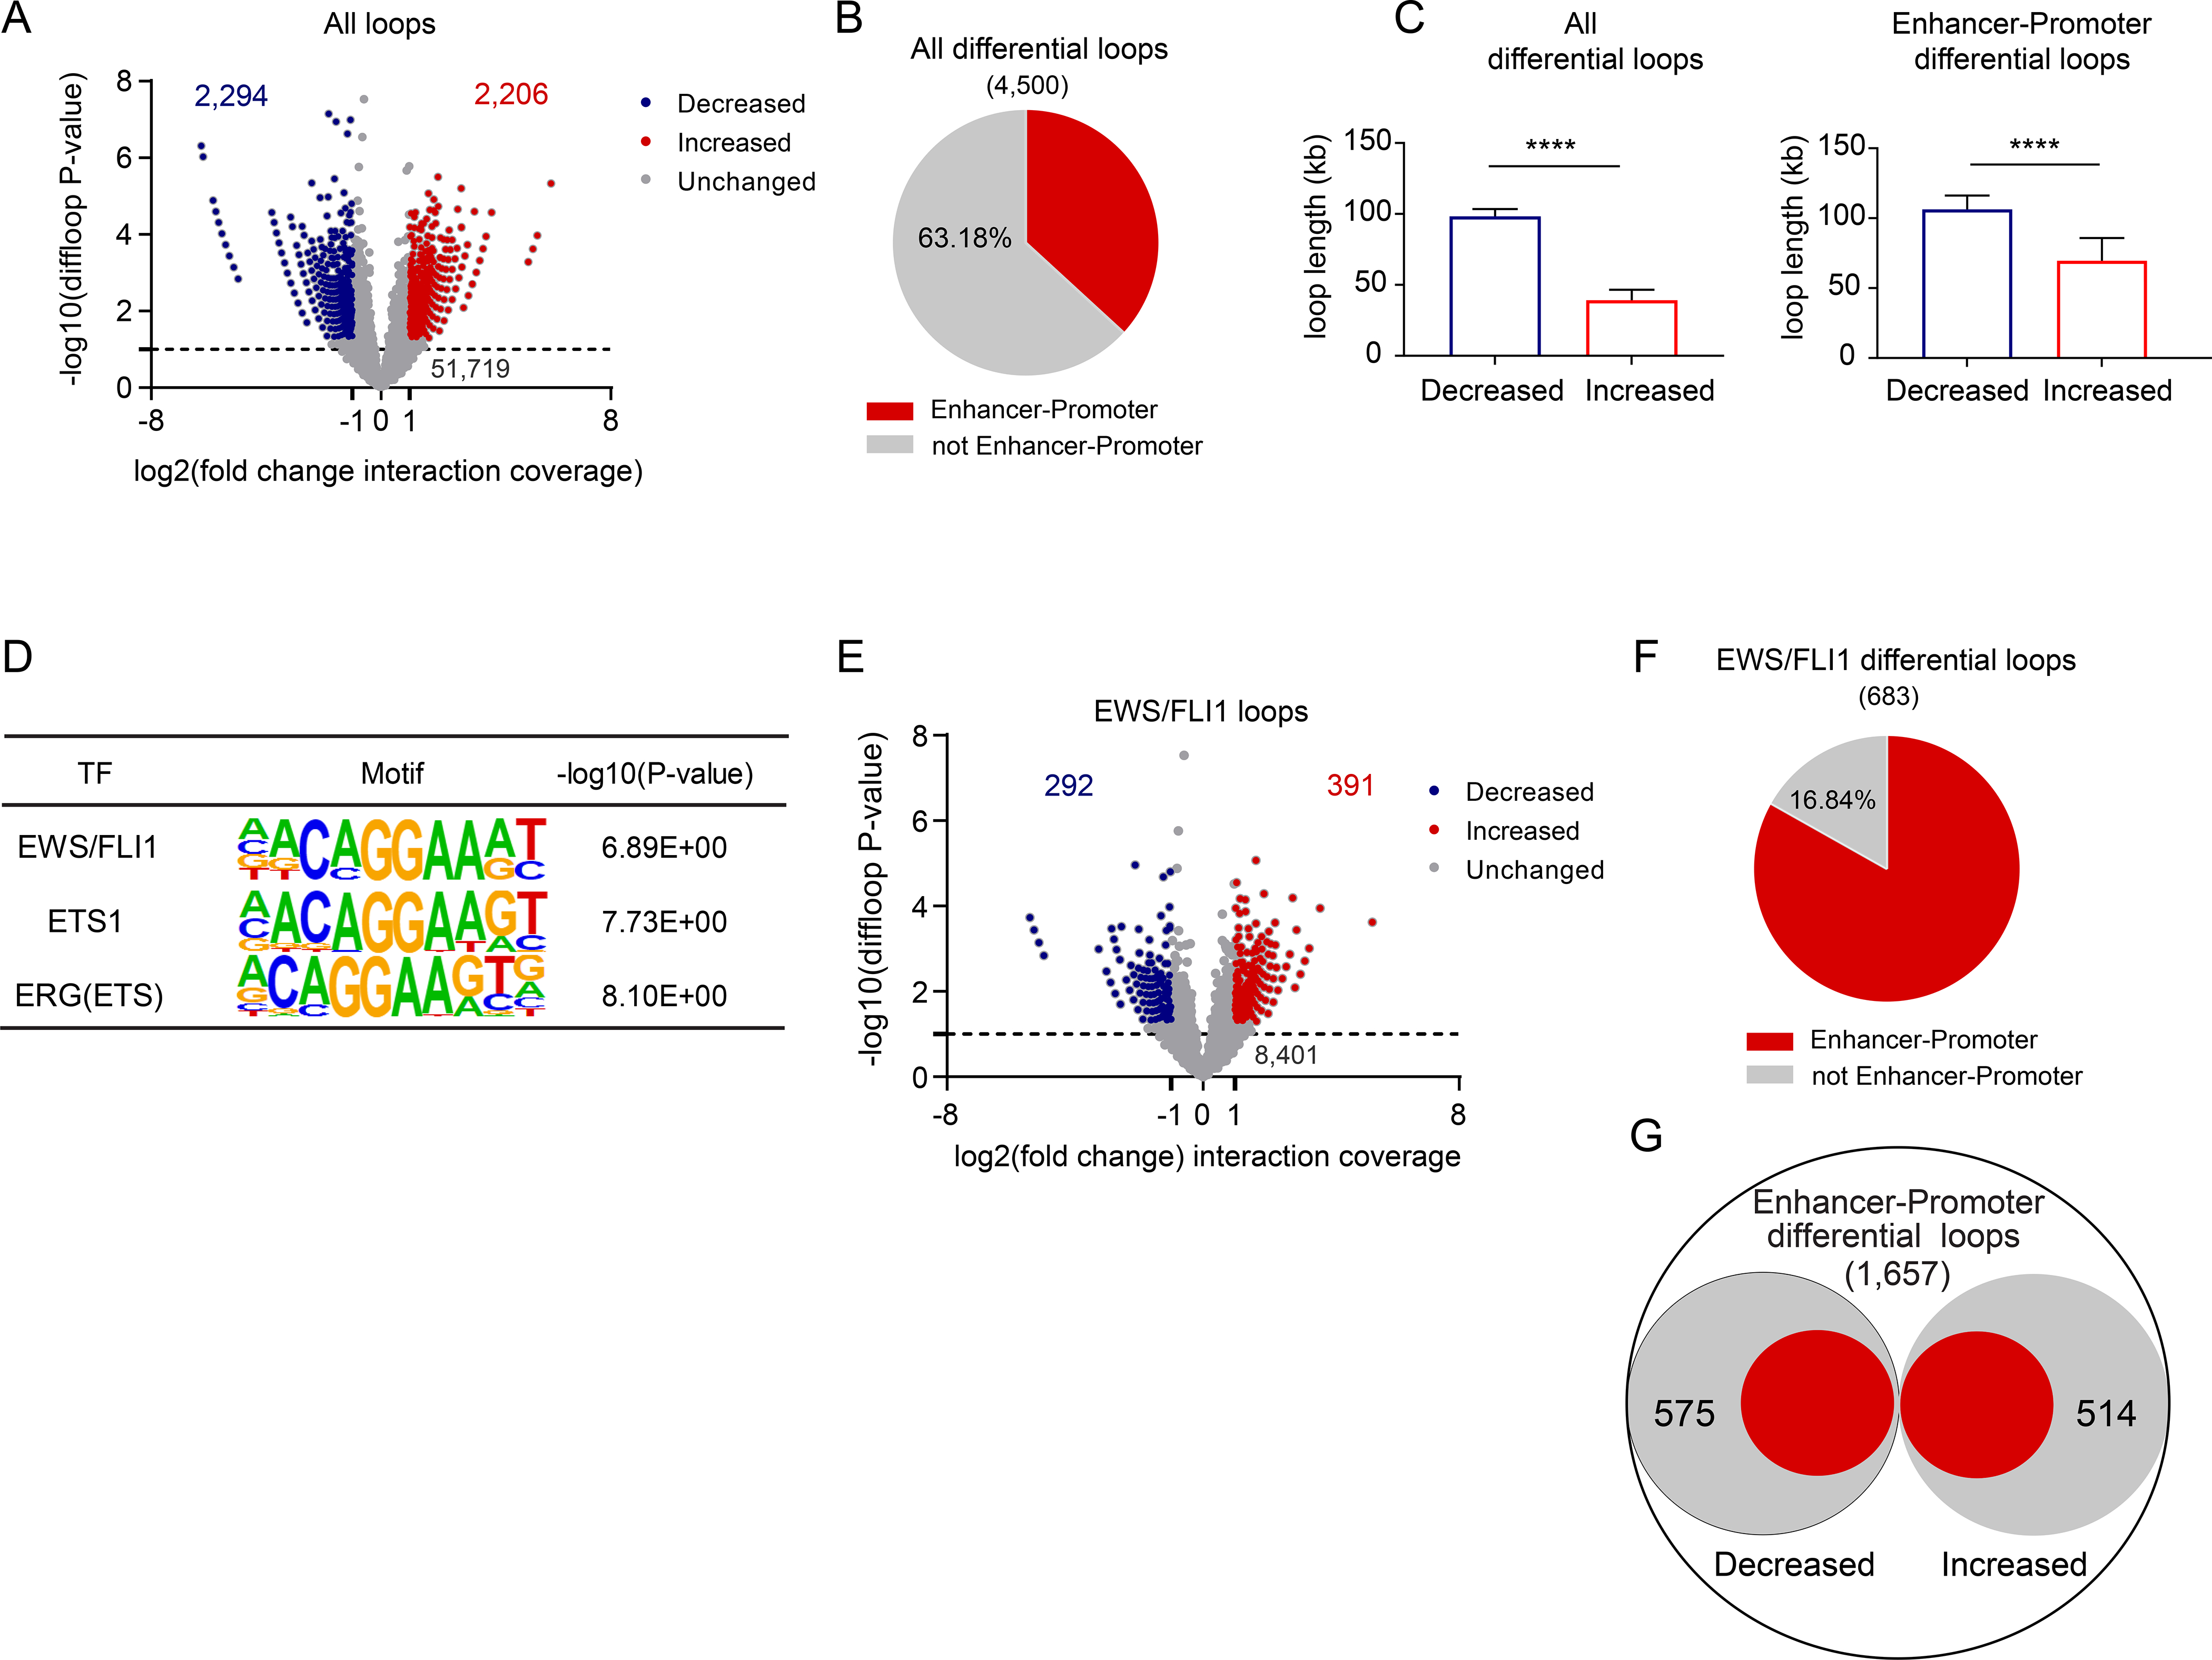
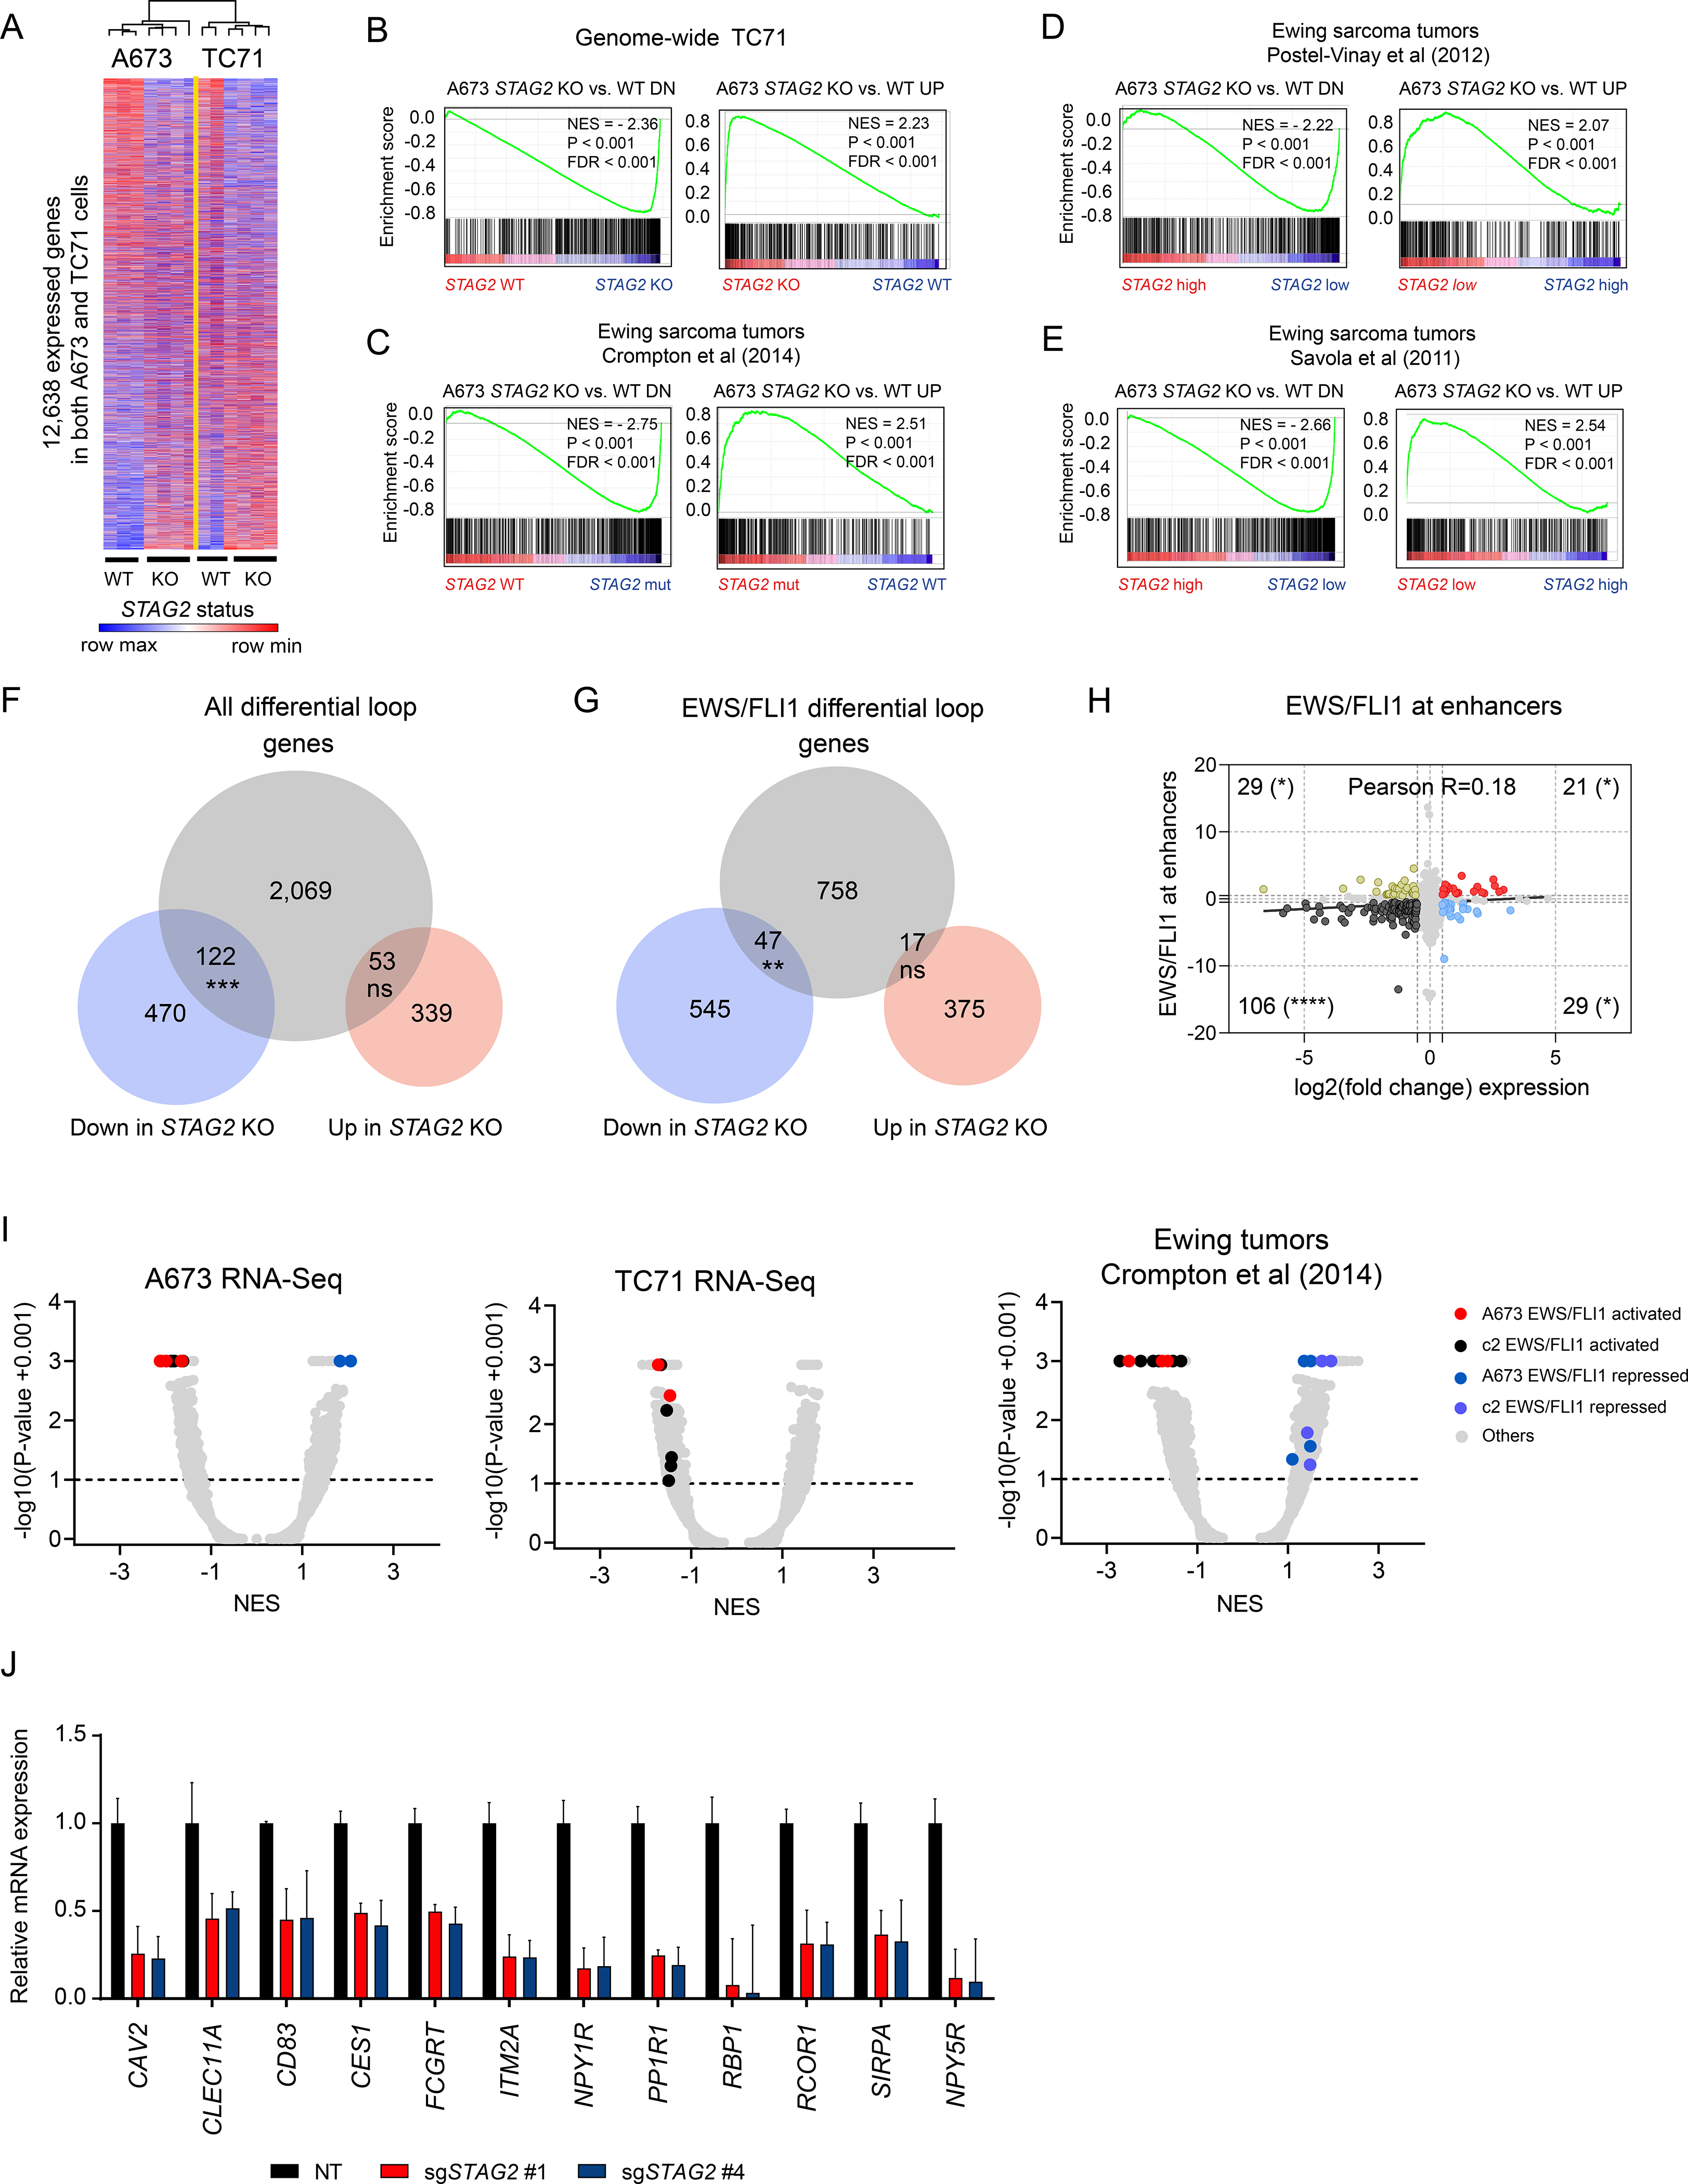
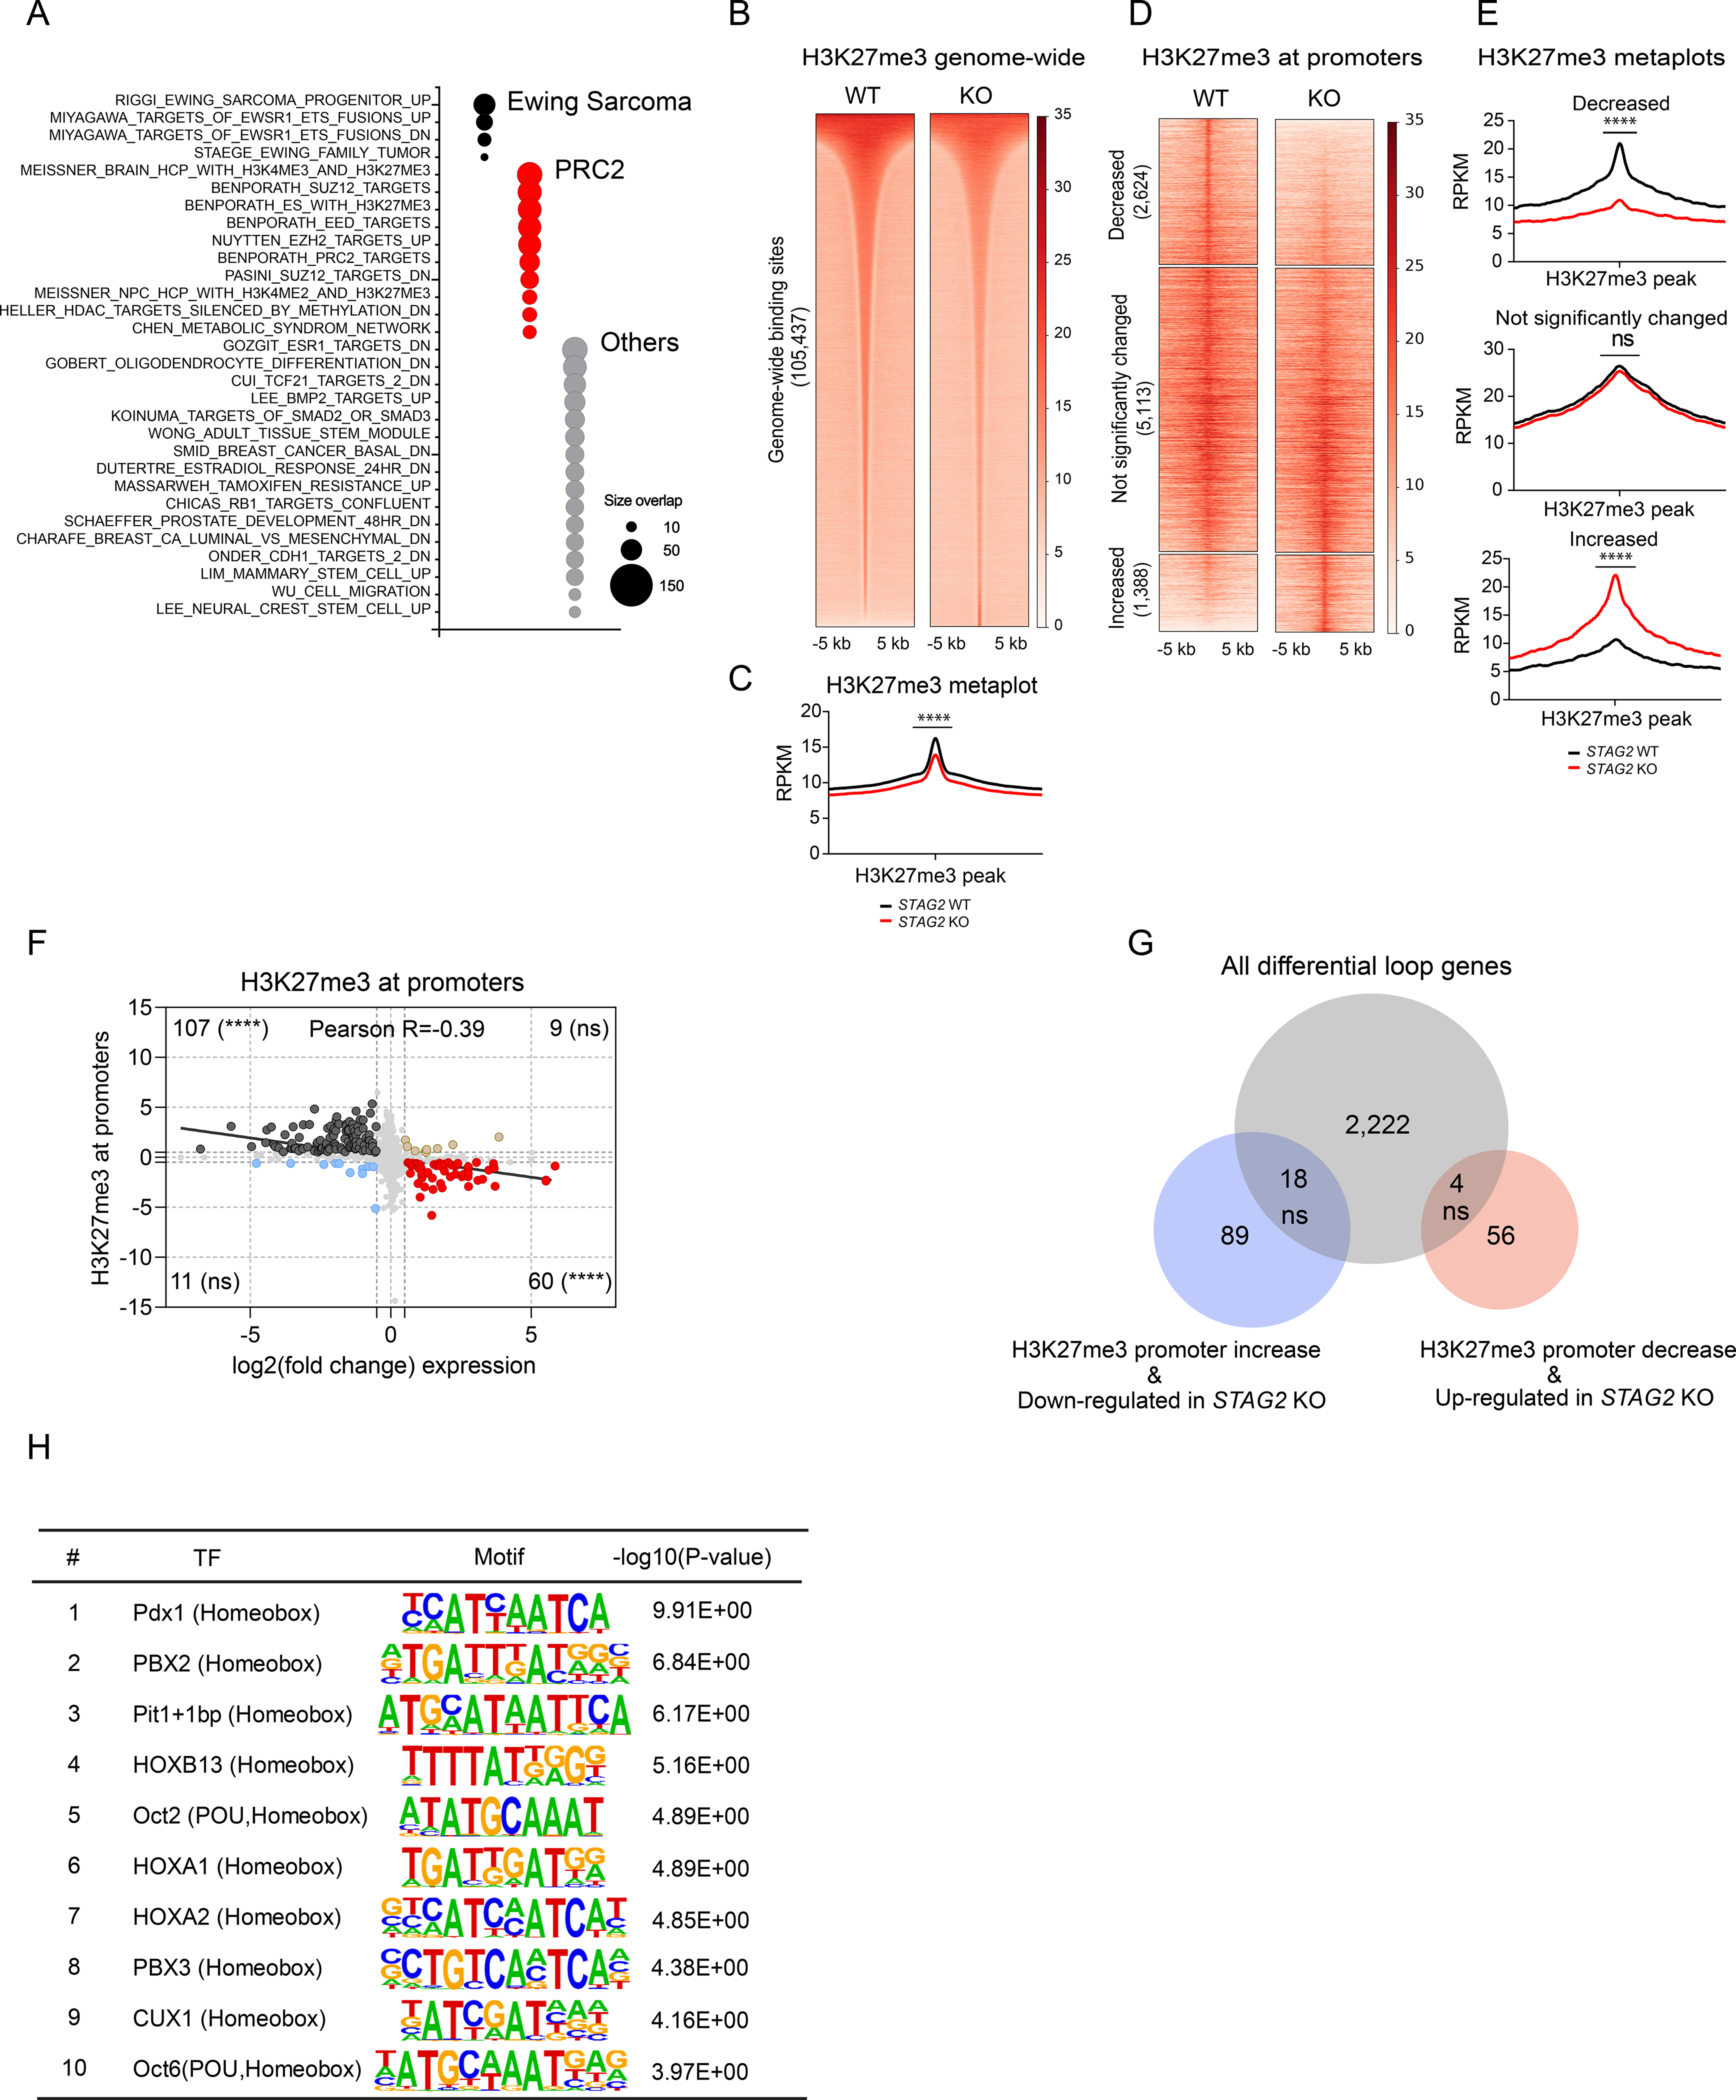
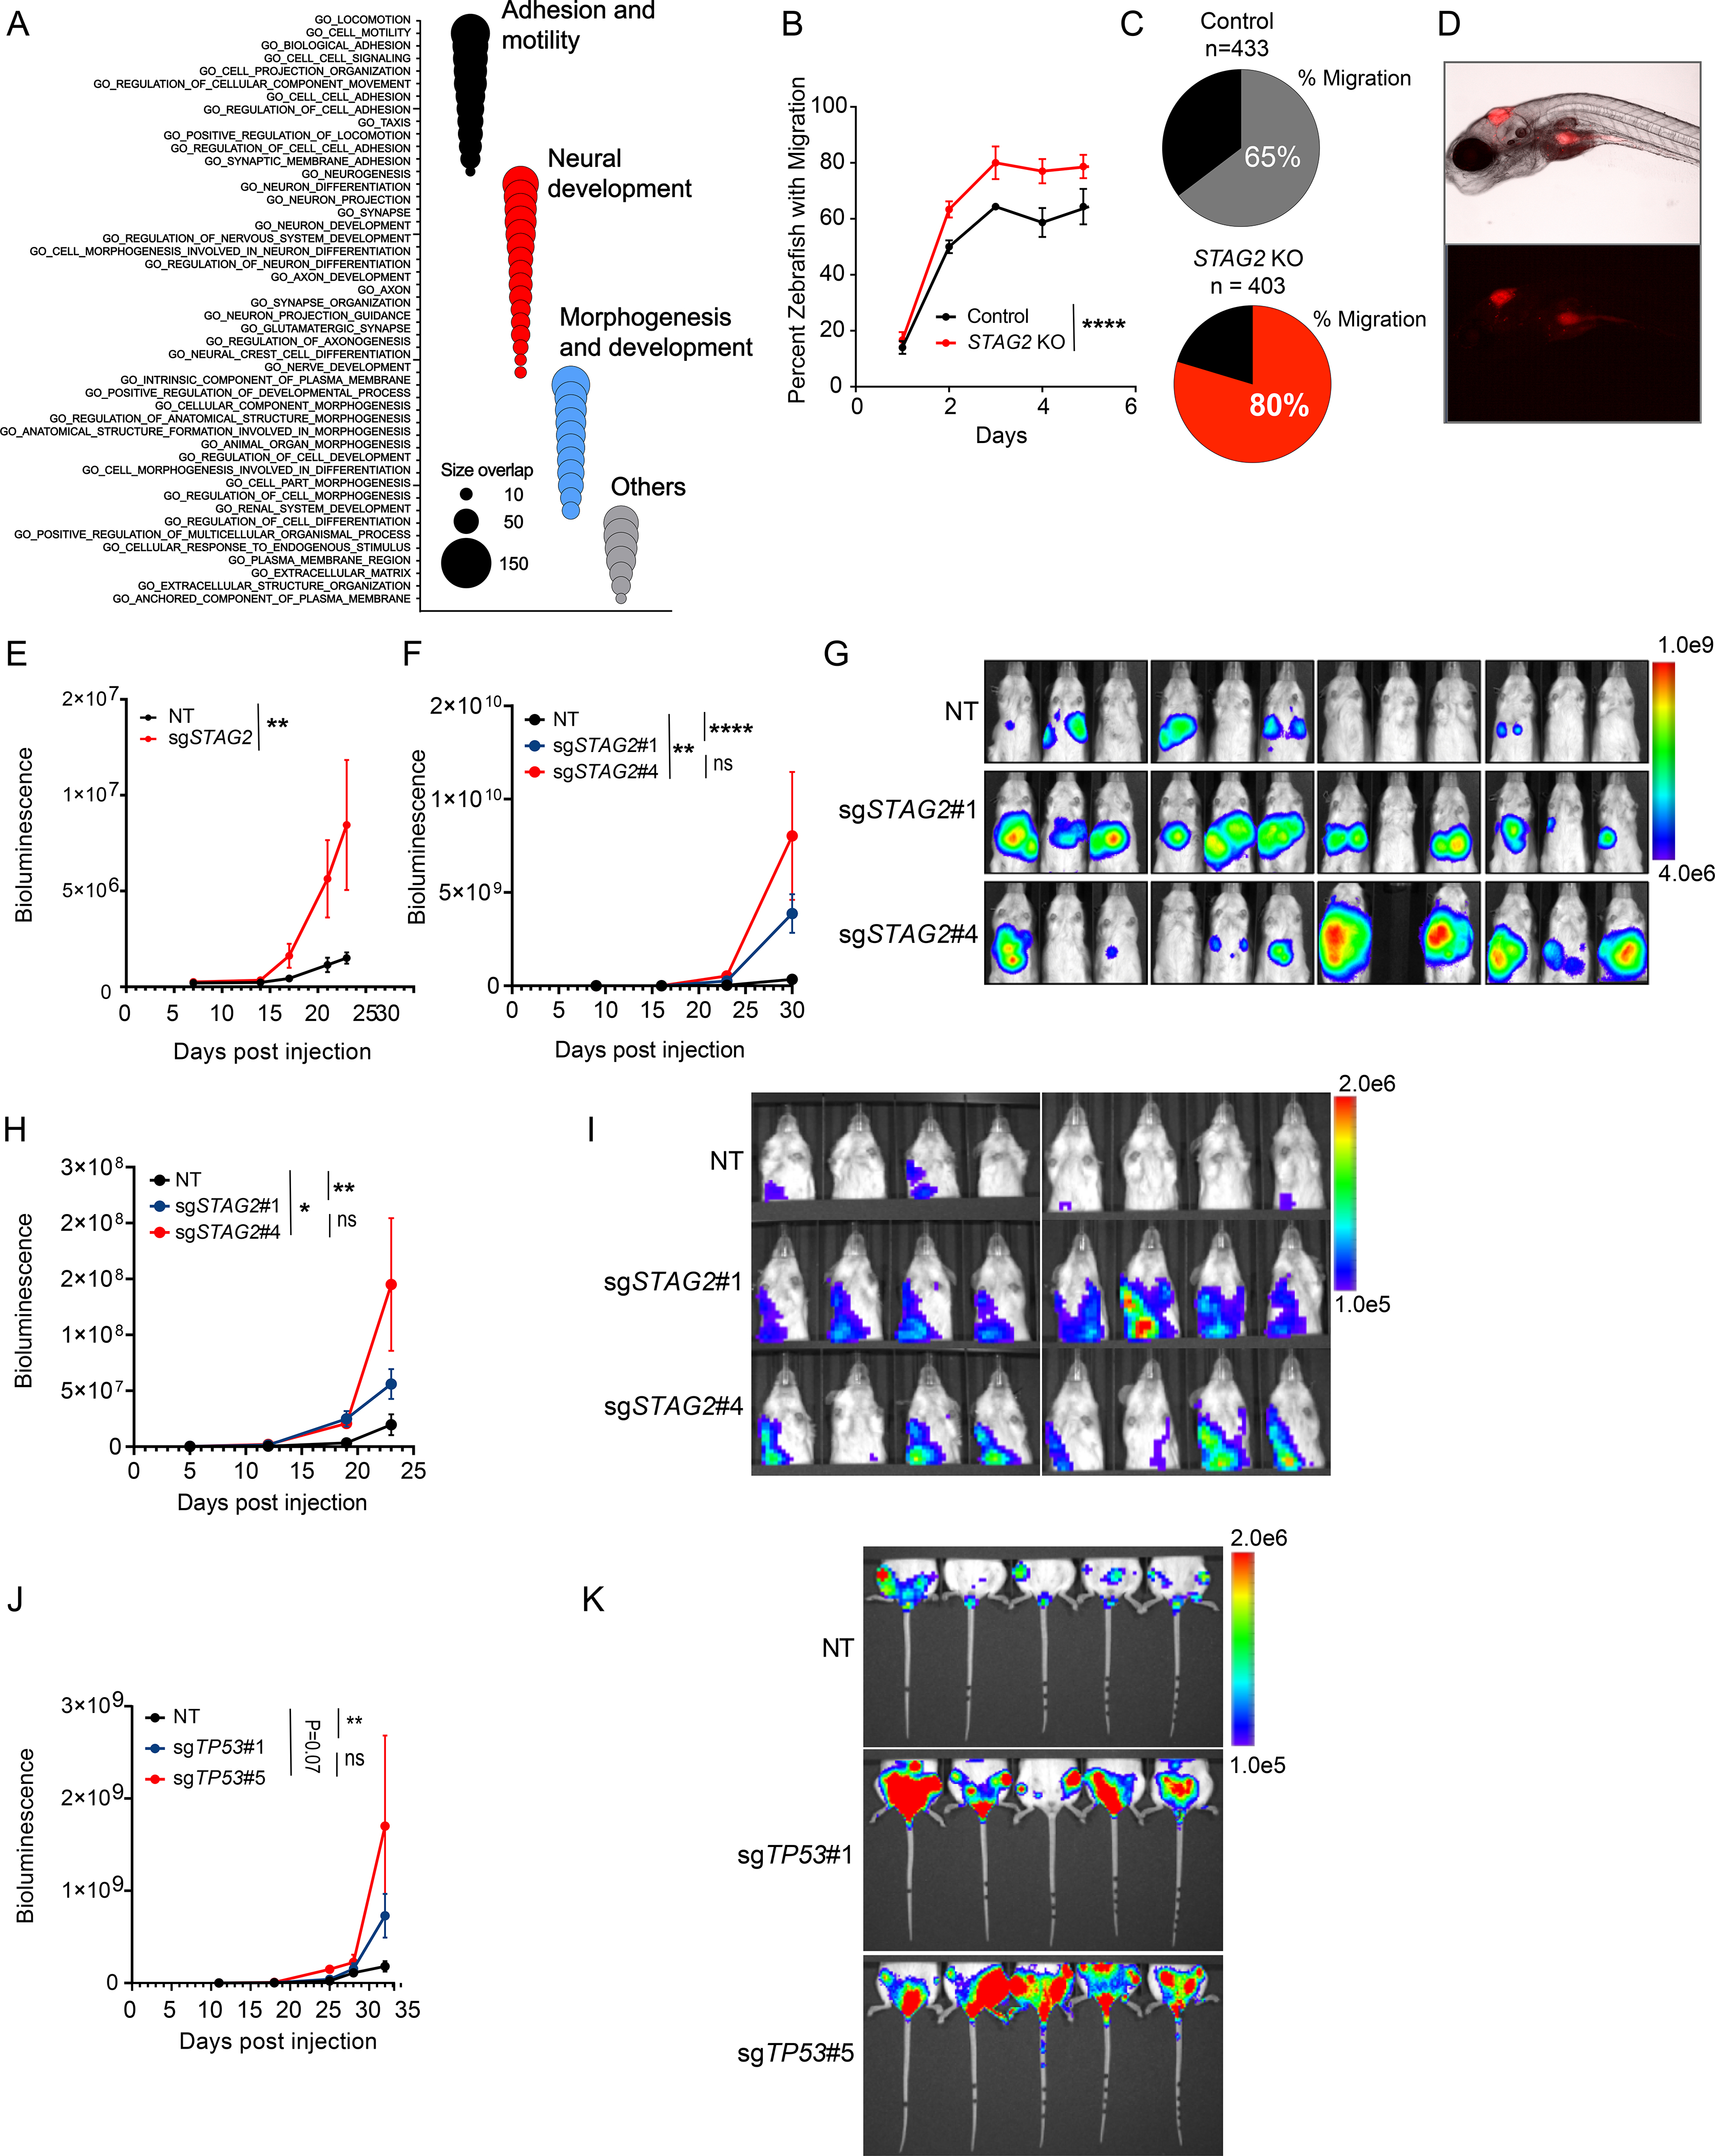
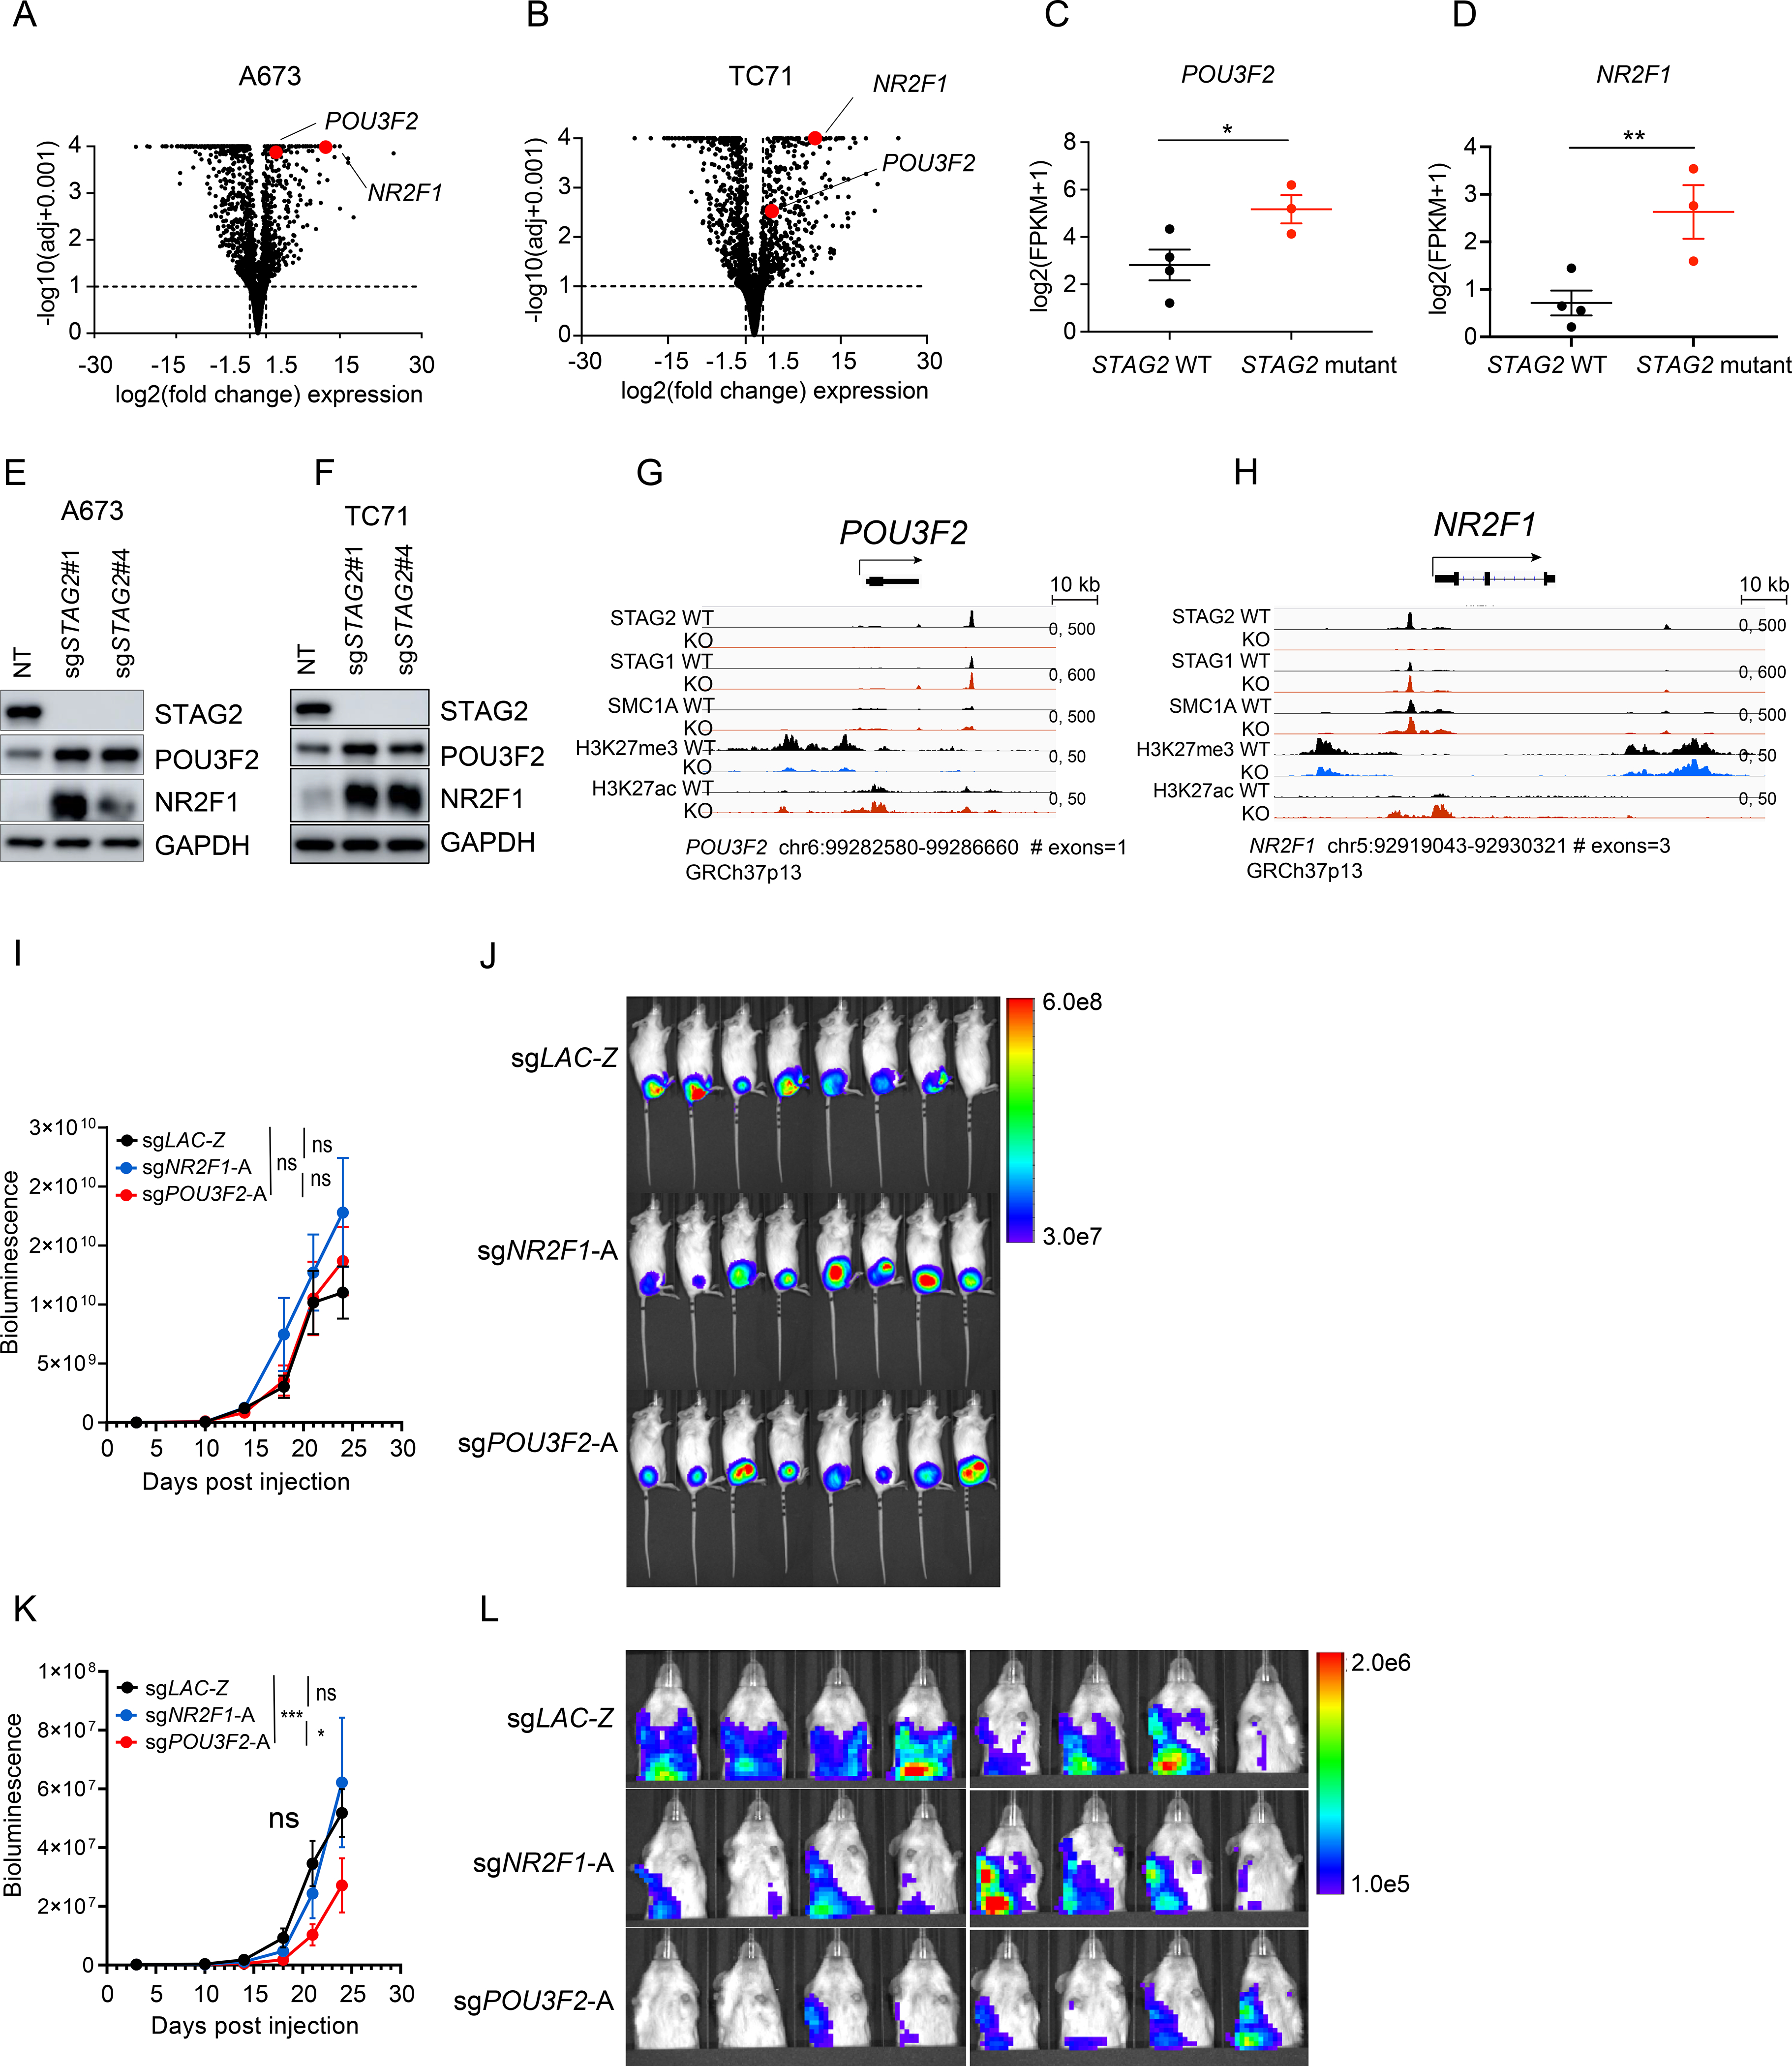
The core cohesin subunit STAG2 is recurrently mutated in Ewing sarcoma but its biological role is less clear. Here, we demonstrate that cohesin complexes containing STAG2 occupy enhancer and polycomb repressive complex (PRC2)-marked regulatory regions. Genetic suppression of STAG2 leads to a compensatory increase in cohesin-STAG1 complexes, but not in enhancer-rich regions, and results in reprogramming of cis-chromatin interactions. Strikingly, in STAG2 knockout cells the oncogenic genetic program driven by the fusion transcription factor EWS/FLI1 was highly perturbed, in part due to altered enhancer-promoter contacts. Moreover, loss of STAG2 also disrupted PRC2-mediated regulation of gene expression. Combined, these transcriptional changes converged to modulate EWS/FLI1, migratory, and neurodevelopmental programs. Finally, consistent with clinical observations, functional studies revealed that loss of STAG2 enhances the metastatic potential of Ewing sarcoma xenografts. Our findings demonstrate that STAG2 mutations can alter chromatin architecture and transcriptional programs to promote an aggressive cancer phenotype.

Keywords: EWS/FLI1; Ewing sarcoma; POU3F2; PRC2; STAG1; STAG2; cohesin; fusion oncoprotein; metastasis.


Conflict of interest statement

Declaration of interests None of the authors declare a conflict of interest for this project but report the following relationships. N.V.D. is a current employee of Genentech, Inc., a member of the Roche Group. R.A.Y. is a founder and shareholder of Syros Pharmaceuticals, Camp4 Therapeutics, Omega Therapeutics, and Dewpoint Therapeutics. M.J.A. has financial interests in Monitor Biotechnologies (formerly known as Beacon Genomics). K.S. receives grant funding as part of the DFCI/Novartis Drug Discovery Program, consults for and has stock options in Auron Therapeutics, and consulted for AstraZeneca and Kronos Bio. B.D.C. receives research funding from Gradalis for an unrelated project, and his spouse was previously employed by Shire and Mersana and currently works for Acceleron.

Figures

Figure 1.
Figure 1.. Loss of STAG2 does not consistently alter cell growth but changes the composition of the cohesin complex and renders cells sensitive to STAG1 deletion
(A) Hockey plots depicting the distribution of STAG2, SMC1A, SMC3 and RAD21 gene effect (CERES) scores across the 789 cell lines in CRISPR (Avana) Depmap v20Q3 data. (B) Line graphs showing mean ± sd of cumulative doublings for parental or clonally selected non-targeting (NT) or STAG2 KO A673 and TC71 cells. Pairwise comparative analysis for exponential growth fitted curves (extra-sum-of-squares F test, ** P < 0.01, ns=not significant). (C) EdU incorporation-based cell cycle profiling and a representative flow cytometry plots (left) are shown. Two independent experiments as mean ± sd barplots (right). 2-way ANOVA ns=not significant. (D-E) Sub-cellular fractionation (D) or Immunoprecipitation with SMC1A, SMC3 or IgG (E) followed by western blot was performed for the indicated proteins. (F) Genome-scale CRISPR/Cas9 screen in isogenic NT and STAG2 KO A673 clonal cells. Shown is the volcano plot for gene effect size vs. −log10(P-value) for the genome-wide differential analysis of isogenic NT vs. STAG2 KO processed reads; dots represent genes (limma eBayes for MAGeCK gene effect scores, effect size ≤ −0.3, adjusted P ≤ 0.10). See also Figure S1.
Figure 2.
Figure 2.. STAG2 occupies PRC2 and enhancer marked regions and its deletion is incompletely compensated by STAG1
(A) Genome-wide heatmaps of SA2, SA1 and SMC1A ChIP-Seq peak centered signal in A673 cells expressing WT or KO STAG2. Regions are ranked based on WT signal. (B) Read density metaplots showing average RPKM normalized signal for SA2, SA1 and SMC1A in WT (black) and STAG2 KO (red) A673 cells. Differential read density in KO vs. WT conditions (unpaired t-test with Welch’s correction, **** P < 0.0001, ns = not significant). (C) Clustered heatmaps of ChIP-Seq peak centered signal for SA2, SA1, SMC1A, H3K27ac, H3K27me3, chromatin accessibility (ATAC-Seq) and H3K4me3. Cluster regions are ranked by SA2 signal. (D) Hockey plots depicting motifs enriched in SA2/H3K27ac enhancers and SA2/H3K27me3 regions defined in Figure 2C. (E) Clustered heatmaps depicting SA2, SA1 and SMC1A signal in the cohesin regions defined in Figure 2C in control and STAG2 KO A673 cells. (F) Metaplots showing average SA1 signal in the cohesin regions defined in Figure 2C. Differential read density in KO vs. WT conditions (unpaired t-test with Welch’s correction, **** P < 0.0001, ** P < 0.01). (G) Clustered heatmap depicting EWS/FLI1 signal in cohesin regions defined in Figure 2C in control and STAG2 KO A673 cells. (H) Metaplot showing average EWS/FLI1 signal in cohesin regions defined in Figure 2C. Differential read density in KO vs. WT (unpaired t-test with Welch’s correction, **** P < 0.0001, ** P < 0.01). See also Figure S2.
Figure 3.
Figure 3.. Loss of STAG2 alters the frequency of cis-chromatin contacts
(A) Volcano plot of changes in chromatin loop strength comparing STAG2 WT to KO A673 cells based on SMC1A Hi-ChIP (edgeR over-dispersed Poisson regression, |(FC)|≥2, P≤ 0.05). (B) Pie chart depicting the fraction of differential loops involving enhancer-promoter interactions (two-tailed Fisher exact test, **** P < 0.0001). (C) Median + 95% confidence interval plots for lengths of differential loops (unpaired t-test with Welch correction, **** P < 0.0001). (D) Three of the top 10 enriched motifs for the enhancer regions involved in differential enhancer-promoter loops. (E) Volcano plot depicting the differential status of the 9,084 EWS/FLI1 anchored differential loops (edgeR over-dispersed Poisson regression, |fold change| ≥ 2, P ≤ 0.05). (F) Pie chart depicting the fraction of EWS/FLI1 anchored differential loops involving enhancer-promoter interactions. Two-tailed Fisher exact test, **** P < 0.0001. (G) Diagram depicting the fraction of EWS/FLI1 anchored enhancer-promoter interactions as a subset of all differential enhancer-promoter loops. Two-tailed Fisher exact test **** P < 0.0001. See also Figure S3, Tables S1 and S2.
Figure 4.
Figure 4.. Loss of STAG2 alters the EWS/FLI1 driven oncogenic transcriptional program
(A) Heatmap and average linkage dendrogram of genome-wide gene expression, log2(normalized counts), in STAG2 KO vs. WT A673 and TC71 cells. (B-E) GSEA plots demonstrating the enrichment of the STAG2 KO vs. WT gene signature for A673 cells in the genome-wide expression changes induced by STAG2 KO in TC71 cells (B) or in three distinct Ewing sarcoma primary patient tumor datasets (C-E). Normalized enrichment score, P-value and FDR are indicated in each plot. (F) Venn diagram depicting the overlap between differentially expressed genes with genes harboring a differential loop within 5kb of their TSS. (Two-tailed Fisher exact test, *** P < 0.001, ns = not significant). (G) Similar analysis as in (F) is shown for EWS/FLI1 anchored differential loops (Two-tailed Fisher exact test, ** P < 0.01, ns = not significant). (H) Scatter plot depicting the overlap between gene expression change and EWS/FLI1 binding at the nearest enhancer assessed by ChIP-seq. Two-tailed Fisher exact test (**** P < 0.0001, * P < 0.05). (I) Volcano plots for GSEA enrichment scores for the genome-wide expression changes induced in A673 and TC71 and by STAG2 mutant vs. STAG2 WT tumor samples from (Crompton et al., 2014) vs. the union of a collection of 12 EWS/FLI1 public gene signatures in A673 cells and MSigDB v7.1 c2 pathways (5,529 gene sets). (J) RT-QPCR based validation of a subset of EWS/FLI1 target genes repressed in STAG2 KO relative to control A673 cells. Data shown as mean ± SD. See also Figure S4 and Table S3.
Figure 5.
Figure 5.. Loss of STAG2 perturbs PRC2-mediated regulation of gene expression
(A) Bubble plot summarizing top 50 significant enrichments (size overlap≥25, P≤0.05, FDR≤0.05) for the MSigDB v7.1 c2 collection. Enriched gene sets are clustered in representative functional categories. (B) Genome-wide heatmaps of H3K27me3 ChIP-Seq signal in A673 cells expressing WT or STAG2 KO centered on significant peaks identified in either or both conditions. (C) Metaplots showing average genome-wide H3K27me3 signal in STAG2 KO and WT A673 cells. (unpaired t-test with Welch’s correction, **** P < 0.0001). (D) Clustered heatmaps depicting TSS +/− 5kb promoter regions with decreased, not significantly changed, or increased H3K27me3 ChIP-Seq binding in STAG2 KO vs. WT A673 cells (|Delta(area under curve signal)| ≥ 1.5). (E) Metaplots showing average H3K27me3 signal in the promoter regions defined in Figure 5C. Differential read density for STAG2 KO vs. WT A673 within clusters (unpaired t-test with Welch’s correction, **** P< 0.0001, ns = not significant). (F) Scatter plot depicting the overlap between the genes with significant change for H3K27me3 ChIP-Seq binding at promoter regions with differentially expressed genes. Two-tailed Fisher exact test, **** P < 0.0001, ns = not significant. (G) Venn diagram showing the overlap between the subset of genes with concurrent changes in expression and H3K27me3 levels at the promoter (shown in Figure 5F) with the total list of genes harboring a differential loop within 5kb of the TSS. Two-tailed Fisher exact test, ns = not significant. (H) List of top 10 enriched motifs at the promoters of genes with altered H3K27me3 levels in STAG2 KO cells. See also Figure S5, Tables S5 and S6.
Figure 6.
Figure 6.. Depletion of STAG2 enhances the migration and metastatic potential of Ewing sarcoma cells
(A) Bubble plot summarizing top 50 significant enrichments (size overlap≥10, P≤0.05, FDR≤0.05) for the MSigDB v7.1 c5 collection. Enriched gene sets are clustered in representative functional categories. (B) Line graph represents mean ± sd of the percentage of zebrafish that displayed migration to at least one of the three regions of interest as a function of the days post injection. (2-way ANOVA, **** P < 0.0001). (C) Pie chart showing the percentage of zebrafish with migration of Ewing cells to at least one of the three sites examined three days post injection. (D) Representative brightfield (top) and fluorescence (541/565 nm bottom) images displaying migration of TC71 cells to the yolk sack. (E) Quantification of bioluminescence signal collected for lower extremities after blocking upper abdominal cavity. Line graph represents mean ± SEM, N = 8 per group. (2-way ANOVA, ** P<0.001). (F) Quantification of bioluminescence signal collected for upper thoracic cavity after blocking lower abdomen. Line graph represents mean ± SEM, N = 12 per group (2-way ANOVA, **** P < 0.0001,** P < 0.01, ns = not significant). (G) Bioluminescence images of mice described in Figure 6F. (H) Quantification of bioluminescence signal collected for upper thoracic cavity while blocking lower abdomen. Line graph represents mean ± SEM, N = 8 per group. (2-way ANOVA, **** P 0.0001,** P < 0.01, ns=not significant). (I) Bioluminescence images of mice described in Figure 6H. (J) Quantification of bioluminescence signal collected for lower extremities after blocking upper abdominal cavity. Line graph represents mean ± SEM, N = 5 per group. (2-way ANOVA, ** P < 0.01, ns = not significant). (K) Bioluminescence images of mice described in Figure 6J. See also Figure S6 and Table S7.
Figure 7.
Figure 7.. The neurodevelopmental transcription factor POU3F2 modulates the metastatic potential of STAG2 KO Ewing sarcoma cells
(A-B) Volcano plot depicting the transcriptional changes induced by STAG2 KO vs. control in (A) A673 and (B) TC71 cells. POU3F2 and NR2F1 are highlighted in red. Significance cutoffs: |log2(FC)| ≥ 1.5, adjusted P ≤ 0.10). (C-D) Scatter dot plot depicting the mean ± SEM mRNA log2(FPKM+1) expression of (C) POU3F2 and (D) NR2F1 in three STAG2 mutant tumors vs. the top four STAG2 WT tumors with highest STAG2 expression from (Crompton et al., 2014) data. Mann-Whitney non-parametric t-test (** P < 0.001, * P < 0.05). (E-F) Validation of an increase in POU3F2 and NR2F1 protein levels in (E) A673 and (F) TC71 cells clonally selected for STAG2 loss. (G-H) Integrated genomics viewer track showing SA2, SA1, SMC1, H3K27me3 and H3K27ac signals at the (G) POU3F2 and (H) NR2F1 locus in control and STAG2 KO A673 cells. (I) Quantification of bioluminescence signal for whole body. Line graph represents mean ± SEM, N = 8 per group (2-way ANOVA, ns = not significant). (J) Bioluminescence images of mice described in Figure 7I. (K) Quantification of bioluminescence signal for upper thoracic cavity after blocking the primary tumor at the lower abdomen. Line graph represents mean SEM, N = 8 per group (2-way ANOVA, *** P < 0.001, * P < 0.05, ns = not significant). (L) Bioluminescence images of mice described in Figure 7K. See also Figure S7.

References

    1. Aguirre AJ, Meyers RM, Weir BA, Vazquez F, Zhang CZ, Ben-David U, Cook A, Ha G, Harrington WF, Doshi MB, et al. (2016). Genomic Copy Number Dictates a Gene-Independent Cell Response to CRISPR/Cas9 Targeting. Cancer discovery 6, 914–929. - PMC - PubMed
    1. Armentano M, Chou SJ, Tomassy GS, Leingartner A, O’Leary DD, and Studer M (2007). COUP-TFI regulates the balance of cortical patterning between frontal/motor and sensory areas. Nat Neurosci 10, 1277–1286. - PubMed
    1. Armentano M, Filosa A, Andolfi G, and Studer M (2006). COUP-TFI is required for the formation of commissural projections in the forebrain by regulating axonal growth. Development 133, 4151–4162. - PubMed
    1. Aynaud MM, Mirabeau O, Gruel N, Grossetete S, Boeva V, Durand S, Surdez D, Saulnier O, Zaidi S, Gribkova S, et al. (2020). Transcriptional Programs Define Intratumoral Heterogeneity of Ewing Sarcoma at Single-Cell Resolution. Cell Rep 30, 1767–1779 e1766. - PubMed
    1. Balbas-Martinez C, Sagrera A, Carrillo-de-Santa-Pau E, Earl J, Marquez M, Vazquez M, Lapi E, Castro-Giner F, Beltran S, Bayes M, et al. (2013). Recurrent inactivation of STAG2 in bladder cancer is not associated with aneuploidy. Nat Genet 45, 1464–1469. - PMC - PubMed

Publication types

MeSH terms