

Synthesis and pharmacological evaluation of pomalidomide derivatives useful for sickle cell disease treatment
- PMID: 34130111
- PMCID: PMC8387409
- DOI: 10.1016/j.bioorg.2021.105077
Synthesis and pharmacological evaluation of pomalidomide derivatives useful for sickle cell disease treatment
Abstract
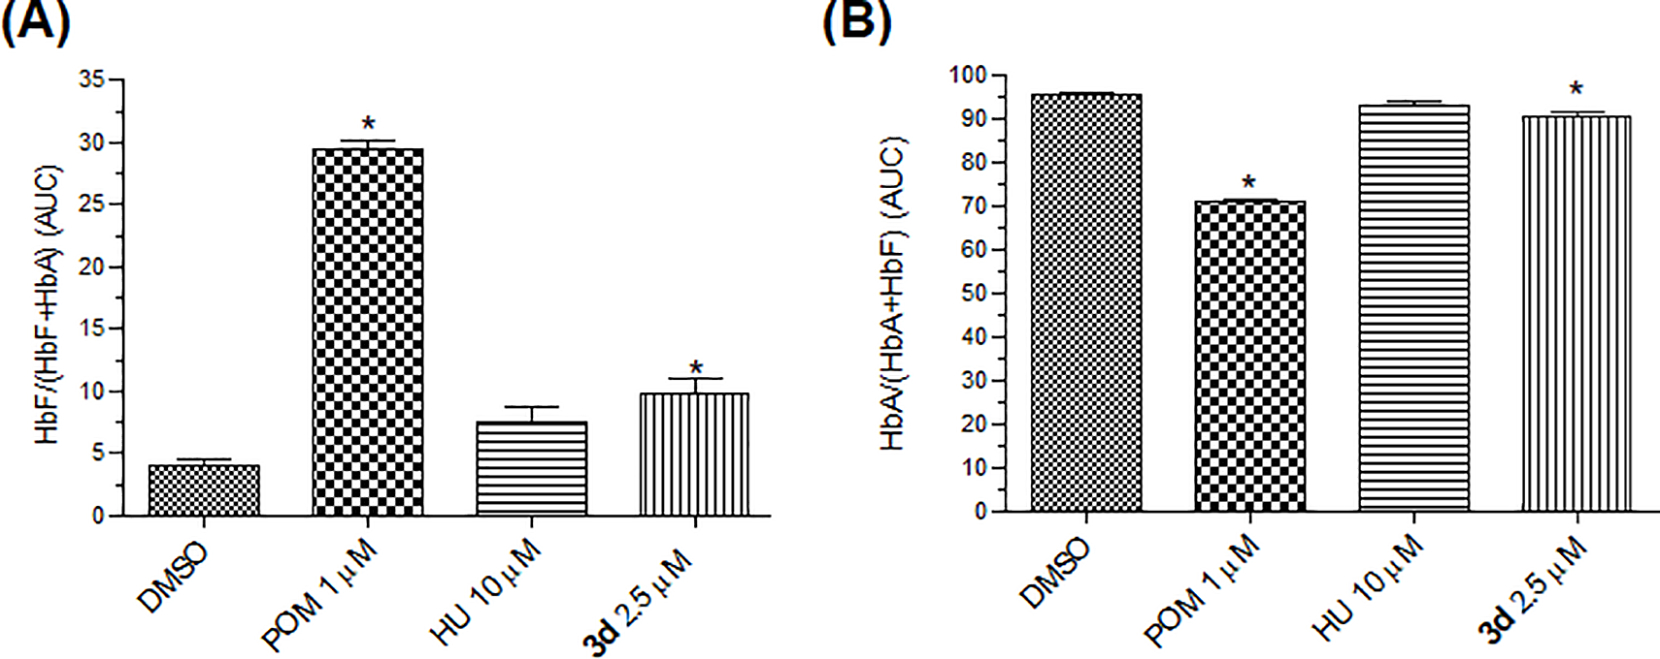
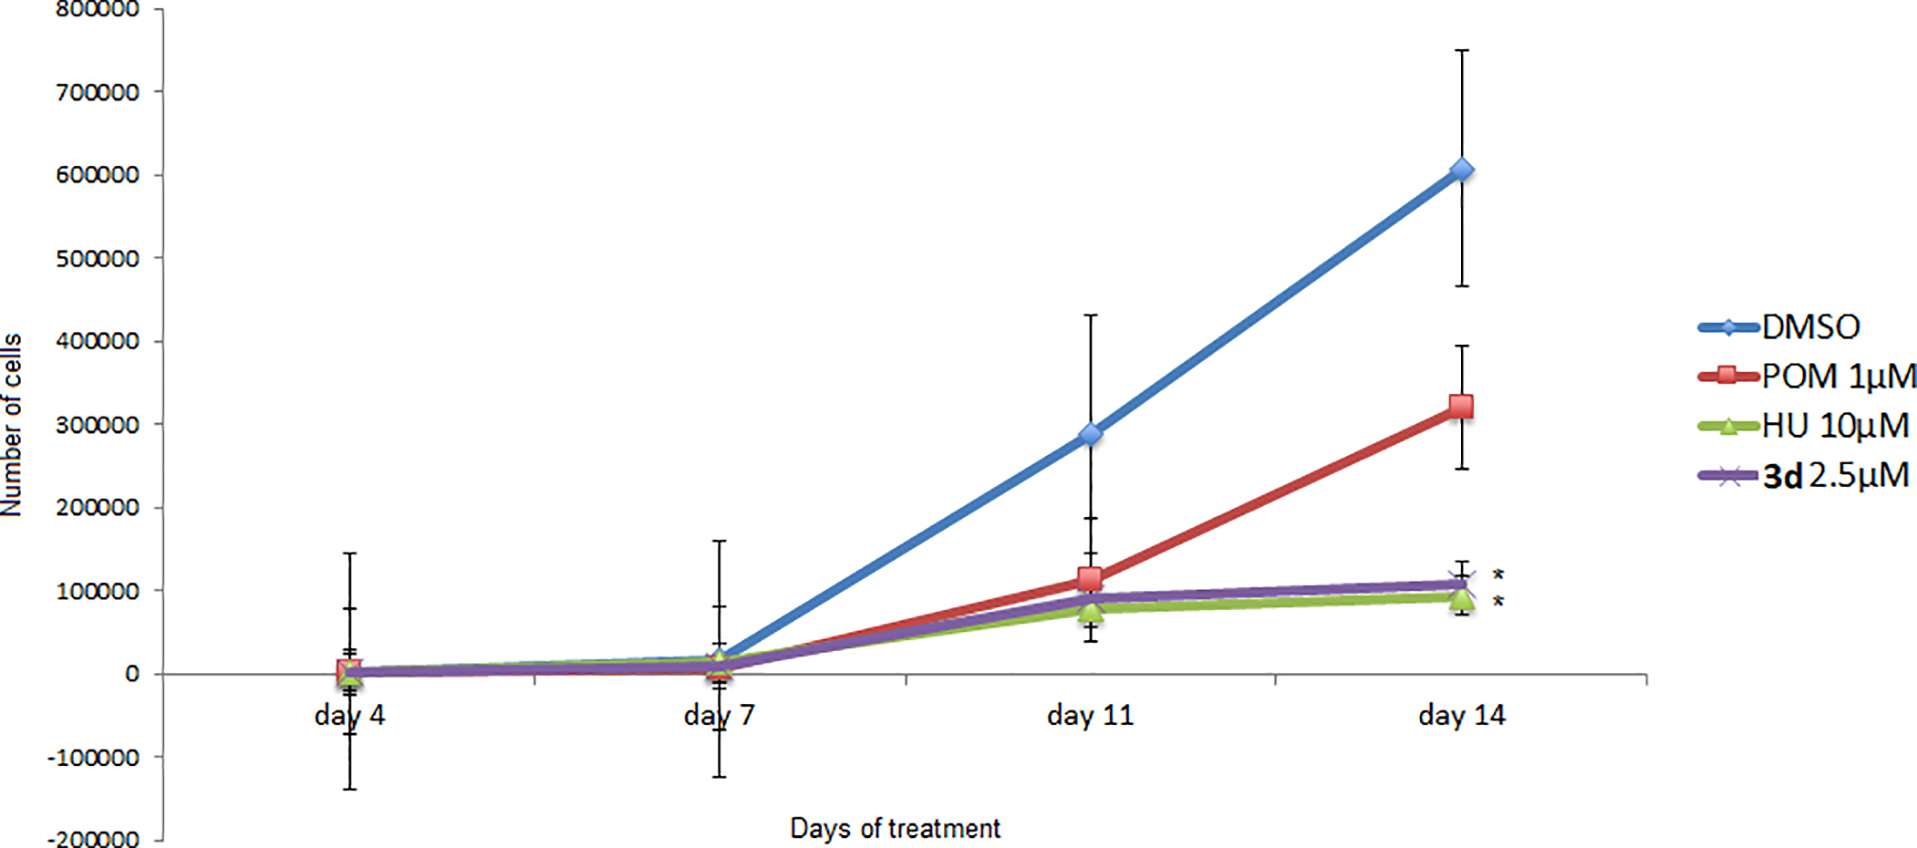
Fetal hemoglobin (HbF) induction constitutes a valuable and validated approach to treat the symptoms of sickle cell disease (SCD). Here, we synthesized pomalidomide-nitric oxide (NO) donor derivatives (3a-f) and evaluated their suitability as novel HbF inducers. All compounds demonstrated different capacities of releasing NO, ranging 0.3-30.3%. Compound 3d was the most effective HbF inducer for CD34+ cells, exhibiting an effect similar to that of hydroxyurea. We investigated the mode of action of compound 3d for HbF induction by studying the in vitro alterations in the levels of transcription factors (BCL11A, IKAROS, and LRF), inhibition of histone deacetylase enzymes (HDAC-1 and HDAC-2), and measurement of cGMP levels. Additionally, compound 3d exhibited a potent anti-inflammatory effect similar to that of pomalidomide by reducing the TNF-α levels in human mononuclear cells treated with lipopolysaccharides up to 58.6%. Chemical hydrolysis studies revealed that compound 3d was stable at pH 7.4 up to 24 h. These results suggest that compound 3d is a novel HbF inducer prototype with the potential to treat SCD symptoms.
Keywords: Epigenetics; Fetal hemoglobin inducers; NO-donors; Nitric oxide; Pomalidomide; Sickle Cell Disease.
Copyright © 2021 Elsevier Inc. All rights reserved.
Conflict of interest statement
Declaration of interests
The authors declare that they have no known competing financial interests or personal relationships that could have appeared to influence the work reported in this paper.
Figures


Similar articles
-
Pomalidomide and lenalidomide regulate erythropoiesis and fetal hemoglobin production in human CD34+ cells.J Clin Invest. 2008 Jan;118(1):248-58. doi: 10.1172/JCI32322. J Clin Invest. 2008. PMID: 18064299 Free PMC article.
-
Pomalidomide augments fetal hemoglobin production without the myelosuppressive effects of hydroxyurea in transgenic sickle cell mice.Blood. 2011 Jul 28;118(4):1109-12. doi: 10.1182/blood-2010-11-319137. Epub 2011 May 2. Blood. 2011. PMID: 21536862 Free PMC article.
-
A thalidomide-hydroxyurea hybrid increases HbF production in sickle cell mice and reduces the release of proinflammatory cytokines in cultured monocytes.Exp Hematol. 2018 Feb;58:35-38. doi: 10.1016/j.exphem.2017.10.003. Epub 2017 Nov 3. Exp Hematol. 2018. PMID: 29108926
-
Induction of fetal hemoglobin in the treatment of sickle cell disease.Hematology Am Soc Hematol Educ Program. 2006:58-62. doi: 10.1182/asheducation-2006.1.58. Hematology Am Soc Hematol Educ Program. 2006. PMID: 17124041 Review.
-
Evaluation of Novel Fetal Hemoglobin Inducer Drugs in Treatment of β-Hemoglobinopathy Disorders.Int J Hematol Oncol Stem Cell Res. 2013;7(3):47-54. Int J Hematol Oncol Stem Cell Res. 2013. PMID: 24505535 Free PMC article. Review.
Cited by
-
Pharmacological Induction of Fetal Hemoglobin in β-Thalassemia and Sickle Cell Disease: An Updated Perspective.Pharmaceuticals (Basel). 2022 Jun 16;15(6):753. doi: 10.3390/ph15060753. Pharmaceuticals (Basel). 2022. PMID: 35745672 Free PMC article. Review.
-
In vitro and In vivo Activity of a New N-Oxide Derivative for Acne Vulgaris Treatment.Med Chem. 2025;21(1):32-45. doi: 10.2174/0115734064306187240722070225. Med Chem. 2025. PMID: 39082171
-
Role of B-Cell Lymphoma/Leukemia 11A in Normal and Malignant Hematopoiesis.Biology (Basel). 2025 Jan 1;14(1):26. doi: 10.3390/biology14010026. Biology (Basel). 2025. PMID: 39857257 Free PMC article. Review.
References
-
- Kato GJ, Piel FB, Reid CD, Gaston MH, Ohene-Frempong K, Krishnamurti L, Smith WR, Panepinto JA, Weatherall DJ, Costa FF, Vichinsky EP, Sickle cell disease, Nat. Rev. Dis. Prim 4 (2018) 18010. - PubMed
-
- Pavan AR, dos Santos JL, Advances in Sickle Cell Disease Treatments, Curr. Med. Chem (2020). - PubMed
Publication types
MeSH terms
Substances
Grants and funding
LinkOut - more resources
Full Text Sources
Medical
Miscellaneous
