

Quantitative analysis of retinal vessel density and thickness changes in diabetes mellitus evaluated using optical coherence tomography angiography: a cross-sectional study
- PMID: 34130654
- PMCID: PMC8207746
- DOI: 10.1186/s12886-021-01988-2
Quantitative analysis of retinal vessel density and thickness changes in diabetes mellitus evaluated using optical coherence tomography angiography: a cross-sectional study
Abstract
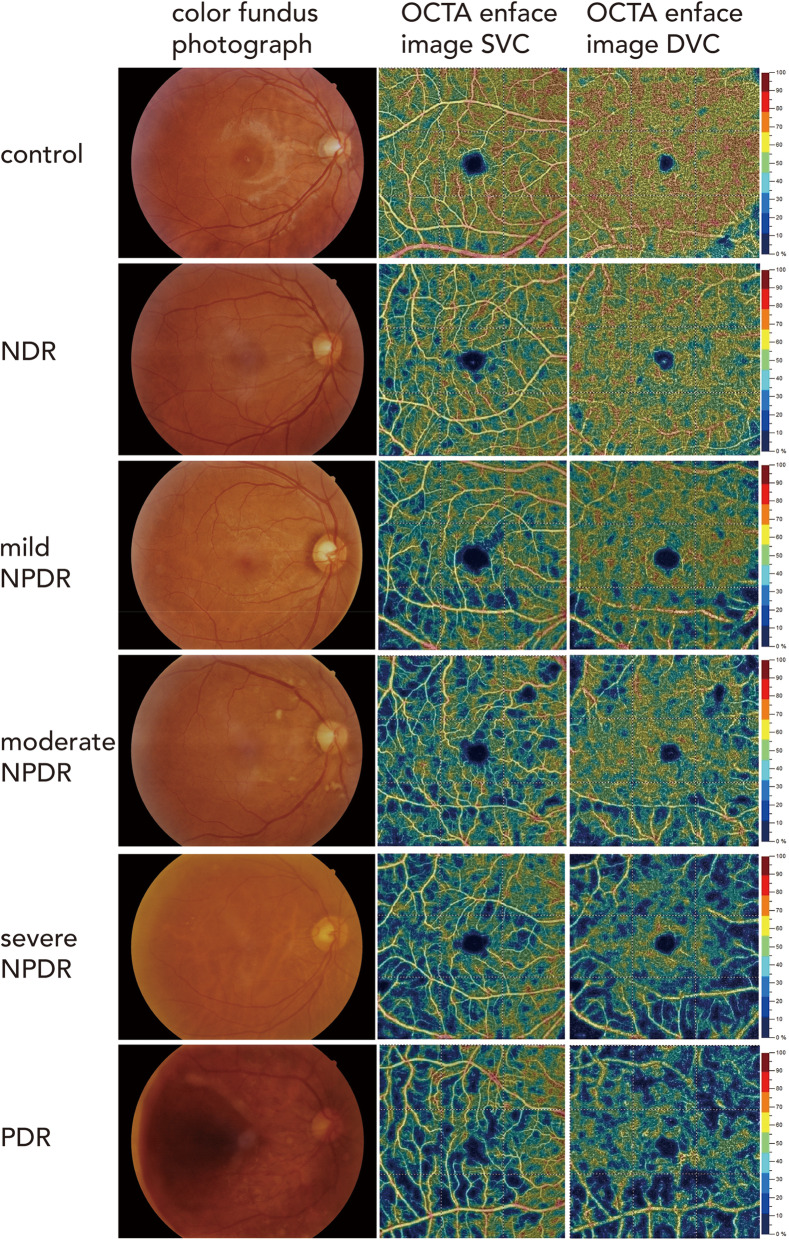
Background: Diabetic retinopathy is the most common microvascular complication of diabetes; however, early changes in retinal microvessels are difficult to detect clinically, and a patient's vision may have begun to deteriorate by the time a problem is identified. Optical coherence tomography angiography (OCTA) is an innovative tool for observing capillaries in vivo. The aim of this study was to analyze retinal vessel density and thickness changes in patients with diabetes.
Methods: This was a retrospective, observational cross-sectional study. Between August 2018 and February 2019, we collected OCTA data from healthy participants and diabetics from the First Affiliated Hospital of Harbin Medical University. Analyzed their retinal vessel density and thickness changes.
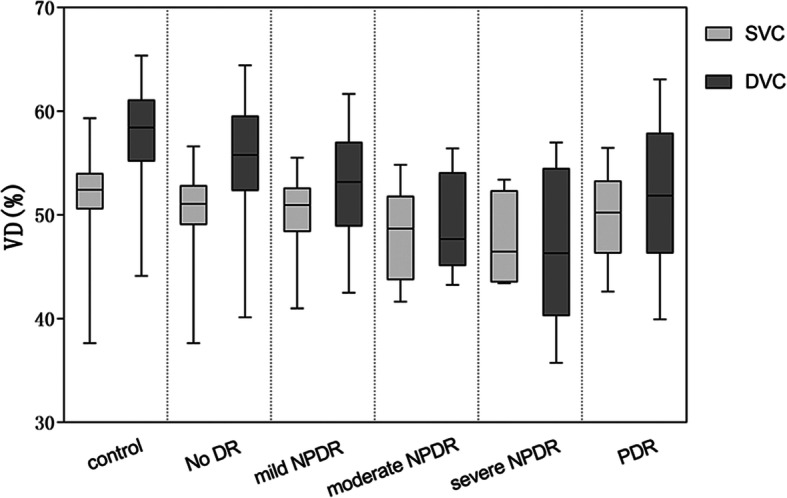
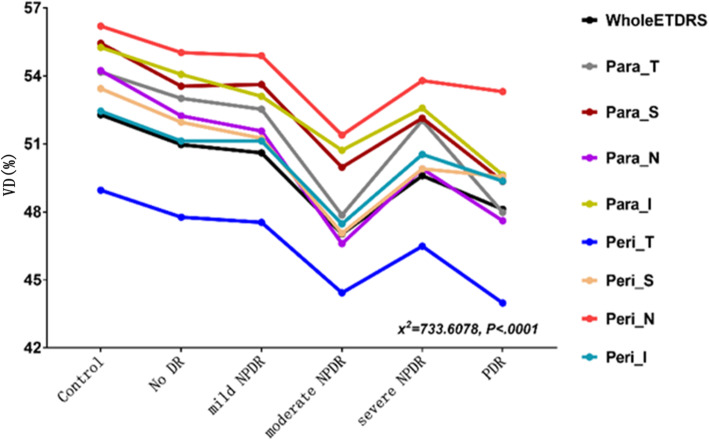
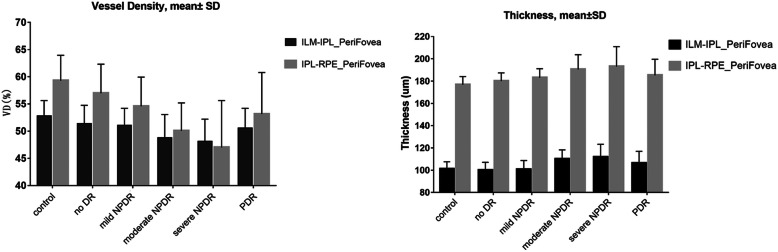
Results: A total of 97 diabetic patients with diabetes at different severity stages of diabetic retinopathy and 85 controls were involved in the experiment. Diabetic patients exhibited significantly lower retinal VD (particularly in the deep vascular complexes), thickening of the neurosensory retina, and thinning of the retinal pigment epithelium compared with controls. In the control group, nondiabetic retinopathy group and mild diabetic retinopathy group, superficial VD was significantly correlated with retinal thickness (r = 0.3886, P < 0.0001; r = 0.3276, P = 0.0019; r = 0.4614, P = 0.0024, respectively).
Conclusions: Patients with diabetes exhibit ischemia of the retinal capillaries and morphologic changes in vivo prior to vision loss. Therefore, OCTA may be useful as a quantitative method for the early detection of diabetic retinopathy.
Keywords: Diabetic retinopathy; OCTA; Retinal thickness; Vessel density.
Conflict of interest statement
The authors declare no conflicts of interest.
Figures


References
Publication types
MeSH terms
LinkOut - more resources
Full Text Sources
Medical
