

Interpreting vaccine efficacy trial results for infection and transmission
- PMID: 34130883
- PMCID: PMC8197448
- DOI: 10.1016/j.vaccine.2021.06.011
Interpreting vaccine efficacy trial results for infection and transmission
Abstract
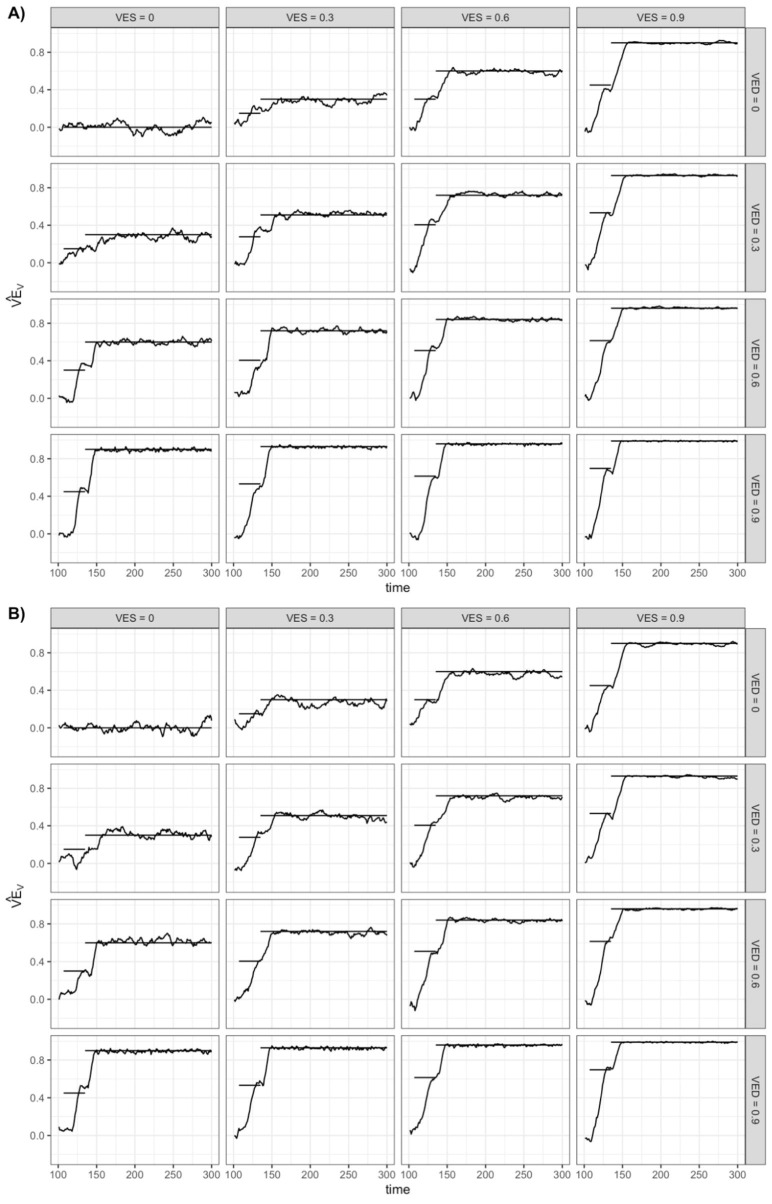
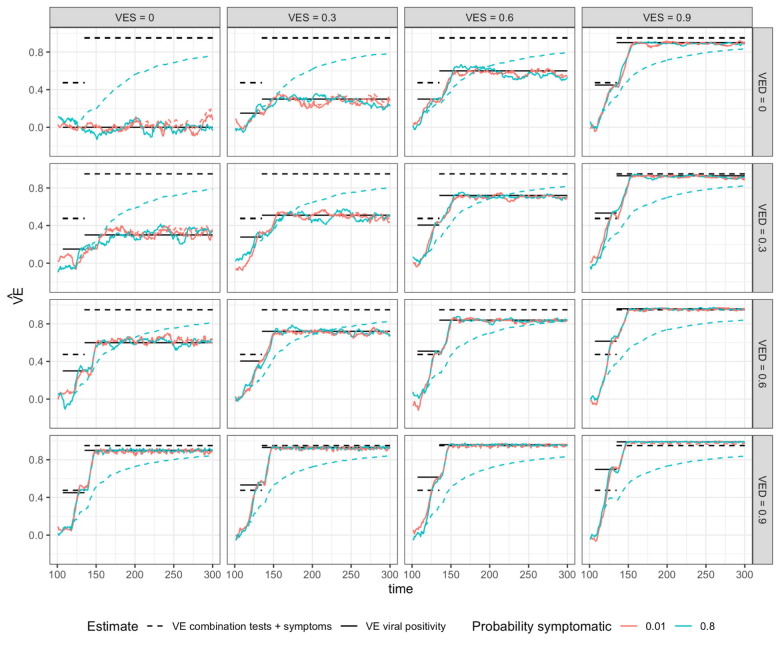
Randomized controlled trials (RCTs) have shown high efficacy of multiple vaccines against SARS-CoV-2 disease (COVID-19), and recent studies have shown the vaccines are also effective against infection. Evidence for the effect of each of these vaccines on ability to transmit the virus is also beginning to emerge. We describe an approach to estimate these vaccines' effects on viral positivity, a prevalence measure which under the reasonable assumption that vaccinated individuals who become infected are no more infectious than unvaccinated individuals forms a lower bound on efficacy against transmission. Specifically, we recommend separate analysis of positive tests triggered by symptoms (usually the primary RCT outcome) and cross-sectional prevalence of positive tests obtained regardless of symptoms. The odds ratio of carriage for vaccine vs. placebo provides an unbiased estimate of vaccine effectiveness against viral positivity, under certain assumptions, and we show through simulations that likely departures from these assumptions will only modestly bias this estimate. Applying this approach to published data from the RCT of the Moderna vaccine, we estimate that one dose of vaccine reduces the potential for transmission by at least 61%, possibly considerably more. We describe how these approaches can be translated into observational studies of vaccine effectiveness.
Keywords: COVID-19; SARS-CoV-2; Trials; Vaccine efficacy.
Copyright © 2021 The Author(s). Published by Elsevier Ltd.. All rights reserved.
Conflict of interest statement
Declaration of Competing Interest The authors declare the following financial interests/personal relationships which may be considered as potential competing interests: Dr. Lipsitch reports consulting/honoraria from Bristol Myers Squibb, Sanofi Pasteur, Janssen, and Merck, as well as a grant through his institution from Pfizer. He has served as an unpaid advisor related to COVID-19 to Pfizer, One Day Sooner, Astra-Zeneca, Janssen, and COVAX (United Biomedical). Dr. Kahn discloses consulting fees from Partners In Health.
Figures
Update of
-
Interpreting vaccine efficacy trial results for infection and transmission.medRxiv [Preprint]. 2021 May 27:2021.02.25.21252415. doi: 10.1101/2021.02.25.21252415. medRxiv. 2021. Update in: Vaccine. 2021 Jul 5;39(30):4082-4088. doi: 10.1016/j.vaccine.2021.06.011. PMID: 33655276 Free PMC article. Updated. Preprint.
Similar articles
-
Interpreting vaccine efficacy trial results for infection and transmission.medRxiv [Preprint]. 2021 May 27:2021.02.25.21252415. doi: 10.1101/2021.02.25.21252415. medRxiv. 2021. Update in: Vaccine. 2021 Jul 5;39(30):4082-4088. doi: 10.1016/j.vaccine.2021.06.011. PMID: 33655276 Free PMC article. Updated. Preprint.
-
A randomized, double-blind, placebo-controlled phase III clinical trial to evaluate the efficacy and safety of SARS-CoV-2 vaccine (inactivated, Vero cell): a structured summary of a study protocol for a randomised controlled trial.Trials. 2021 Apr 13;22(1):276. doi: 10.1186/s13063-021-05180-1. Trials. 2021. PMID: 33849629 Free PMC article.
-
Primary SARS-CoV-2 Infections, Re-infections and Vaccine Effectiveness during the Omicron Transmission Period in Healthcare Workers of Trieste and Gorizia (Northeast Italy), 1 December 2021-31 May 2022.Viruses. 2022 Nov 30;14(12):2688. doi: 10.3390/v14122688. Viruses. 2022. PMID: 36560692 Free PMC article.
-
Universal screening for SARS-CoV-2 infection: a rapid review.Cochrane Database Syst Rev. 2020 Sep 15;9(9):CD013718. doi: 10.1002/14651858.CD013718. Cochrane Database Syst Rev. 2020. PMID: 33502003 Free PMC article.
-
COVID-19 vaccines: comparison of biological, pharmacological characteristics and adverse effects of Pfizer/BioNTech and Moderna Vaccines.Eur Rev Med Pharmacol Sci. 2021 Feb;25(3):1663-1669. doi: 10.26355/eurrev_202102_24877. Eur Rev Med Pharmacol Sci. 2021. PMID: 33629336 Review.
Cited by
-
Assessing the long-term safety and efficacy of COVID-19 vaccines.J R Soc Med. 2021 Jul;114(7):337-340. doi: 10.1177/01410768211013437. Epub 2021 May 4. J R Soc Med. 2021. PMID: 33945346 Free PMC article. No abstract available.
-
A COVID-19 vaccination model for Aotearoa New Zealand.Sci Rep. 2022 Feb 17;12(1):2720. doi: 10.1038/s41598-022-06707-5. Sci Rep. 2022. PMID: 35177804 Free PMC article.
-
Association between influenza vaccine effectiveness and chronic diseases among older adults with dementia.Sci Rep. 2025 Jul 9;15(1):24702. doi: 10.1038/s41598-025-10633-7. Sci Rep. 2025. PMID: 40634642 Free PMC article.
-
Fully understanding the efficacy profile of the COVID-19 vaccination and its associated factors in multiple real-world settings.Front Immunol. 2022 Oct 25;13:947602. doi: 10.3389/fimmu.2022.947602. eCollection 2022. Front Immunol. 2022. PMID: 36389777 Free PMC article. Review.
-
Modelling disease mitigation at mass gatherings: A case study of COVID-19 at the 2022 FIFA World Cup.PLoS Comput Biol. 2024 Jan 18;20(1):e1011018. doi: 10.1371/journal.pcbi.1011018. eCollection 2024 Jan. PLoS Comput Biol. 2024. PMID: 38236838 Free PMC article.
References
-
- Logunov D.Y., Dolzhikova I.V., Shcheblyakov D.V., Tukhvatulin A.I., Zubkova O.V., Dzharullaeva A.S., et al. Safety and efficacy of an rAd26 and rAd5 vector-based heterologous prime-boost COVID-19 vaccine: an interim analysis of a randomised controlled phase 3 trial in Russia. Lancet. 2021;397:671–681. - PMC - PubMed
Publication types
MeSH terms
Substances
Grants and funding
LinkOut - more resources
Full Text Sources
Other Literature Sources
Medical
Miscellaneous
