

Hyperglucagonemia Does Not Explain the β-Cell Hyperresponsiveness and Insulin Resistance in Dysglycemic Youth Compared With Adults: Lessons From the RISE Study
- PMID: 34131047
- PMCID: PMC8740916
- DOI: 10.2337/dc21-0460
Hyperglucagonemia Does Not Explain the β-Cell Hyperresponsiveness and Insulin Resistance in Dysglycemic Youth Compared With Adults: Lessons From the RISE Study
Abstract
Objective: To determine whether β-cell hyperresponsiveness and insulin resistance in youth versus adults in the Restoring Insulin Secretion (RISE) Study are related to increased glucagon release.
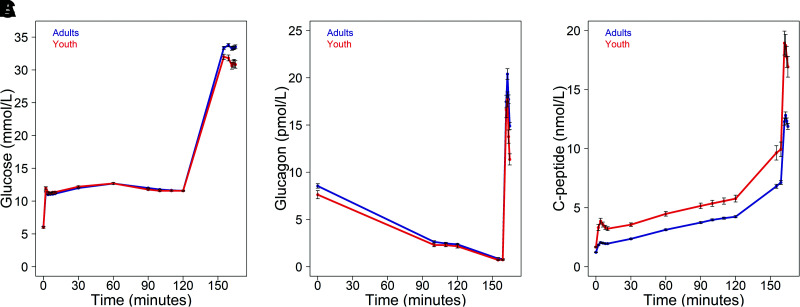
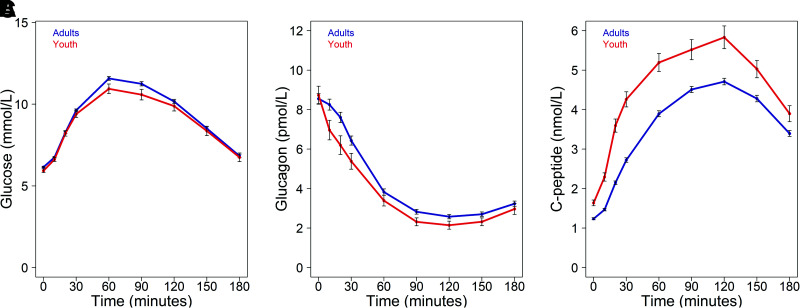
Research design and methods: In 66 youth and 350 adults with impaired glucose tolerance (IGT) or recently diagnosed type 2 diabetes (drug naive), we performed hyperglycemic clamps and oral glucose tolerance tests (OGTTs). From clamps we quantified insulin sensitivity (M/I), plasma fasting glucagon and C-peptide, steady-state glucagon and C-peptide at glucose of 11.1 mmol/L, and arginine-stimulated glucagon (acute glucagon response [AGR]) and C-peptide (ACPRmax) responses at glucose >25 mmol/L.
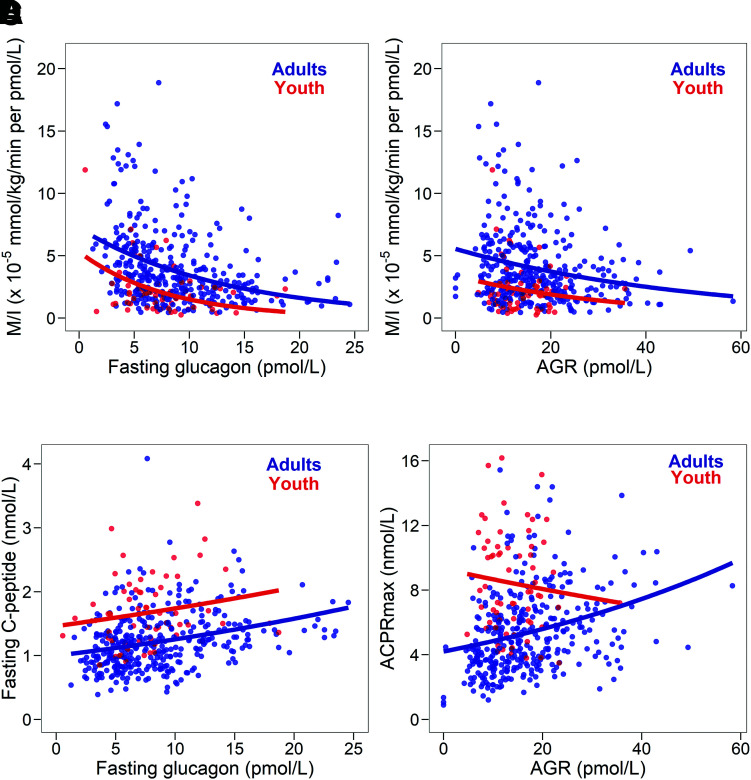
Results: Mean ± SD fasting glucagon (7.63 ± 3.47 vs. 8.55 ± 4.47 pmol/L; P = 0.063) and steady-state glucagon (2.24 ± 1.46 vs. 2.49 ± 1.96 pmol/L, P = 0.234) were not different in youth and adults, respectively, while AGR was lower in youth (14.1 ± 5.2 vs. 16.8 ± 8.8 pmol/L, P = 0.001). Significant age-group differences in insulin sensitivity, fasting C-peptide, steady-state C-peptide, and ACPRmax were not related to glucagon. Fasting glucose and glucagon were positively correlated in adults (r = 0.133, P = 0.012) and negatively correlated in youth (r = -0.143, P = 0.251). In both age-groups, higher fasting glucagon was associated with higher fasting C-peptide (youth r = 0.209, P = 0.091; adults r = 0.335, P < 0.001) and lower insulin sensitivity (youth r = -0.228, P = 0.066; adults r = -0.324, P < 0.001). With comparable fasting glucagon, youth had greater C-peptide and lower insulin sensitivity. OGTT suppression of glucagon was greater in youth.
Conclusions: Youth with IGT or recently diagnosed type 2 diabetes (drug naive) have hyperresponsive β-cells and lower insulin sensitivity, but their glucagon concentrations are not increased compared with those in adults. Thus, α-cell dysfunction does not appear to explain the difference in β-cell function and insulin sensitivity in youth versus adults.
Trial registration: ClinicalTrials.gov NCT01779362 NCT01779375 NCT01763346.
© 2021 by the American Diabetes Association.
Figures
References
-
- Saeedi P, Petersohn I, Salpea P, et al.; IDF Diabetes Atlas Committee . Global and regional diabetes prevalence estimates for 2019 and projections for 2030 and 2045: results from the International Diabetes Federation Diabetes Atlas, 9th edition. Diabetes Res Clin Pract 2019;157:107843. - PubMed
-
- Kahn SE, Haffner SM, Heise MA, et al.; ADOPT Study Group . Glycemic durability of rosiglitazone, metformin, or glyburide monotherapy. N Engl J Med 2006;355:2427–2443 - PubMed
Publication types
MeSH terms
Substances
Associated data
Grants and funding
- UL1 TR000430/TR/NCATS NIH HHS/United States
- U01 DK094406/DK/NIDDK NIH HHS/United States
- UL1 TR001857/TR/NCATS NIH HHS/United States
- UL1 TR001863/TR/NCATS NIH HHS/United States
- U01 DK094431/DK/NIDDK NIH HHS/United States
- U01 DK094430/DK/NIDDK NIH HHS/United States
- P30 DK045735/DK/NIDDK NIH HHS/United States
- UL1 TR001082/TR/NCATS NIH HHS/United States
- P30 DK020595/DK/NIDDK NIH HHS/United States
- P30 DK017047/DK/NIDDK NIH HHS/United States
- TL1 TR001858/TR/NCATS NIH HHS/United States
- UL1 TR001108/TR/NCATS NIH HHS/United States
- U01 DK094438/DK/NIDDK NIH HHS/United States
- P30 DK116073/DK/NIDDK NIH HHS/United States
- U01 DK094467/DK/NIDDK NIH HHS/United States
- P30 DK097512/DK/NIDDK NIH HHS/United States
- K24 HL145076/HL/NHLBI NIH HHS/United States
- UL1 TR001855/TR/NCATS NIH HHS/United States
