. 2021 Jun 15;8(5):e1027.
doi: 10.1212/NXI.0000000000001027. Print 2021 Jul.

Differential Binding of Autoantibodies to MOG Isoforms in Inflammatory Demyelinating Diseases

Affiliations

Differential Binding of Autoantibodies to MOG Isoforms in Inflammatory Demyelinating Diseases

Kathrin Schanda et al. Neurol Neuroimmunol Neuroinflamm. .

Abstract

Objective: To analyze serum immunoglobulin G (IgG) antibodies to major isoforms of myelin oligodendrocyte glycoprotein (MOG-alpha 1-3 and beta 1-3) in patients with inflammatory demyelinating diseases.

Methods: Retrospective case-control study using 378 serum samples from patients with multiple sclerosis (MS), patients with non-MS demyelinating disease, and healthy controls with MOG alpha-1-IgG positive (n = 202) or negative serostatus (n = 176). Samples were analyzed for their reactivity to human, mouse, and rat MOG isoforms with and without mutations in the extracellular MOG Ig domain (MOG-ecIgD), soluble MOG-ecIgD, and myelin from multiple species using live cell-based, tissue immunofluorescence assays and ELISA.

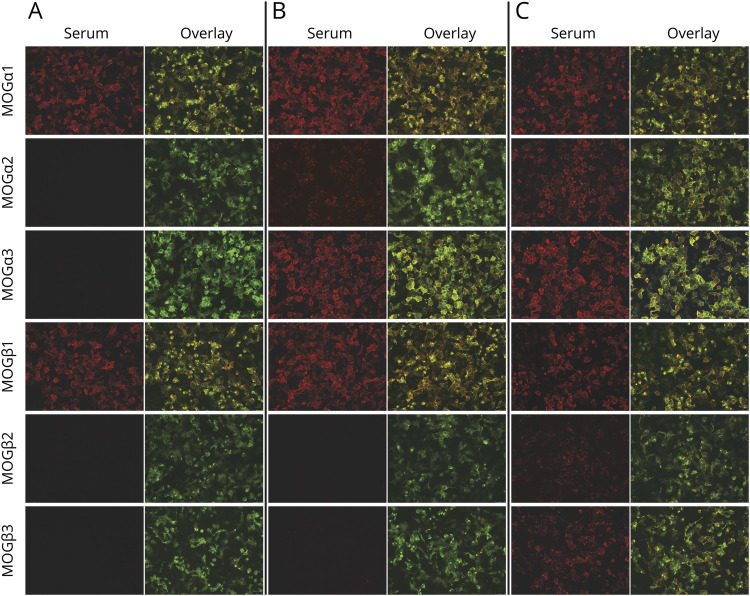
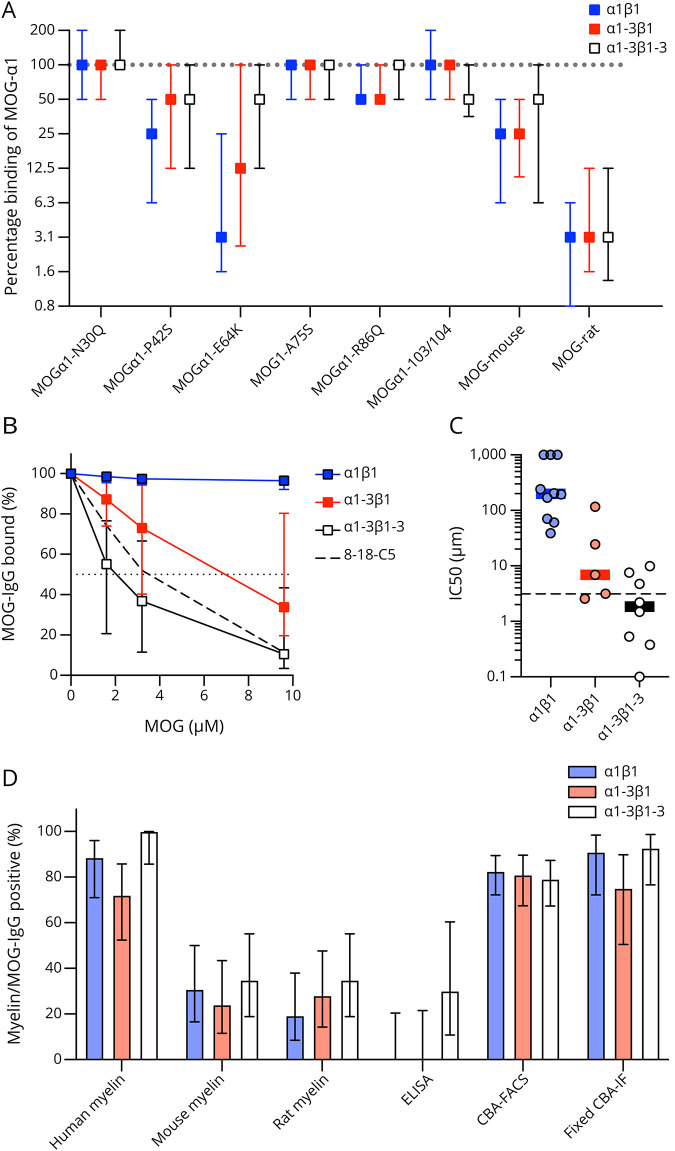
Results: The strongest IgG reactivities were directed against the longest MOG isoforms alpha-1 (the currently used standard test for MOG-IgG) and beta-1, whereas the other isoforms were less frequently recognized. Using principal component analysis, we identified 3 different binding patterns associated with non-MS disease: (1) isolated reactivity to MOG-alpha-1/beta-1 (n = 73), (2) binding to MOG-alpha-1/beta-1 and at least one other alpha, but no beta isoform (n = 64), and (3) reactivity to all 6 MOG isoforms (n = 65). The remaining samples were negative (n = 176) for MOG-IgG. These MOG isoform binding patterns were associated with a non-MS demyelinating disease, but there were no differences in clinical phenotypes or disease course. The 3 MOG isoform patterns had distinct immunologic characteristics such as differential binding to soluble MOG-ecIgD, sensitivity to MOG mutations, and binding to human MOG in ELISA.

Conclusions: The novel finding of differential MOG isoform binding patterns could inform future studies on the refinement of MOG-IgG assays and the pathophysiologic role of MOG-IgG.


Figures

Figure 1
Figure 1. Splicing Variants and Protein Isoforms of Human MOG α1-3 and β1-3
(A) Exon composition of different MOG precursor transcript variants: leader = signal peptide, removed during maturation, exon 3 = contains a stop codon and is present in transcripts for soluble MOG (not depicted in this schematic), TM = encodes the single transmembrane domain, M = encodes the membrane-associated intracellular part of transcripts α1 and β1, exon 7 = specific for transcripts α3 and β3. The last 3′ exons encode specific sequences for MOGα1-3 (10a) and MOGβ1-3 (10b). (B) Protein isoforms of human MOG α1-3 and β1-3. The extracellular Ig-like domain is present in all isoforms (gray), whereas the specific intracellular composition is shown slightly enlarged within the dashed circles using colors fitting to the coding exons described above. MOG = myelin oligodendrocyte glycoprotein.
Figure 2
Figure 2. Differential Binding of Human MOG-IgG to MOG Isoforms α1, α2, α3, β1, β2, and β3
(A) Serial dilutions of humanized monoclonal mouse MOG antibody 8-18-C5. The graph shows the percentage of 8 replicates determined MOG-IgG positive in live CBA-IF transfected with individual MOG isoforms. (B) Mean sensitivity (with 95%) for MOG-IgG in live CBA-IF using the different MOG isoforms as antigens. The dashed line indicates the overall mean sensitivity. (C) Quantitative binding of MOG-IgG to MOG isoforms α1-3 (upper panel) and β1-3 (lower panel) for all 378 samples according to their MOG-IgG serostatus (202 positive and 176 negative). Seropositive samples with an aquaporin-4–seronegative non-MS demyelinating disease typically associated with MOG-IgG (MOGAD, n = 191) are shown as blue violin plots, and seropositive samples from patients with MS (n = 8) or healthy controls (n = 3) are shown as yellow circles. Seronegative samples are shown as red violin plots. Medians and interquartile ranges are indicated by the bars within violin plots. CBA = cell-based assay; HCs = healthy controls; IF = immunofluorescence; MOG = myelin oligodendrocyte glycoprotein; MOG-ecIgD = extracellular MOG immunoglobulin.
Figure 3
Figure 3. Binding Patterns of Human MOG-IgG to MOG Isoforms α1, α2, α3, β1, β2, and β3
(A) Scatter dot plot showing the principal component (PC) scores of all samples and the loading scores of all MOG isoforms to visualize parameters responsible for clustering. This identified different binding pattern clusters associated with PC1 (α1 and β1) and/or PC2 (α2, α3, β2, and β3). Heatmap of the quantitative results (MOG-IgG titers) for all MOG-IgG–seronegative samples (B) or MOG-IgG–seropositive samples (C) according to their MOG isoform binding pattern (negative, α1β1, α1-3β1, and α1-3β1-3). Each column is an individual MOG isoform, and each row is an individual serum sample with MOG isoform binding patterns indicated on the left. MOG-IgG reactivities (titer 1:) are shown in different color intensities (legend with the log scale) and clinical diagnosis of non-MS, MS, and HC. (B) Individual MOG isoform IgG titers (median with the interquartile range) according to the identified binding patterns. The cutoff value for MOG-IgG positivity (α1 1:160) is indicated by the dashed blue line. (C) Percentage of patients with clinical diagnosis of non-MS (MOGAD), MS, and HC according to MOG isoform binding patterns. HCs = healthy controls; MOG = myelin oligodendrocyte glycoprotein; MOGAD = MOG-IgG–associated disorders; MOG-IgG = serum IgG antibodies against MOG.
Figure 4
Figure 4. Representative MOG Isoform CBA-IF Stainings
Representative live CBA-IF serum stainings for the 3 identified MOG isoform antibody binding patterns (A, α1β1; B, α1-3β1; C, α1-3β1-3). Only specific antibody (red) and overlay images (MOG-transfected cells are shown in green) were used to reduce image size (20× magnification). CBA = cell-based assay; IF = immunofluorescence; MOG = myelin oligodendrocyte glycoprotein.
Figure 5
Figure 5. MOG-IgG Binding Patterns to Different Isoforms are Associated With a Differential Recognition of MOG Epitopes
(A) Binding of MOG-IgG to the human MOGα1 mutants N31Q, P42S, E64K, A75S, R86Q, and H103A + S104E (103/104) and to mouse and rat MOG according to their MOG isoform binding patterns (α1β1, n = 64; α1-3β1, n = 43; α1-3β1-3, n = 46). The median differences compared to wild-type MOGα1 are shown as symbols with interquartile ranges (error bars). (B) Competition of binding to MOGα1 in a CBA-FACS assay by soluble MOG-ecIgD added in increasing concentrations (0, 1.6, 3.2, and 9.6 μM) for the 3 MOG isoform binding patterns (α1β1, n = 10; α1-3β1, n = 5; α1-3β1-3, n = 8) and for monoclonal antibody 8-18-C5 (dashed line). Squares indicate the median percentage bound, error bars indicate the interquartile ranges, and the value used for the calculation of IC50 (50% binding) is indicated by the dotted line. Groups were statistically compared using repeated measures 2-way analysis of variance. (C) IC50 values for the competition of binding to MOGα1 in a CBA-FACS assay by soluble MOG-ecIgD according to MOG isoform binding patterns (α1β1, n = 10; α1-3β1, n = 5; α1-3β1-3, n = 8). Individual data points are shown by scatter dots, and medians and interquartile ranges are indicated by lines and error bars. The IC50 value for monoclonal antibody 8-18-C5 is indicated by the dashed line. (D) Binding of human MOG-IgG according to the 3 MOG isoform binding patterns to human, mouse, and rat myelin in brain sections, as well as in ELISA (human MOG Ig domain), CBA-FACS (human MOGα1), and a commercial fixed CBA-IF (human MOGX11). The percentages of myelin/MOG-IgG–positive samples are shown as bars with 95% CI (error bars). CBA = cell-based assay; FACS = fluorescence-activated cell sorting; IF = immunofluorescence; MOG = myelin oligodendrocyte glycoprotein; MOGAD = MOG-IgG–associated disorders; MOG-ecIgD = extracellular MOG immunoglobulin domain; MOG-IgG = serum IgG antibodies against MOG.

References

    1. Reindl M, Waters P. Myelin oligodendrocyte glycoprotein antibodies in neurological disease. Nat Rev Neurol. 2019;15(2):89-102. - PubMed
    1. Cobo-Calvo A, Ruiz A, Maillart E, et al. . Clinical spectrum and prognostic value of CNS MOG autoimmunity in adults: the MOGADOR study. Neurology. 2018;90(21):e1858-e1869. - PubMed
    1. Jurynczyk M, Messina S, Woodhall MR, et al. . Clinical presentation and prognosis in MOG-antibody disease: a UK study. Brain. 2017;140(12):3128-3138. - PubMed
    1. Hennes EM, Baumann M, Schanda K, et al. . Prognostic relevance of MOG antibodies in children with an acquired demyelinating syndrome. Neurology. 2017;89(9):900-908. - PubMed
    1. Hacohen Y, Wong YY, Lechner C, et al. . Disease course and treatment responses in children with relapsing myelin oligodendrocyte glycoprotein antibody-associated disease. JAMA Neurol. 2018;75(4):478-487. - PMC - PubMed

Publication types