. 2021 Jun 15;12(1):3651.
doi: 10.1038/s41467-021-23923-1.

IL-6 regulates autophagy and chemotherapy resistance by promoting BECN1 phosphorylation

Affiliations

IL-6 regulates autophagy and chemotherapy resistance by promoting BECN1 phosphorylation

Fuqing Hu et al. Nat Commun. .

Abstract

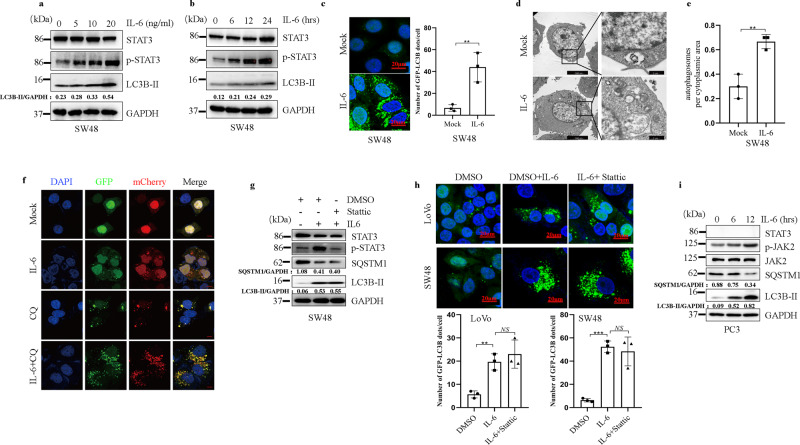
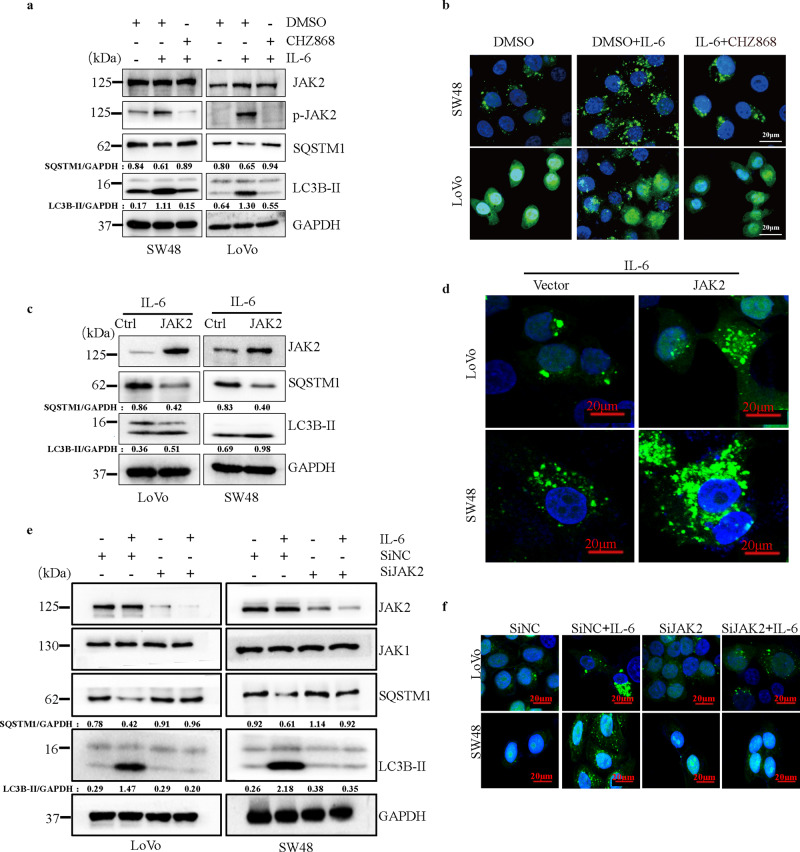
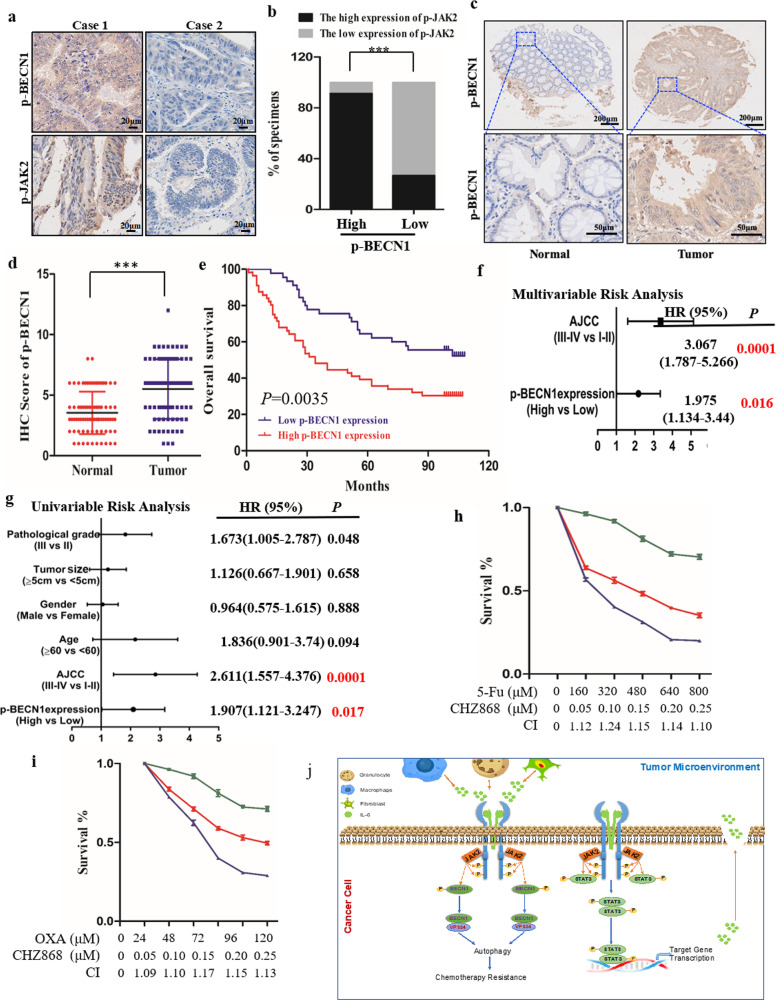
Extracellular cytokines are enriched in the tumor microenvironment and regulate various important properties of cancers, including autophagy. However, the precise molecular mechanisms underlying the link between autophagy and extracellular cytokines remain to be elucidated. In the present study, we demonstrate that IL-6 activates autophagy through the IL-6/JAK2/BECN1 pathway and promotes chemotherapy resistance in colorectal cancer (CRC). Mechanistically, IL-6 triggers the interaction between JAK2 and BECN1, where JAK2 phosphorylates BECN1 at Y333. We demonstrate that BECN1 Y333 phosphorylation is crucial for BECN1 activation and IL-6-induced autophagy by regulating PI3KC3 complex formation. Furthermore, we investigate BECN1 Y333 phosphorylation as a predictive marker for poor CRC prognosis and chemotherapy resistance. Combination treatment with autophagy inhibitors or pharmacological agents targeting the IL-6/JAK2/BECN1 signaling pathway may represent a potential strategy for CRC cancer therapy.


Conflict of interest statement

The authors declare no competing interests.

Figures

Fig. 1
Fig. 1. IL-6 triggers autophagy in cells via a STAT3-independent pathway.
a, b Exogenous IL-6 (20 ng/ml) promotes the accumulation of LC3B-II in SW48 cells treated with IL-6 in a dose- (a) and time-dependent (b) manner. Western blotting was performed to examine the expression of LC3B-II and SQSTM1. (n = 3 independent experiments). c Exogenous IL-6 (20 ng/ml) promotes the accumulation of GFP-LC3B puncta in SW48 cells. Immunofluorescence (IF) staining analyses of GFP-LC3B3 puncta in SW48 cells treated with IL-6 (20 ng/ml) for 12 h. Quantitative analysis of GFP-LC3B puncta is shown in the right panel. **P < 0.01. Scale bars, 20 μm (n = 3 independent experiments). d, e Representative images from transmission electron microscopy showing autophagosomes (arrows) in SW48 cells after treatment with IL-6 (20 ng/ml) (d). Quantitative analysis of autophagosomes is shown in the right panel (e). **P < 0.01. Scale bars, 5 μm (n = 3 independent experiments). f Examination of autophagic flux with the mCherry-GFP-LC3 reporter in SW48 cells. SW48 cells stably expressing the mCherry-GFP-LC3B fusion protein were separately treated with IL-6 (20 ng/ml) in the absence or presence of CQ (25 μM). Confocal microscopy images are shown. Scale bars, 20 μm (n = 3 independent experiments). g Western blotting was performed for SW48 cells separately treated with IL-6 (20 ng/ml) in the absence or presence of Stattic (20 μM) for 12 h (n = 2 independent experiments). h SW48 and LoVo cells stably expressing GFP-LC3B fusion protein were separately treated with IL-6 (20 ng/ml) in the absence or presence of Stattic (20 μM) for 12 h. Confocal microscopy images are shown. Quantitative analysis of GFP-LC3B puncta is shown in the lower panels. **P < 0.01, ***P < 0.001. Scale bars, 20 μm (n = 3 independent experiments). i Exogenous IL-6 promotes the accumulation of LC3B-II and the degradation of SQSTM1 in PC3 cells treated with IL-6 in a dose-dependent manner for 12 h (n = 2 independent experiments). In c, e, and h, the values are presented as the means ± s.d.; p values (Student’s t test, two-sided) with comparisons made to the control or different indicated groups are shown. Source data are provided in the Source Data file.
Fig. 2
Fig. 2. IL-6 promotes autophagy in a JAK2 signaling-dependent manner.
a Western blotting was performed for SW48 and LoVo cells separately treated with IL-6 (20 ng/ml) in the absence or presence of CHZ868 (0.2 μM) for 12 h (n = 2 independent experiments). b SW48 and LoVo cells stably expressing the GFP-LC3B fusion protein were separately treated with IL-6 (20 ng/ml) in the absence or presence of CHZ868 (0.2 μM) for 12 h. Confocal microscopy images are shown. Scale bars, 20 μm (n = 3 independent experiments). c SW48 and LoVo cells were separately transfected with the JAK2 or control plasmid. After transfection for 24 h, cells were treated with IL-6 (20 ng/ml) for 12 h. Western blotting was performed to examine the expression of LC3B-II and SQSTM1 (n = 2 independent experiments). d SW48 and LoVo cells stably expressing the GFP-LC3B fusion protein were separately transfected the JAK2 or control plasmid, and after stimulation with IL-6 (20 ng/ml) for 12 h, confocal microscopy images were obtained to measure the number of GFP puncta. Scale bars, 20 μm (n = 3 independent experiments). e SW48 and LoVo cells were separately transfected with small interfering RNA targeting JAK2 (SiJAK2) or small interfering RNA targeting a negative control gene (SiNC). After transfection for 24 h and following stimulation with IL-6 (20 ng/ml) for 24 h, western blotting was performed to examine the expression of LC3B-II and SQSTM1 (n = 2 independent experiments). f SW48 and LoVo cells stably expressing GFP-LC3B fusion protein were separately transfected with SiJAK2 and SiNC. After stimulation with IL-6 (20 ng/ml) for 24 h, confocal microscopy images were obtained to measure the number of GFP puncta. Scale bars, 20 μm (n = 3 independent experiments). Source data are provided in the Source Data file.
Fig. 3
Fig. 3. JAK2 interacts with BECN1 and phosphorylates BECN1 at Y333.
a, b Immunoprecipitation (IP) analyses were performed to examine the interaction between BECN1 and JAK2 (a) or JAK2 and BECN1 (b) in SW48 cells. c Co-IP was performed to examine the relationship between JAK2 and BECN1 in SW48 cells in the absence or presence of IL-6 (20 ng/ml) for 12 h (upper panels). Western blotting was performed on whole-cell extracts (WCEs) (lower panels). d Immunofluorescent staining (IF) analyses of LoVo cells using anti-BECN1 and anti-JAK2 antibodies. Yellow puncta, double-stained BECN1 and JAK2. Scale bars, 20 μm. e Co-IP was performed to examine the interaction of JAK2 and BECN1 in HEK293T cells cotransfected with Flag-BECN1 and HA-JAK2 (WT)/HA-JAK2 (K882E) (upper panels) for 24 h. Western blotting was performed on WCEs (lower panels). f Co-IP was performed to examine the tyrosine phosphorylation of Flag-BECN1 in HEK293T cells cotransfected with Flag-BECN1 and HA-JAK2 (WT)/HA-JAK2 (K882E) (upper panels) for 24 h. Western blotting was performed on WCEs (lower panels). g Co-IP analyses for HA-BECN1 and p-Tyr in HEK293T cells expressing Flag-JAK2, a vector control (Vector), HA-BECN1 WT, HA-BECN1 Y333F, or HA-BECN1 Y338F. Western blotting was performed on WCEs (lower panels). h Modeled complex structure between the ECD domain (magenta, left) and JH1 domain (right), where the JH1 domain consists of four regions: an N-terminal lobe (gray), a C-terminal lobe (cyan), a C helix (red), and an activation loop (yellow). ATP is colored by element, with carbon atoms in green, oxygen atoms in red, nitrogen atoms in blue, and phosphorus atoms in orange. The residues involved in the hydrophobic interaction are shown in pink sphere representation, with atoms shown as sticks. The hydrogen bond is shown by black dashed lines. On the bottom, from left to right, are the enlarged images for the interface in the catalytic site, the interface between the β sheet with the phosphorylation site of the ECD domain and the N-terminal lobe of the JH1 domain, and the interface between the hydrophobic loop of the ECD domain and the C-terminal lobe of the JH1 domain, respectively. i IP analyses for HA-BECN1 and p-BECN1 (Y333) in HEK293T cells expressing HA-BECN1 WT or HA-BECN1 Y333F. Western blotting was performed on WCEs (lower panels). j Western blotting was performed to examine the expression of BECN1 and p-BECN1 (Y333) in LoVo cells in the absence or presence of IL-6 (20 ng/ml) for 12 h. k SW48 cells were separately transfected with SiJAK2 and SiNC. After transfection for 48 h and following stimulation with IL-6 (20 ng/ml) for 12 h, western blotting was performed. Western blots are representative of two independent experiments. WCE whole-cell extract. Source data are provided in the Source Data file.
Fig. 4
Fig. 4. BECN1 Y333 phosphorylation is required for IL-6-induced autophagy.
a IP analyses for VPS34, VPS15, BCL2, Rubicon, UVRAG, ATG14, and BECN1 in HEK293T cells in the absence or presence of IL-6 (20 ng/ml) for 12 h or in the absence or presence of CHZ868 (0.2 μM) treatment for 12 h. Western blotting was performed on WCEs (lower panels). b Co-IP analyses for HA-BECN1, VPS15, BCL2, Rubicon, UVRAG, ATG14, and VPS34 in HEK293T cells expressing HA-BECN1 WT, HA-BECN1 Y333F, or HA-BECN1 Y333E. Western blotting was performed on whole-cell lysates (lower panels). c Western blot analyses for BECN1, SQSTM1, and LC3B-II in MCF-7 cells expressing a vector control (Vector), HA-BECN1 WT, HA-BECN1 Y333F, or HA-BECN1 Y333E in the absence or presence of IL-6 (20 ng/ml) for 12 h. d Western blot analyses for BECN1, SQSTM1, LC3B-II in LoVo-BECN1-KO cells expressing a vector control (Vector), HA-BECN1 WT, HA-BECN1 Y333F, or HA-BECN1 Y333E in the absence or presence of IL-6 (20 ng/ml) for 12 h. e, f IF analyses for GFP-LC3B3 puncta in LoVo-BECN1-KO cells expressing a vector control (Vector), HA-BECN1 WT, HA-BECN1 Y333F or HA-BECN1 Y333E in the absence or presence of IL-6 (20 ng/ml) for 12 h. Confocal microscopy images are shown (n = 3 independent experiments) (f). Quantification of the number of GFP-LC3B puncta is shown in the right panel (g). *P < 0.05, ***P < 0.001. NS not significant. Scale bars, 20 μm. The values are presented as the mean ± s.d.; p values (Student’s t test, two-sided) with comparisons made to the control or different indicated groups are shown. Western blots are representative of two independent experiments. WCE whole-cell extract. Source data are provided in the Source Data file.
Fig. 5
Fig. 5. IL-6-induced BECN1 Y333 phosphorylation promotes cancer chemotherapy resistance.
a CCK-8 assays for cell viability of SW48 cells separately pretreated with DMEM or IL-6 (20 ng/ml) for 8 h in the presence of DMSO, 5-Fu (800 μM), or OXA (100 μM) for 36 h. **P < 0.01, ***P < 0.001 (n = 3 independent experiments). b Western blot analyses for cleaved caspase-3 and cleaved PARP1 in SW48 cells separately pretreated with DMEM or IL-6 (20 ng/ml) for 8 h in the presence of DMSO, 5-Fu (800 μM) or OXA (100 μM) for 36 h (n = 3 independent experiments). c CCK-8 assays for cell viability of SW48 cells separately pretreated with DMEM or IL-6 (20 ng/ml) for 8 h in the presence of CQ (25 μM), 5-Fu (800 μM) or OXA (100 μM) for 36 h. *P < 0.05, **P < 0.01, ***P < 0.001 (n = 3 independent experiments) d Western blot analyses for cleaved caspase-3 and cleaved PARP1 in SW48 cells separately pretreated with DMEM or IL-6 (20 ng/ml) for 8 h in the presence of CQ (25 μM), 5-Fu (800 μM), or OXA (100 μM) for 36 h. (n = 3 independent experiments). e In vivo CRC xenografts derived from CT26 cells were treated with IL-6, 5-Fu, or OXA. Quantification of tumor weights from the different CRC xenografts is shown. **P < 0.01, ***P < 0.001. f Tumor volumes at the experimental endpoint were quantified in CT26 cell xenografts. g The apoptotic index was quantified for the different CRC xenografts. **P < 0.01, ***P < 0.001. hj In vivo CRC xenografts derived from CT26 cells and CT26-Becn1-KO cells separately expressing a vector control (Vector), Becn1 WT, Becn1 Y3331F, or Becn1 Y3331 were treated with DMSO, 5-Fu or OXA. Tumor weights (h), tumor volumes (i), and apoptotic index (j) quantified at the experimental endpoint are shown (n = 5 mice per genotype). **P < 0.01, ***P < 0.001. NS not significant. In (a, c, e, g, h and j), the values are presented as the means ± SEM; p values (Student’s t test, two-sided) with control or different indicated groups are shown. Source data are provided in the Source Data file.
Fig. 6
Fig. 6. JAK2-induced BECN1 Y333 phosphorylation is a predictive marker for poor cancer prognosis and chemotherapy resistance.
a Representative results of immunohistochemical staining for p-JAK2 and p-BECN1 (Y333) in the same tumor tissues from 65 clinical CRC patients. Scale bars, 20 μm. b Statistical analysis of the expression of p-JAK2 and p-BECN1 (Y333) in tumor tissues. ***P < 0.001. The values are presented as the means ± s.d.; the p value (χ2-Test) is shown. c Representative results of immunohistochemical staining for p-BECN1 (Y333) in tumor tissues and adjacent normal tissues. Scale bars, 200 μm (top) and 50 μm (bottom). d Statistical analysis of p-BECN1 (Y333) levels in tumor tissues and adjacent normal tissues. ***P < 0.001. Data are presented as the means ± s.d., and the p value was determined by unpaired Student’s t test. e Overall survival was compared between CRC patients with low and high levels of p-BECN1 (Y333) (n = 44 low p-BECN1 (Y333) levels; n = 57 high p-BECN1 (Y333) levels). Survival data were analyzed by the Kaplan–Meier method and log-rank test. f, g Univariate analysis (f) and multivariate analysis (g) were performed in Cohort 2. The bars correspond to 95% confidence intervals. h, i Synergy analysis of the JAK2 inhibitor CHZ868 and chemotherapy drugs (5-Fu or OXA) in LoVo cells. Cells were treated with the indicated concentrations of CHZ868 and 5-Fu (h) or OXA (i) for 36 h. The combination index (CI) value was examined. The CI value indicates the following: >1.15, synergism = 0.85–1.15, additive effect; and <0.85, antagonism. j Proposed schematic diagram of IL-6-mediated autophagy activation to promote chemotherapy resistance in colorectal cancer. Source data are provided in the Source Data file.

References

    1. Binnewies, M., Roberts, E. W., Kersten, K. & Chan, V. Understanding the tumor immune microenvironment (TIME) for effective therapy. Nat. Med.24, 541–550 (2018). - PMC - PubMed
    1. Kalluri R. The biology and function of fibroblasts in cancer. Nat. Rev. Cancer. 2016;16:582–598. doi: 10.1038/nrc.2016.73. - DOI - PubMed
    1. Hanahan D, Weinberg RA. Hallmarks of cancer: the next generation. Cell. 2011;144:646–674. doi: 10.1016/j.cell.2011.02.013. - DOI - PubMed
    1. Bian X, et al. Microvesicles and chemokines in tumor microenvironment: mediators of intercellular communications in tumor progression. Mol. Cancer. 2019;18:50. doi: 10.1186/s12943-019-0973-7. - DOI - PMC - PubMed
    1. Chow MT, Luster AD. Chemokines in cancer. Cancer Immunol. Res. 2014;2:1125–1131. doi: 10.1158/2326-6066.CIR-14-0160. - DOI - PMC - PubMed

Publication types

MeSH terms