. 2021 Jun 15;12(1):3644.
doi: 10.1038/s41467-021-23902-6.

iPLA2β-mediated lipid detoxification controls p53-driven ferroptosis independent of GPX4

Affiliations

iPLA2β-mediated lipid detoxification controls p53-driven ferroptosis independent of GPX4

Delin Chen et al. Nat Commun. .

Abstract

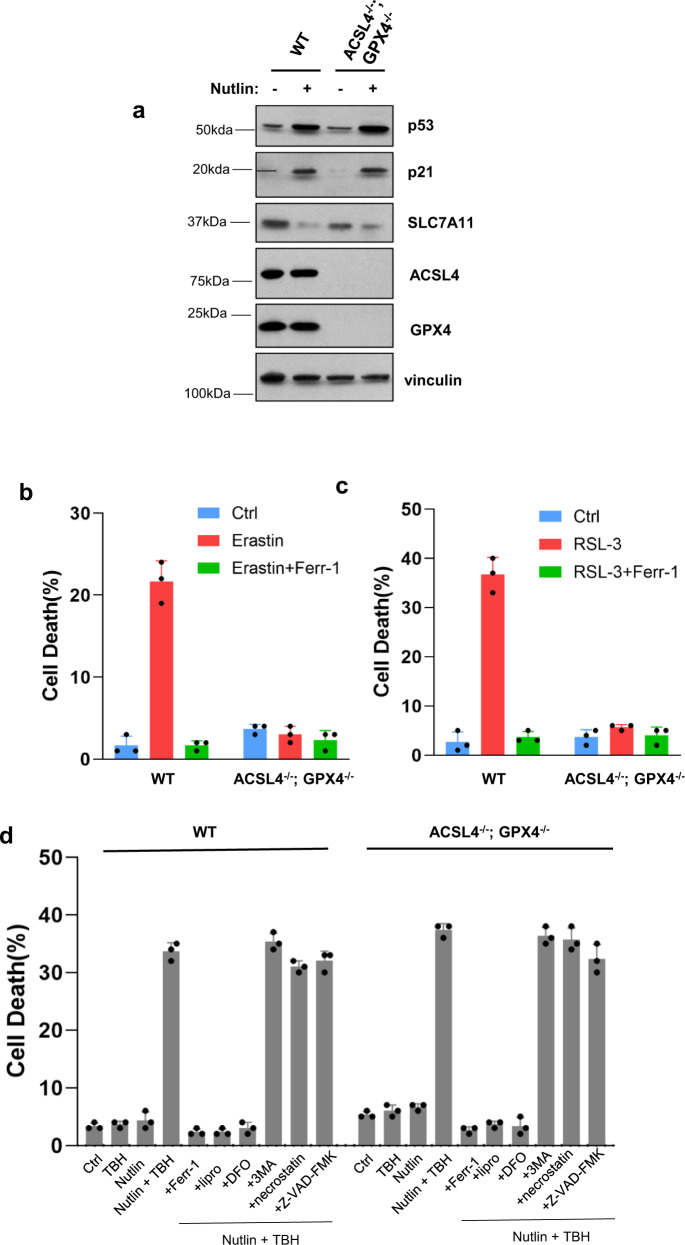
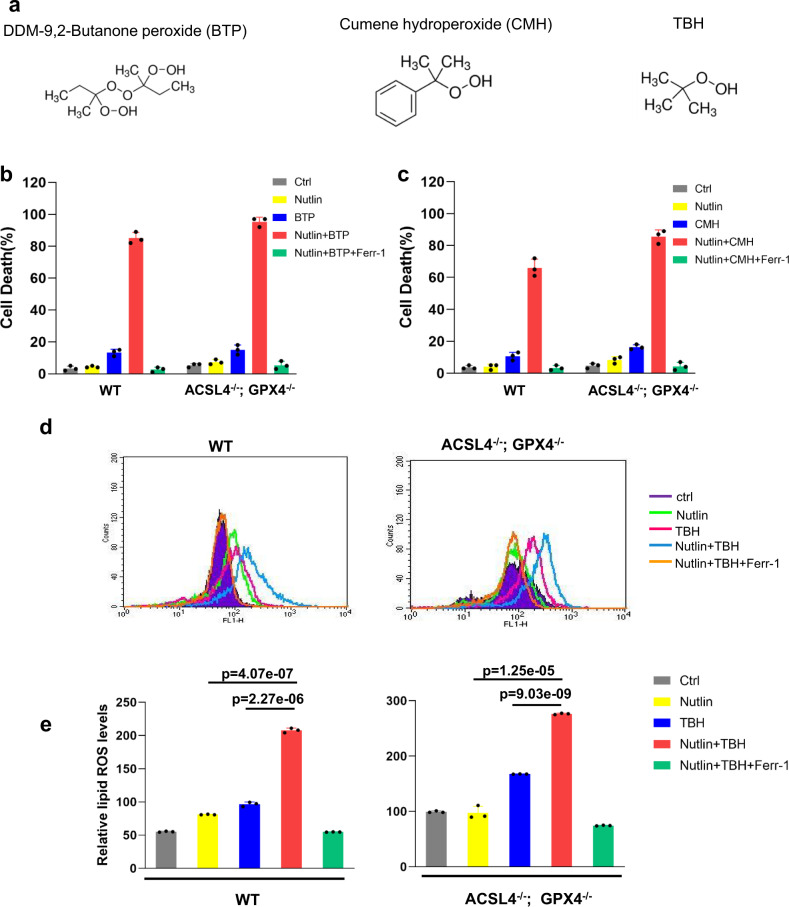
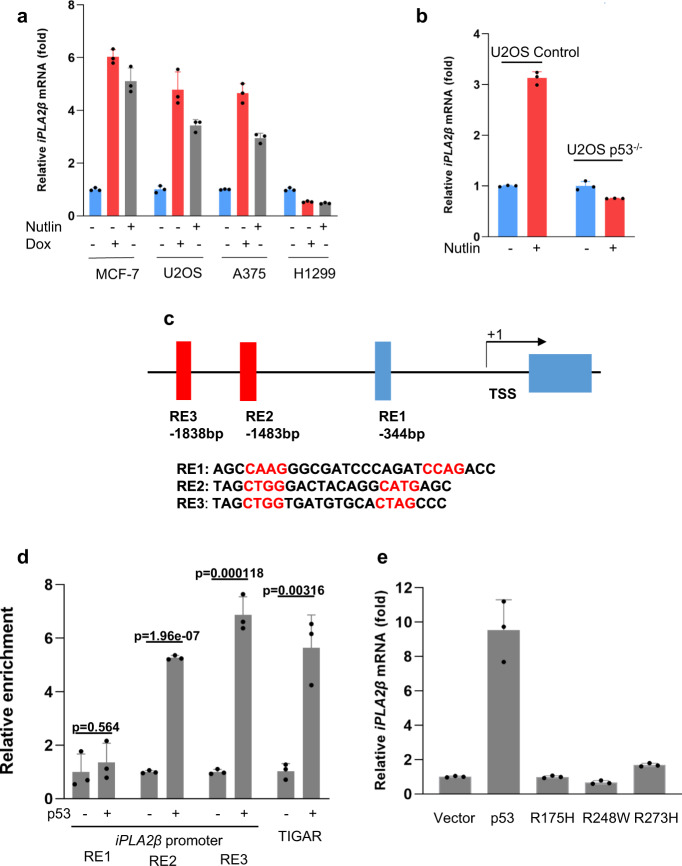
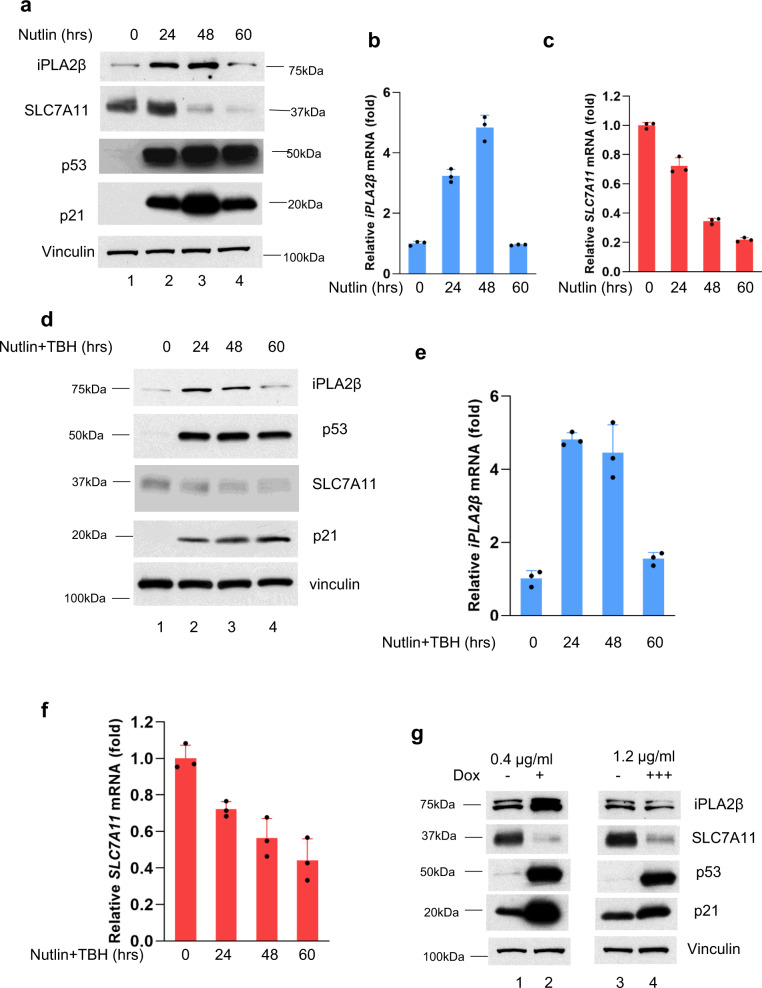
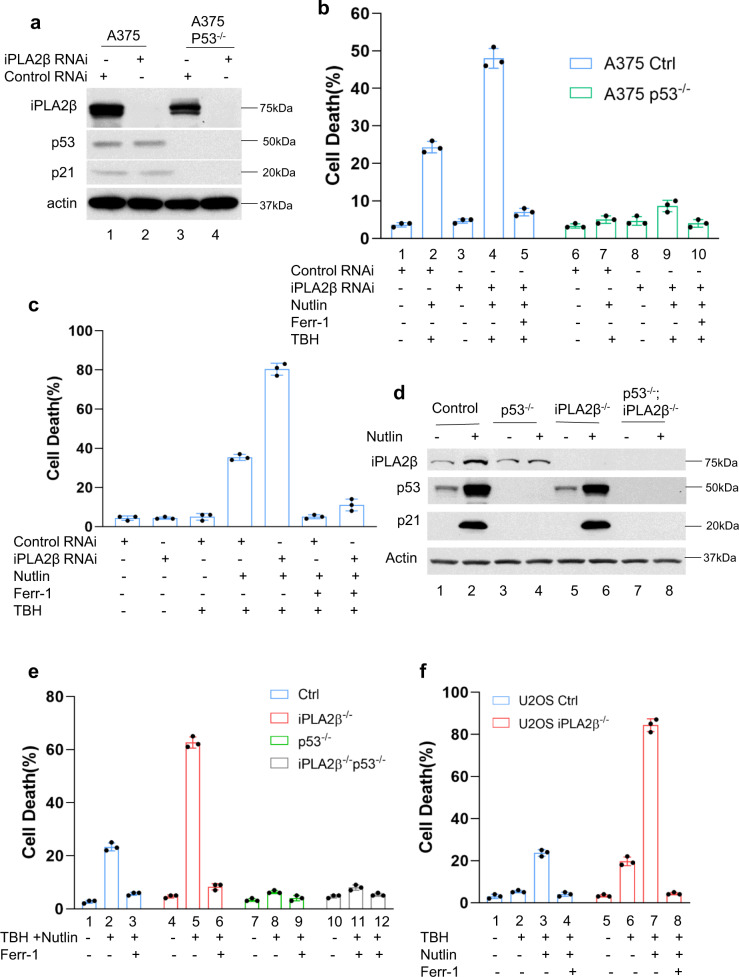
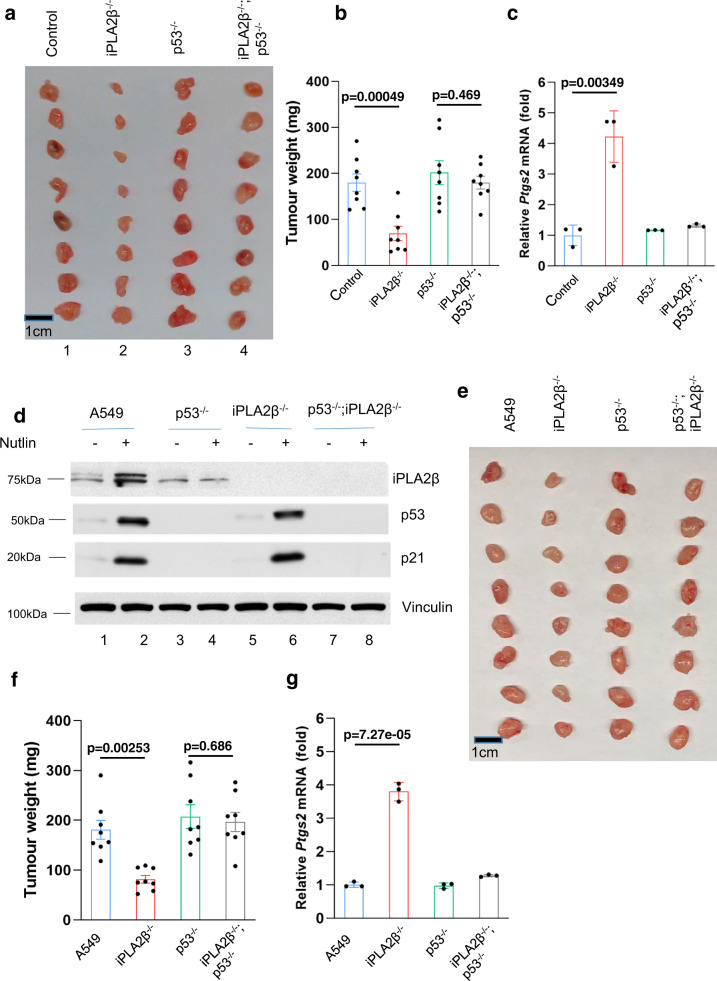
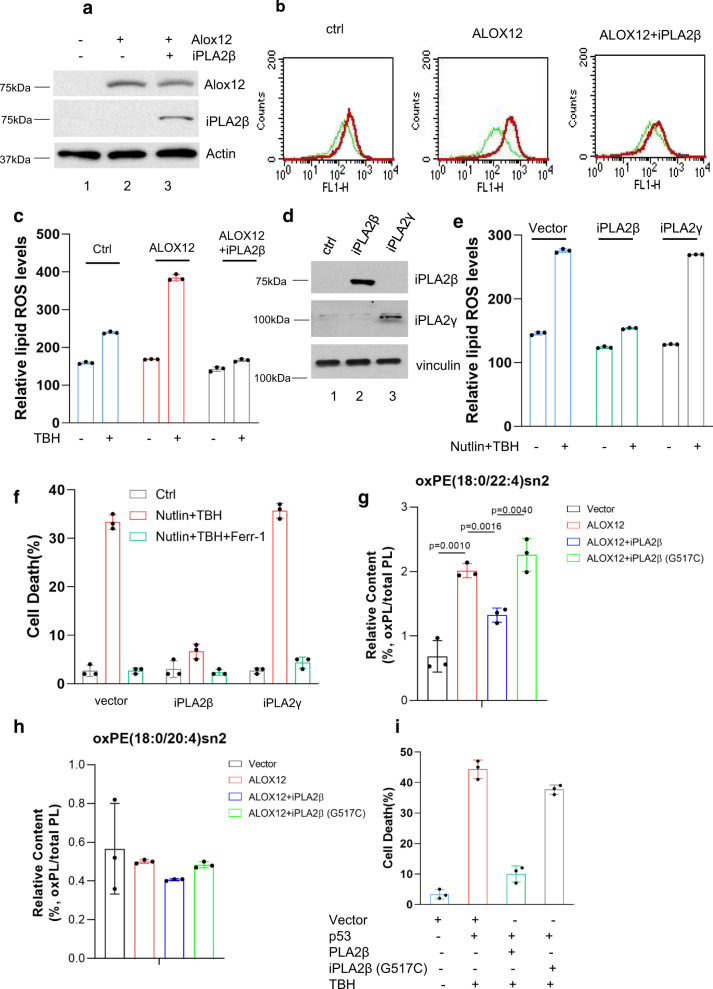
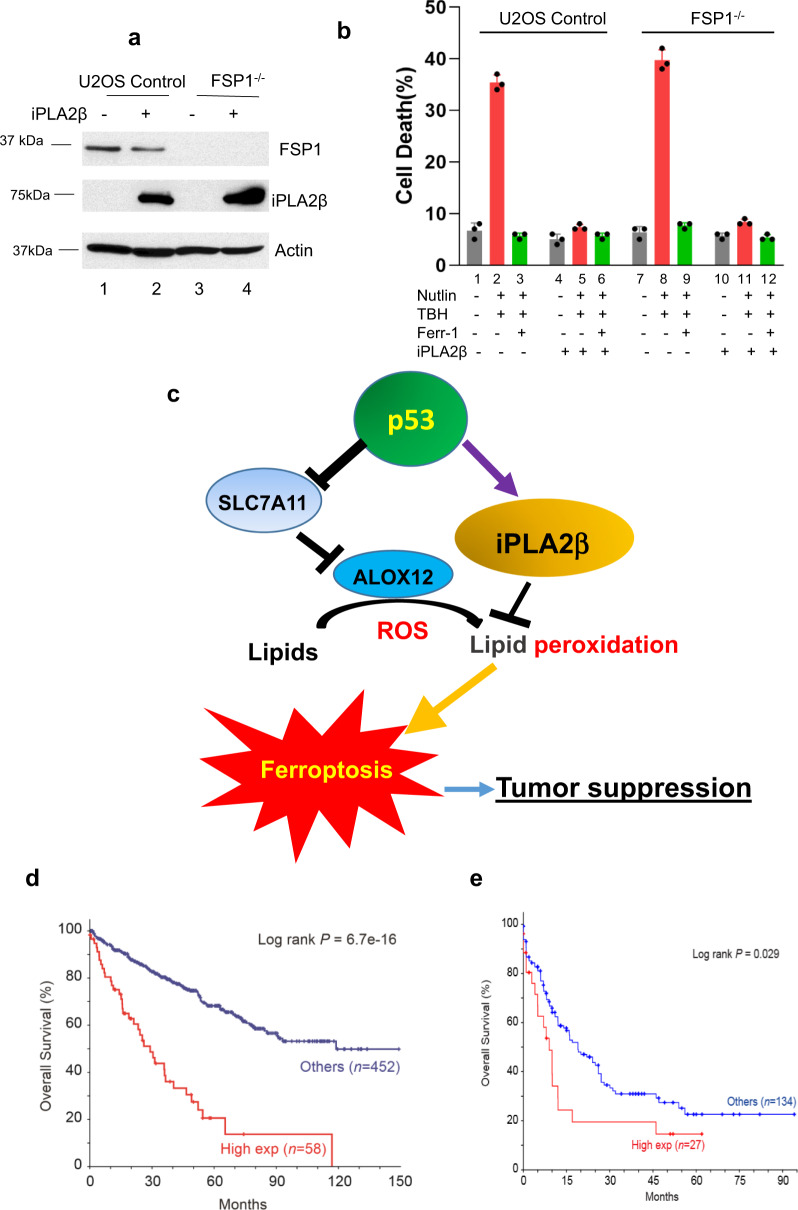
Here, we identify iPLA2β as a critical regulator for p53-driven ferroptosis upon reactive oxygen species (ROS)-induced stress. The calcium-independent phospholipase iPLA2β is known to cleave acyl tails from the glycerol backbone of lipids and release oxidized fatty acids from phospholipids. We found that iPLA2β-mediated detoxification of peroxidized lipids is sufficient to suppress p53-driven ferroptosis upon ROS-induced stress, even in GPX4-null cells. Moreover, iPLA2β is overexpressed in human cancers; inhibition of endogenous iPLA2β sensitizes tumor cells to p53-driven ferroptosis and promotes p53-dependent tumor suppression in xenograft mouse models. These results demonstrate that iPLA2β acts as a major ferroptosis repressor in a GPX4-independent manner. Notably, unlike GPX4, loss of iPLA2β has no obvious effect on normal development or cell viability in normal tissues but iPLA2β plays an essential role in regulating ferroptosis upon ROS-induced stress. Thus, our study suggests that iPLA2β is a promising therapeutic target for activating ferroptosis-mediated tumor suppression without serious toxicity concerns.


Conflict of interest statement

B.R.S. holds equity in and serves as a consultant to Inzen Therapeutics and is an inventor on patents and applications related to ferroptosis. The other authors declare no competing interests.

Figures

Fig. 1
Fig. 1. p53-Mediated ferroptosis is GPX4-independent upon ROS-induced stress.
a Western blot analysis of U2OS ACSL4−/−; GPX4−/− cells treated with Nutlin (10 μM) as indicated for 48 h. The experiments were repeated twice, independently, with similar results. b U2OS ACSL4−/−; GPX4−/− cells were treated with Erastin (40 μM) and Ferr-1 (2 μM) as indicated for 12 h. c U2OS ACSL4−/−; GPX4−/− cells were treated with RSL-3 (2 μM) and Ferr-1 (2 μM) as indicated for 12 h. d U2OS control, ACSL4−/−; GPX4−/− cells pre-incubated with Nutlin (10 μM) for 24 h were treated with TBH (250 μM), Nutlin (10 μM), Ferr-1 (2 μM), Lipro-1 (2 μM), 3-MA (2 mM), necrostatin-1 (10 μg/mL), and Z-VAD-FMK (10 μg/mL) as indicated, for 8 h. 3-MA, 3-methylademine. bd Error bars are mean ± s.d., n = 3 biologically independent experiments. Source data are provided as a Source Data file.
Fig. 2
Fig. 2. BTP or CMH has similar effects as TBH does.
a Variant compounds having similar functional group with TBH. b U2OS control, ACSL4−/−; GPX4−/− cells pre-incubated with Nutlin (10 μM) for 12 h were treated with BTP (300 μM), Nutlin (10 μM), and Ferr-1 (2 μM) as indicated for 8 h. BTP, butanone peroxide. c U2OS control, ACSL4−/−; GPX4−/− cells pre-incubated with Nutlin (10 μM) for 12 h were treated with CMH (200 μM), Nutlin (10 μM), and Ferr-1 (2 μM) as indicated for 8 h. CMH, cumene hydroperoxide. d Lipid peroxidation levels of U2OS control, ACSL4−/−; GPX4−/− cells pre-incubated with Nutlin (10 μM) for 12 h were treated with TBH (300 μM), Nutlin (10 μM), and Ferr-1 (2 μM) as indicated for 8 h. e Quantification of lipid peroxidation levels is shown as in (d). b, c, e Error bars are mean ± s.d., n = 3 independent repeats. e All p values were calculated using two-tailed unpaired Student’s t-test. Detailed statistical tests are described in the ‘Methods’. For WT, p = 0.000000227, TBH versus Nutlin + TBH; p = 0.0000000407, Nutlin versus Nutlin + TBH. For ACSL4−/−; GPX4−/−, p = 0.000000000903, TBH versus Nutlin + TBH; p = 0.00000125, Nutlin versus Nutlin + TBH. Source data are provided as a Source Data file.
Fig. 3
Fig. 3. Regulation of iPLA2β during p53-mediated stress responses.
a qPCR analysis of mRNA levels of iPLA2β in the MCF-7, U2OS, A375, and H1299 cells treated with 0.2 μg/mL doxorubicin or 10 μM Nutlin for 24 h. b qPCR analysis of mRNA levels of iPLA2β in the U2OS CRISPR control versus p53−/− cells treated with 10 μM Nutlin for 24 h. c Schematic representation of the promoter region in the human iPLA2β gene. The p53-binding sites upstream of the first exon are indicated as responsive elements (RE). TSS, transcription start site. d ChIP-qPCR was performed in H1299 cells transfected with empty vector or p53. p values were calculated using two-sided unpaired Student’s t-test. Detailed statistical tests are described in the ‘Methods’. p = 0.564 for RE1; p = 0.0000000196 for RE2; p = 0.000118 for RE3; and p = 0.00316 for TIGAR. e H1299 cells were transfected with empty vector, wild-type p53 or mutants (R175H, R273H, and R248W), and iPLA2β mRNA levels were analyzed by qRT-PCR. a, b, d, e Error bars are mean ± s.d., n = 3 biologically independent experiments. Source data are provided as a Source Data file.
Fig. 4
Fig. 4. Differential effects on iPLA2β mediated by p53 depends on stress duration and intensity.
a Western blot analysis of extracts of U2OS cells with different time of 10 μM Nutlin treatment. The experiments were repeated twice, independently, with similar results. b qPCR analysis of mRNA levels of iPLA2β for the above cells. c qPCR analysis of mRNA levels of SLC7A11 for the same cells as (a). d Western blot analysis of extracts of U2OS cells with different time of 10 μM Nutlin + TBH treatment. The experiments were repeated twice, independently, with similar results. e qPCR analysis of mRNA levels of iPLA2β for the same cells as (d). f qPCR analysis of mRNA levels of SLC7A11 for the same cells as (d). g Western blot analysis of extracts of HCT116 cells with low dose (lanes 1, 2) or high dose of doxorubicin (lanes 3, 4) as indicated for 30 h. The experiments were repeated twice, independently, with similar results. b, c, e, f Error bars are mean ± s.d., n = 3 biologically independent experiments. Source data are provided as a Source Data file.
Fig. 5
Fig. 5. iPLA2β acts as a major suppressor of p53-mediated ferroptosis.
a Western blot analysis of extracts of A375 CRISPR control (lanes 1, 2) versus p53 −/− cells (lanes 3, 4) treated with control RNAi (lanes 1, 3) or iPLA2β RNAi (lanes 2, 4) by the antibodies to iPLA2β, p53, p21, or actin. The experiments were repeated twice, independently, with similar results. b Quantification of ROS-induced ferroptotic cell death. The same cells in (a) were pre-incubated with 10 μM Nutlin for 24 h, then treated with 120 μM TBH and 10 μM Nutlin (error bars, s.d. from three independent samples). c Quantification of ferroptotic cell death-mediated by ROS. After iPLA2β RNAi treatment, MCF-7 cells were pre-incubated with 10 μM Nutlin for 24 h, then treated with 80 μM TBH and 10 μM Nutlin (error bars, s.d. from three independent samples). d Western blot analysis of extracts of A375 CRISPR control (lanes 1, 2), p53−/− cells (lanes 3, 4), iPLA2β−/− cells (lanes 5, 6), or p53−/−; iPLA2β−/− cells treated with Nutlin 10 μM for 24 h (lanes 2, 4, 6, 8) versus control (lanes 1,3, 5, 7) by the antibodies to iPLA2β, p53, p21, or actin. The experiments were repeated twice, independently, with similar results. e Quantification of cell death in the same cells as (d) with additional of 150 μm TBH as indicated. Error bars are mean ± s.d., n = 3 biologically independent experiments. f Quantification of ROS-mediated ferroptotic cell death. U2OS CRISPR control versus iPLA2β−/− cells pre-incubated with Nutlin (10 μM) for 24 h were treated with TBH (250 μM), Nutlin (10 μM) and Ferr-1 (2 μM) as indicated (error bars, s.d. from three independent replicates). Source data are provided as a Source Data file.
Fig. 6
Fig. 6. iPLA2β acts as a major suppressor of p53-mediated tumor suppressor.
a Xenograft tumors from A375 CRISPR control, iPLA2β−/−, p53−/− or p53−/−; iPLA2β−/− cells as indicated. b Tumor weights were determined from (a) (error bars, from eight tumors). The experiments were repeated twice independently with similar results and representative data were shown. p = 0.00049 for control versus iPLA2β−/−; p = 0.469 for p53−/− versus iPLA2β−/−; p53−/−. c qPCR of Ptgs2 mRNA from tumors harvested in (a). p = 0.00349 for control versus iPLA2β−/−. d A549 cells (Lanes 1, 2), p53−/− cells (lanes 3, 4), iPLA2β−/− cells (lanes 5, 6), or p53−/−; iPLA2β−/− cells (lanes 7, 8) treated with Nutlin 10 µM for 24 h (lanes 2, 4, 6, 8) versus control (lanes 1, 3, 5, 7) by the antibodies to iPLA2β, p53, p21or actin. The experiments were repeated twice, independently, with similar results. e Xenograft tumors from A549 CRISPR control, iPLA2β−/−, p53−/− or p53−/−; iPLA2β−/− cells as indicated. f Tumor weights were determined from (e) (error bars, from eight tumors). The experiments were repeated twice independently with similar results and representative data were shown. p = 0.00253 for A549 versus iPLA2β−/−; p = 0.686 for p53−/− versus iPLA2β−/−; p53−/−. g qPCR of Ptgs2 mRNA from tumors harvested in (e). p = 0.00000727 for A549 versus iPLA2β−/−. b, f Error bars are mean ± SEM. c, g Error bars are mean ± s.d., bc, fg n = 8 biologically independent samples. All p values were calculated using two-tailed unpaired Student’s t-test. Detailed statistical tests are described in the ‘Methods’. Source data are provided as a Source Data file.
Fig. 7
Fig. 7. Mechanistic insights into iPLA2β–mediated suppression of lipid peroxidation and ferroptosis induced by p53 and ROS stress.
a Western blot analysis of U2OS ACSL4−/−; GPX4−/− cells transfected with AlOX12 or iPLA2β vector. The experiments were repeated twice, independently, with similar results. b Lipid peroxidation levels of U2OS ACSL4−/−; GPX4−/− cells transfected with ALOX12 or iPLA2β vector were treated with TBH (300 μM) and Ferr-1 (2 μM) as indicated for 8 h. c Quantification of lipid peroxidation levels as shown in (b). Error bars are mean ± s.d., n = 3 independent experiments. d Western blot analysis of U2OS ACSL4−/−; GPX4−/− cells transfected with iPLA2β or iPLA2γ vector. The experiments were repeated twice, independently, with similar results. e Quantification of Lipid peroxidation levels. U2OS ACSL4−/−; GPX4−/− cells with overexpression of iPLA2β or iPLA2γ were pre-incubated with Nutlin (10 μM) for 12 h, then treated with TBH (300 μM) and Nutlin (10 μM) as indicated for 8 h. f Quantification of cell death. U2OS ACSL4−/−; GPX4−/− cells with overexpression of iPLA2β or iPLA2γ were pre-incubated with Nutlin (10 μM) for 24 h, then treated with TBH (250 μM) and Nutlin (10 μM) as indicated. g Relative content of oxPE (18:0/22:4)sn2 in H1299 cells transfected with alox12, or/and iPLA2β (PE, phosphatidylethanolamines). p values were calculated using two-tailed unpaired Student’s t-test. Detailed statistical tests are described in the ‘Methods’. h Relative content of oxPE (18:0/20:4)sn2 in H1299 cells transfected ALOX12, or/and iPLA2β. i Quantification of cell death in H1299 cells transfected with vector, p53, iPLA2β WT or G517C, and additional TBH treatment. ei Error bars are mean ± s.d., n = 3 biologically independent experiments. Source data are provided as a Source Data file.
Fig. 8
Fig. 8. The roles of ALOX12 and iPLA2β in regulating p53-mediated ferroptosis.
a Western blot analysis of extracts of U2OS CRISPR control (lanes 1, 2) or FSP1−/− cells (lanes 3, 4) with overexpression of iPLA2β-V5 (lanes 2, 4) versus empty vector (lanes 1, 3) by the antibodies to FSP1, V5, or actin. The experiments were repeated twice, independently, with similar results. b Quantification of cell death in the same cells as (a) treated with 250 μM TBH after pretreatment with Nutlin 10 μM for 24 h. Error bars are mean ± s.d., n = 3 biologically independent experiments. c A model for the roles of ALOX12 and iPLA2β in regulating p53-mediated ferroptosis. d Kaplan-Meier survival curve was generated for overall survival by stratifying patient samples with kidney renal clear cell carcinoma (TCGA, PanCancer Atlas) from cBioPortal based on iPLA2β expression levels. High-expression group was defined as mRNA expression z-score > 1 (PLA2G6: EXP > 1). e Kaplan-Meier survival curve was generated for overall survival by stratifying patient samples with acute myeloid leukemia (TCGA, PanCancer Atlas) from cBioportal based on iPLA2β expression levels. d, e p values were calculated using two-sided unpaired Student’s t-test. Detailed statistical tests are described in the ‘Methods’. Source data are provided as a Source Data file.

References

    1. Boutelle AM, Attardi LD. p53 and tumour suppression: it takes a network. Trends Cell Biol. 2021;31:298–310. doi: 10.1016/j.tcb.2020.12.011. - DOI - PMC - PubMed
    1. Liu Y, Tavana O, Gu W. p53 Modifications: exquisite decorations of the powerful guardian. J. Mol. Cell Biol. 2020;11:564–577. doi: 10.1093/jmcb/mjz060. - DOI - PMC - PubMed
    1. Karni-Schmidt O, Lokshin M, Prives C. The roles of MDM2 and MDMX in cancer. Annu. Rev. Pathol. 2016;11:617–644. doi: 10.1146/annurev-pathol-012414-040349. - DOI - PMC - PubMed
    1. Mullard A. p53 Programmes plough on. Nat. Rev. Drug Discov. 2020;19:497–500. doi: 10.1038/d41573-020-00130-z. - DOI - PubMed
    1. Humpton T, Vousden KH. Taking up the reins of power: metabolic functions of p53. J. Mol. Cell Biol. 2019;11:610–614. doi: 10.1093/jmcb/mjz065. - DOI - PMC - PubMed

Publication types

MeSH terms