. 2021 Jun 15;12(1):3638.
doi: 10.1038/s41467-021-23643-6.

Integrated analysis of Xist upregulation and X-chromosome inactivation with single-cell and single-allele resolution

Affiliations

Integrated analysis of Xist upregulation and X-chromosome inactivation with single-cell and single-allele resolution

Guido Pacini et al. Nat Commun. .

Abstract

To ensure dosage compensation between the sexes, one randomly chosen X chromosome is silenced in each female cell in the process of X-chromosome inactivation (XCI). XCI is initiated during early development through upregulation of the long non-coding RNA Xist, which mediates chromosome-wide gene silencing. Cell differentiation, Xist upregulation and gene silencing are thought to be coupled at multiple levels to ensure inactivation of exactly one out of two X chromosomes. Here we perform an integrated analysis of all three processes through allele-specific single-cell RNA-sequencing. Specifically, we assess the onset of random XCI in differentiating mouse embryonic stem cells, and develop dedicated analysis approaches. By exploiting the inter-cellular heterogeneity of XCI onset, we identify putative Xist regulators. Moreover, we show that transient Xist upregulation from both X chromosomes results in biallelic gene silencing right before transitioning to the monoallelic state, confirming a prediction of the stochastic model of XCI. Finally, we show that genetic variation modulates the XCI process at multiple levels, providing a potential explanation for the long-known X-controlling element (Xce) effect, which leads to preferential inactivation of a specific X chromosome in inter-strain crosses. We thus draw a detailed picture of the different levels of regulation that govern the initiation of XCI. The experimental and computational strategies we have developed here will allow us to profile random XCI in more physiological contexts, including primary human cells in vivo.


Conflict of interest statement

The authors declare no competing interests.

Figures

Fig. 1
Fig. 1. Profiling the onset of random XCI by scRNA-seq.
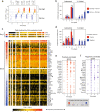
a Schematic representation of the experimental setup. A female mESC line derived from the cross between a B6 (green) and a Cast (orange) mouse was differentiated for 4 days by 2i/Lif withdrawal and up to 400 single-cell transcriptomes were collected per time point. During the time course, cells initiate random XCI by monoallelic upregulation of Xist (black) from one randomly chosen allele, which will induce chromosome-wide gene silencing. b, c Pseudotime analysis (b) and UMAP embedding (c) based on the 500 most variable genes, with individual cells colored by measurement time. The black line in b represents the principal graph describing the pseudotime trajectory of the projected cells as computed by the Monocole2 DDRTree method. Arrows in c indicate the predicted transcriptome change estimated through RNA velocity analysis. d UMAP embedding as in c with cells colored according to marker gene expression. e Distribution of Xist expression across cells, either shown as the number of UMI counts (=number of molecules, left), the normalized CPM value (middle) or the percentage of Xist-positive (>5 Xist UMI counts) cells (right). f Box plot of the X-to-autosome expression ratio in Xist-positive (pink) and Xist-negative cells (black). The central mark indicates the median, and the bottom and top edges of the box indicate the first and third quartiles, respectively. The top and bottom whiskers extend the boxes to a maximum of 1.5 times the interquartile range. Dots represent individual cells, the number of cells in each group is given on top. g UMAP embedding as in (c) with Xist-positive and Xist-negative cells colored according to X-to-autosome expression ratio. Color scale was centered (gray) on the median X-to-autosome expression ratio observed at day 0. Source data are provided as a Source Data file.
Fig. 2
Fig. 2. Allele-specific analysis of Xist expression.
a Scatter plot showing Xist UMI counts mapping to the B6 and Cast chromosome in individual cells. Cell coloring indicates the Xist pattern classification, where Xist detection from only one allele is termed monoallelic (MA, orange, green). Detection of both chromosomes is termed biallelic (BA, pink), if at least 20% of UMI counts come from each allele, or termed skewed (light pink) if one allele contributes <20% of reads. b Relative distribution of Xist patterns as in (a) across time. c RNA FISH of Xist under the same conditions as in (a, b). The bar graph (left) shows quantification of three biological replicates over time (100 cells were counted for each). An example image at day 2 of differentiation (right) is shown, where dotted lines indicate the outline of cell nuclei stained with Dapi (blue). d Violin plot comparing Xist allelic expression levels from the B6 (green) and Cast chromosomes (orange) in Xist-MA cells. The horizontal line indicates the median value and p values of a Mann–Whitney U two-sided test are shown. Source data are provided as a Source Data file.
Fig. 3
Fig. 3. Chromosome-wide gene silencing dynamics.
a Violin plot showing the distribution of the allelic expression ratio for the entire X chromosome excluding Xist, as the fraction of X-chromosomal reads mapping to the B6 chromosome, in Xist-positive (pink) and Xist-negative cells (black). Horizontal lines indicate the median values. b Scatter plots showing spliced (top) and unspliced (bottom) reads mapping to the X chromosome on the B6 and Cast alleles. Cells are colored by Xist expression pattern as in Fig. 2a and indicated in the gray box on the right. c The first two principal components, computed on the allelic expression ratio for all X-linked genes with the color indicating the chromosome-wide allelic fraction. Arrows indicate the predicted change of the X-linked allelic fraction based on RNA velocity analysis. d Scatter plot showing the X-chromosomal allelic fraction vs. Xist’s allelic fraction, for cells with >5 allele-specific Xist UMI counts. e Box plot showing the X:A expression ratio in cells assigned to different Xist classes, as indicated in the gray box above the plot, based on allele-specific mapping as in Fig. 2a. The central mark indicates the median, and the bottom and top edges of the box indicate the first and third quartiles, respectively. The top and bottom whiskers extend the boxes to a maximum of 1.5 times the interquartile range. Dots represent individual cells and cell numbers are indicated on top. Source data are provided as a Source Data file.
Fig. 4
Fig. 4. Identification of putative Xist regulators.
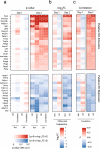
a Cell classification according to Xist expression levels. The three highest and lowest cell clusters from a K-means (K = 7) clustering were defined as Xist-high (yellow/red) and Xist-low (blue), respectively. b Number of differentially expressed genes (DEGs), excluding Xist, between Xist-high and Xist-low cells (the number of cells assigned to the two Xist groups is shown in (a)) on autosomes (left, 8880 tested genes) and on the X chromosome (right, 374 tested genes) identified by a χ2 likelihood ratio test with MAST DE (Benjamini–Hochberg (BH) corrected p value ≤ 0.05). c Heatmaps showing expression of DEGs (rows) with absolute fold change between Xist-high and Xist-low cells above 1.5 at day 1 (top) or day 2 (bottom) in single cells (columns). Cells are ordered by Xist expression level and grouped according to the clustering shown in (a). Genes are ordered by decreasing fold change. X-linked genes with Xist-low > Xist-high are not shown. d Number of genes, excluding Xist, whose expression is positively (red) or negatively (blue) correlated with Xist expression (Spearman’s correlation test, BH-corrected p value ≤ 0.05) across cells of the same time point. e, f Spearman’s correlation coefficients with Xist expression for positively correlated genes (e) and negatively correlated autosomal genes (f), excluding pseudogenes. Top 20 genes that exhibit a significant correlation (Spearman’s correlation test, BH-corrected p value ≤ 0.05) at day 1 or 2 are shown, ordered by decreasing absolute correlation coefficient. Size and color indicate the correlation coefficient as indicated. White dots represent significant correlations. Exact p values are provided in Supplementary Data 3. Source data are provided as a Source Data file.
Fig. 5
Fig. 5. Putative regulators of XCI initiation.
ac Summary of putative regulators of early XCI identified through correlation and differential expression (DE) analyses based on Xist expression and early gene silencing (ΔX) at day 1 and 2 of differentiation. For all genes identified in at least 3 of the 8 analyses (BH-corrected p value ≤ 0.05, asterisks), excluding pseudogenes and X-linked genes with a negative correlation coefficient ρ or log2FC, the BH-corrected p value in (a), the log2-transformed fold change (log2FC) in (b), and Spearman’s correlation coefficient ρ in (c) are shown. Source data are provided as a Source Data file.
Fig. 6
Fig. 6. Allelic silencing dynamics.
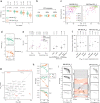
a Xi:Xa expression ratio for cells that inactivate the B6 (green) and Cast chromosome (orange), excluding reads mapping to Xist. The central mark indicates the median, and the bottom and top edges of the box indicate the first and third quartiles, respectively. The top and bottom whiskers extend the boxes to a maximum of 1.5 times the interquartile range. Dots represent individual cells and cell numbers are indicated on top; p values of a Mann–Whitney U two-sided test are shown. b Schematic representation of XCI progress (XP), defined as the percentage of silencing. c Comparison of XCI progress with scaled pseudotime as in Fig. 1b for MA-B6 (left) and MA-Cast cells (right). Cells are colored according to measurement time point. Only cells with XP ≥ 10% (vertical dashed line) were included in the differential silencing analysis in (di). d Estimation of allele-specific silencing dynamics shown for an example gene (Eif1ax). Transparent dots indicate individual cells and solid dots the binned values for cells with similar XCI progress. The solid line shows the log-linear fit, used to estimate the XP50 value (dashed arrows), which describes the global XCI progress at which a given gene is silenced by 50%. e Comparison of the estimated XP50 values with previously determined silencing classes,,. Dots represent individual genes and the horizontal bars show the median value. The number of genes in each group are given on top. f Genomic distance from the Xist gene for genes grouped according to their XP50 values (K-means clustering with K = 4) on the B6 (left, 74 genes) and Cast chromosomes (right, 35 genes), respectively. Dots represent individual genes and the horizontal bars show the median value. The number of genes in each group is given on top. g, h Comparison of XP50 values estimated for the B6 and Cast chromosomes. Genes with significantly different silencing dynamics (ANOVA F test: BH-corrected p value ≤ 0.05) are colored in red and shown in (h). i K-means clustering of genes according to their allelic XP50 value as in (f). Connecting bars in the center compare classification for genes that could be analyzed on both chromosomes (35 genes). Gray bars indicate genes that were assigned to the same cluster for the two alleles, light red indicates genes that were classified in neighboring clusters and dark red are genes that are part of more distant clusters. Source data are provided as a Source Data file.
Fig. 7
Fig. 7. Experimental validation of differential silencing dynamics.
a To measure allele-specific silencing dynamics, the X inactivation center (Xic), which contains the Xist locus, was deleted on either the Cast (top) or on the B6 allele (bottom). Upon differentiation, the entire cell population will thus initiate XCI on the B6 and Cast allele, respectively, allowing quantification of allele-specific silencing dynamics by bulk RNA-sequencing, as shown in (bd). bd RNA-seq differentiation time course of the cell lines shown in (a). b Xist expression. Horizontal bars represent the mean of three biological replicates, dots the individual measurements, significance (p values) of the difference between the two cell lines according to a two-sample two-sided unpaired Student’s t test is indicated. c Xi:Xa expression ratios for all X-linked genes outside the deleted region (n = 660 genes) averaged across n = 3 biological replicates. Significance (p values) of the difference between the two cell lines according to a two-sample two-sided paired Student’s t test is indicated. The central mark indicates the median, and the bottom and top edges of the box indicate the first and third quartiles, respectively. The top and bottom whiskers extend the boxes to a maximum of 1.5 times the interquartile range. Outliers are not shown. d Xi:Xa expression ratios for differentially silenced genes, as identified in Fig. 6, normalized to the average ratio on the pre-XCI state (day 0, dashed line). Horizontal bars represent the mean of three biological replicates, dots the individual measurements. In addition, p values of a two-sample unpaired two-sided Student’s t test comparing the two cell lines are shown. Source data are provided as a Source Data file. Source Data

Similar articles

Cited by

References

    1. Galupa R, Heard E. X-chromosome inactivation: new insights into cis and trans regulation. Curr. Opin. Genet. Dev. 2015;31:57–66. doi: 10.1016/j.gde.2015.04.002. - DOI - PubMed
    1. Mutzel V, Schulz EGDosage. Sensing, threshold responses, and epigenetic memory: a systems biology perspective on random X-chromosome inactivation. Bioessays. 2020;42:e1900163. doi: 10.1002/bies.201900163. - DOI - PubMed
    1. Balaton BP, Brown CJ. Escape artists of the X chromosome. Trends Genet. 2016;32:348–359. doi: 10.1016/j.tig.2016.03.007. - DOI - PubMed
    1. Snell DM, Turner JMA. Sex chromosome effects on male-female differences in mammals. Curr. Biol. 2018;28:R1313–R1324. doi: 10.1016/j.cub.2018.09.018. - DOI - PMC - PubMed
    1. Peeters SB, Yang C, Brown CJ. Have humans lost control: the elusive X-controlling element. Semin. Cell Dev. Biol. 2016;56:71–77. doi: 10.1016/j.semcdb.2016.01.044. - DOI - PubMed

Publication types