

Adipogenesis in triple-negative breast cancer is associated with unfavorable tumor immune microenvironment and with worse survival
- PMID: 34131208
- PMCID: PMC8206113
- DOI: 10.1038/s41598-021-91897-7
Adipogenesis in triple-negative breast cancer is associated with unfavorable tumor immune microenvironment and with worse survival
Abstract
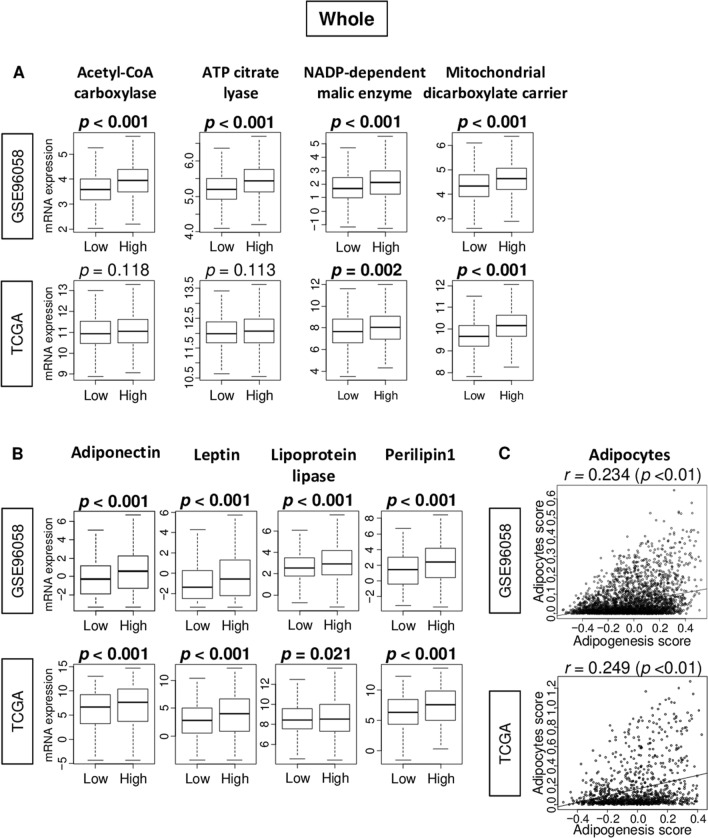
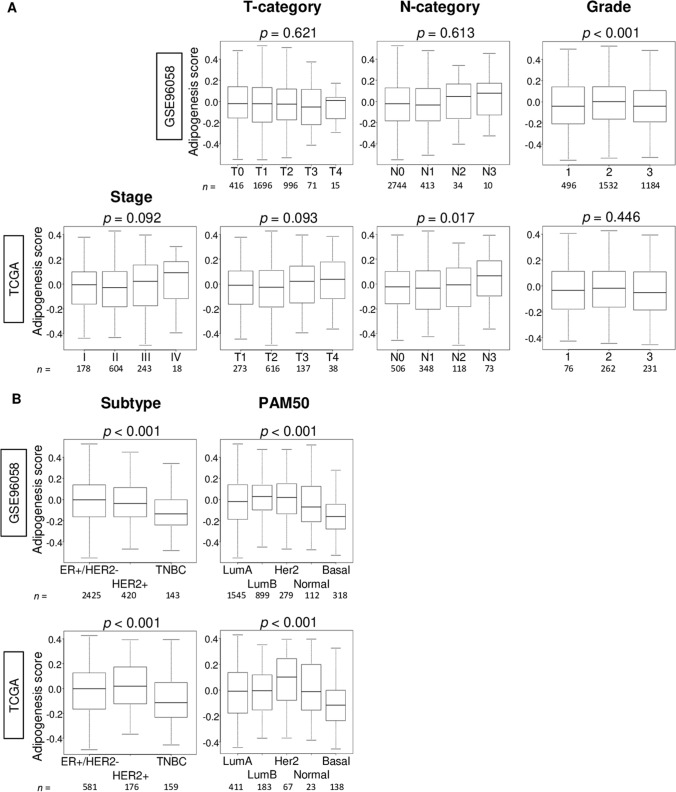
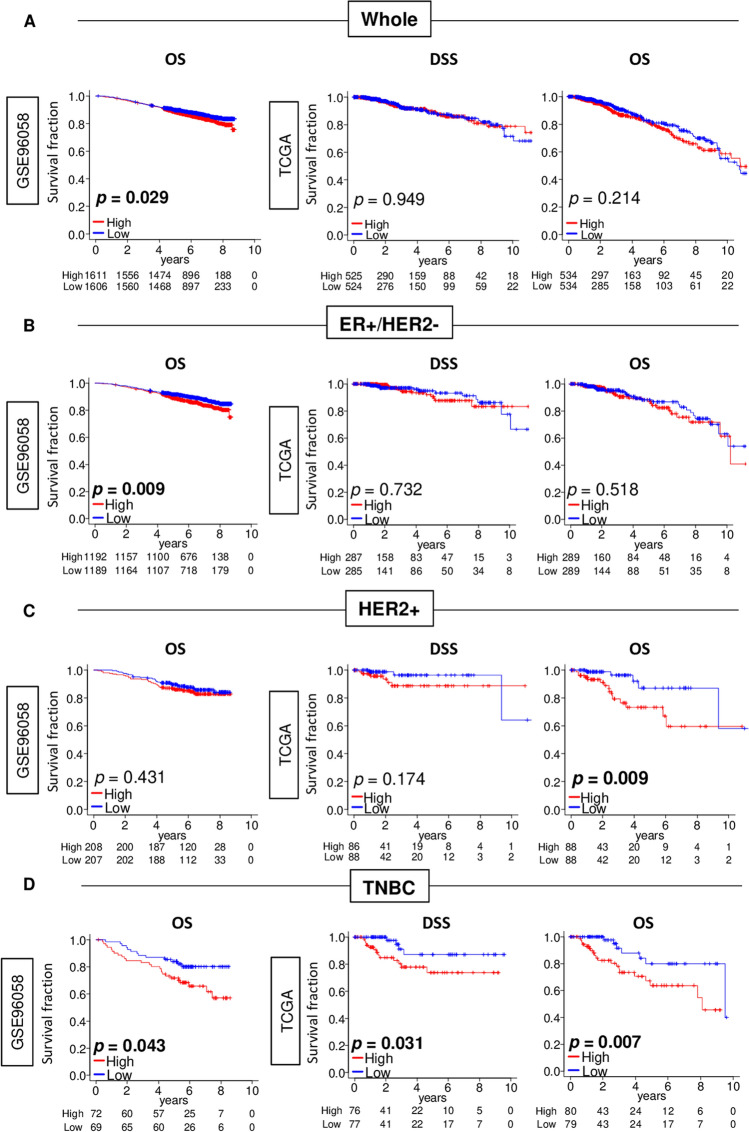
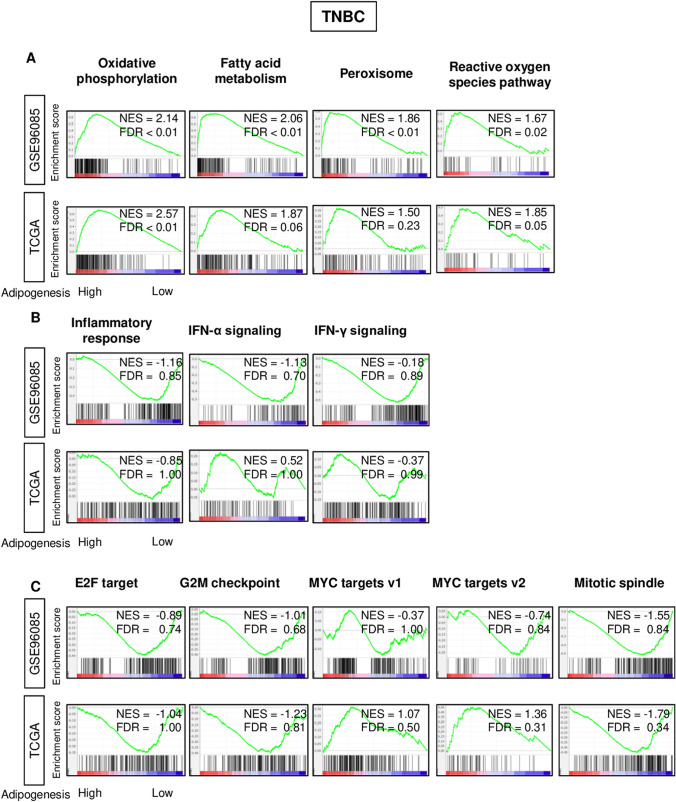
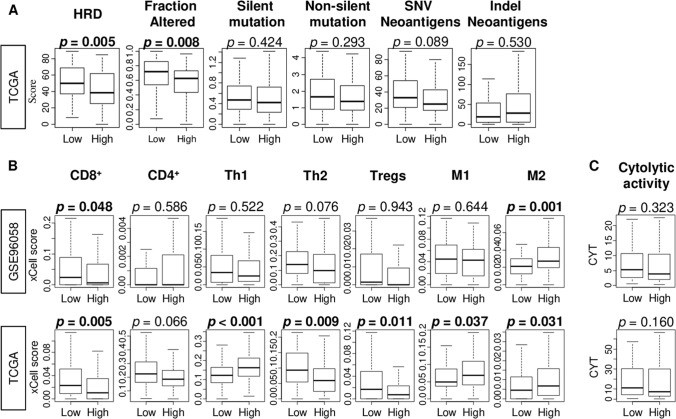
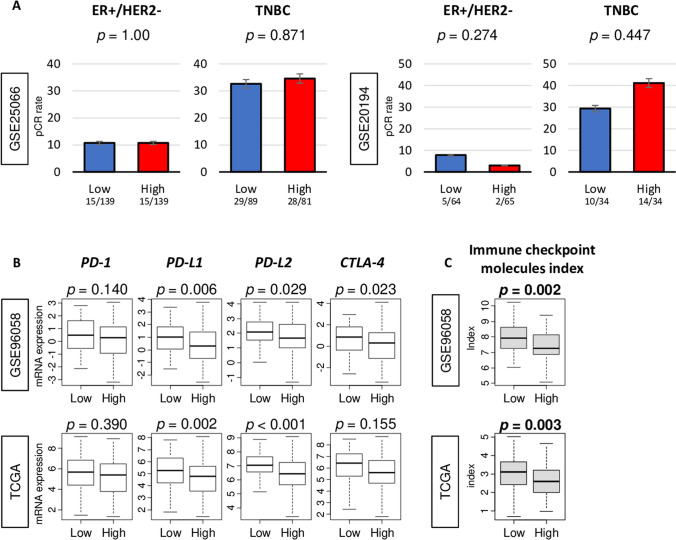
Cancer-associated adipocytes are known to cause inflammation; however, the role of adipogenesis, the formation of adipocytes, in breast cancer is unclear. We hypothesized that intra-tumoral adipogenesis reflects a different cancer biology than abundance of intra-tumoral adipocytes. The Molecular Signatures Database Hallmark adipogenesis gene set of gene set variant analysis was used to quantify adipogenesis. Total of 5,098 breast cancer patients in multiple cohorts (training; GSE96058 (n = 3273), validation; TCGA (n = 1069), treatment response; GSE25066 (n = 508) and GSE20194 (n = 248)) were analyzed. Adipogenesis did not correlate with abundance of adipocytes. Adipogenesis was significantly lower in triple negative breast cancer (TNBC). Elevated adipogenesis was significantly associated with worse survival in TNBC, but not in the other subtypes. High adipogenesis TNBC was significantly associated with low homologous recombination deficiency, but not with mutation load. High adipogenesis TNBC enriched metabolism-related gene sets, but neither of cell proliferation- nor inflammation-related gene sets, which were enriched to adipocytes. High adipogenesis TNBC was infiltrated with low CD8+ T cells and high M2 macrophages. Although adipogenesis was not associated with neoadjuvant chemotherapy response, high adipogenesis TNBC was significantly associated with low expression of PD-L1 and PD-L2 genes, and immune checkpoint molecules index. In conclusion, adipogenesis in TNBC was associated with cancer metabolism and unfavorable tumor immune microenvironment, which is different from abundance of adipocytes.
Conflict of interest statement
The authors declare no competing interests.
Figures
Similar articles
-
Molecular and Immune Correlates of PDCD1 (PD-1), PD-L1 (CD274), and PD-L2 (PDCD1LG2) DNA Methylation in Triple Negative Breast Cancer.J Immunother. 2021 Oct 1;44(8):319-324. doi: 10.1097/CJI.0000000000000384. J Immunother. 2021. PMID: 34347720
-
ALG3 predicts poor prognosis and increases resistance to anti-PD-1 therapy through modulating PD-L1 N-link glycosylation in TNBC.Int Immunopharmacol. 2024 Oct 25;140:112875. doi: 10.1016/j.intimp.2024.112875. Epub 2024 Aug 9. Int Immunopharmacol. 2024. PMID: 39116492
-
Multispectral quantitative immunohistochemical analysis of tumor-infiltrating lymphocytes in relation to programmed death-ligand 1 expression in triple-negative breast cancer.Breast Cancer. 2020 Jul;27(4):519-526. doi: 10.1007/s12282-020-01110-2. Epub 2020 May 23. Breast Cancer. 2020. PMID: 32447649
-
A Systematic Review on the Therapeutic Potentiality of PD-L1-Inhibiting MicroRNAs for Triple-Negative Breast Cancer: Toward Single-Cell Sequencing-Guided Biomimetic Delivery.Genes (Basel). 2021 Aug 4;12(8):1206. doi: 10.3390/genes12081206. Genes (Basel). 2021. PMID: 34440380 Free PMC article.
-
Checkpoint inhibitors in triple-negative breast cancer (TNBC): Where to go from here.Cancer. 2018 May 15;124(10):2086-2103. doi: 10.1002/cncr.31272. Epub 2018 Feb 9. Cancer. 2018. PMID: 29424936 Review.
Cited by
-
Acquired lymphedema: Molecular contributors and future directions for developing intervention strategies.Front Pharmacol. 2022 Oct 25;13:873650. doi: 10.3389/fphar.2022.873650. eCollection 2022. Front Pharmacol. 2022. PMID: 36386144 Free PMC article. Review.
-
Analyses of Transcriptomics Cell Signalling for Pre-Screening Applications in the Integrated Approach for Testing and Assessment of Non-Genotoxic Carcinogens.Int J Mol Sci. 2022 Oct 22;23(21):12718. doi: 10.3390/ijms232112718. Int J Mol Sci. 2022. PMID: 36361516 Free PMC article. Review.
-
CSN-CRL Complexes: New Regulators of Adipogenesis.Biomolecules. 2025 Mar 5;15(3):372. doi: 10.3390/biom15030372. Biomolecules. 2025. PMID: 40149914 Free PMC article. Review.
-
Resistance to neoadjuvant chemotherapy in breast cancers: a metabolic perspective.J Exp Clin Cancer Res. 2025 Aug 11;44(1):234. doi: 10.1186/s13046-025-03500-w. J Exp Clin Cancer Res. 2025. PMID: 40790759 Free PMC article. Review.
-
Characterization of cancer-related fibroblasts (CAF) in hepatocellular carcinoma and construction of CAF-based risk signature based on single-cell RNA-seq and bulk RNA-seq data.Front Immunol. 2022 Sep 23;13:1009789. doi: 10.3389/fimmu.2022.1009789. eCollection 2022. Front Immunol. 2022. PMID: 36211448 Free PMC article.
References
Publication types
MeSH terms
Substances
Grants and funding
LinkOut - more resources
Full Text Sources
Research Materials
Miscellaneous
