. 2021 Jun 15;11(1):12561.
doi: 10.1038/s41598-021-92008-2.

Fatty acids suppress the steroidogenesis of the MA-10 mouse Leydig cell line by downregulating CYP11A1 and inhibiting late-stage autophagy

Affiliations

Fatty acids suppress the steroidogenesis of the MA-10 mouse Leydig cell line by downregulating CYP11A1 and inhibiting late-stage autophagy

Chien Huang et al. Sci Rep. .

Abstract

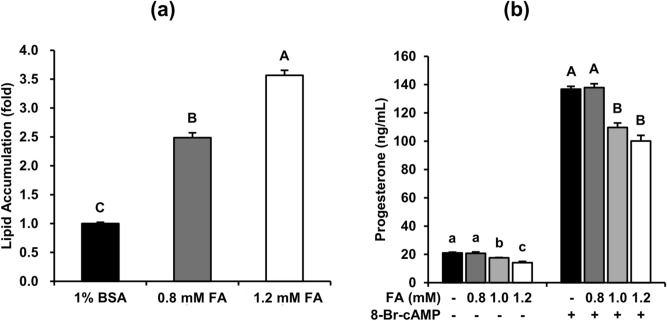
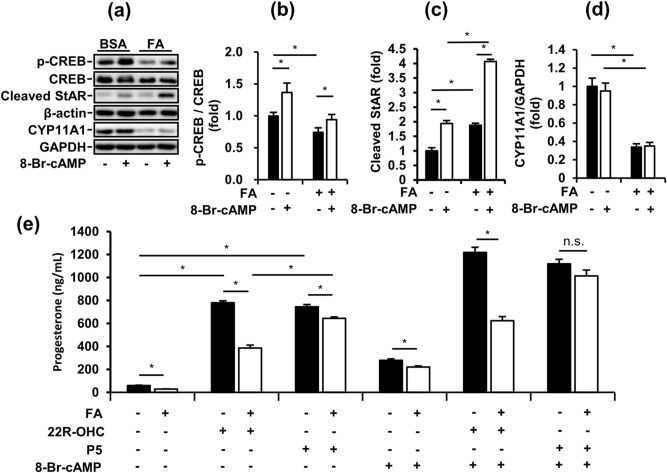
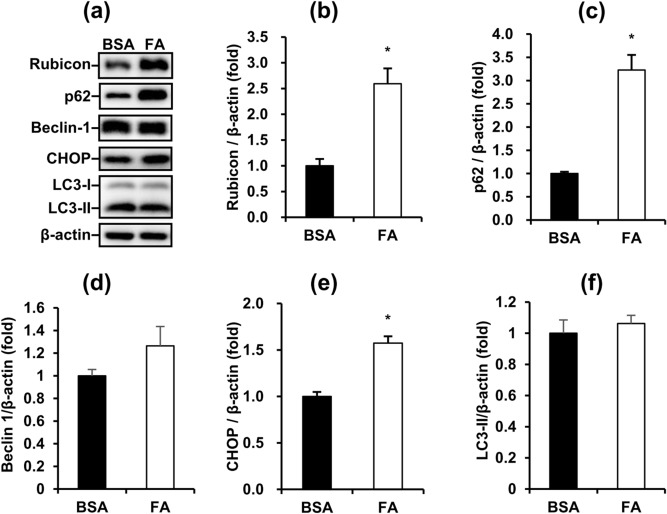
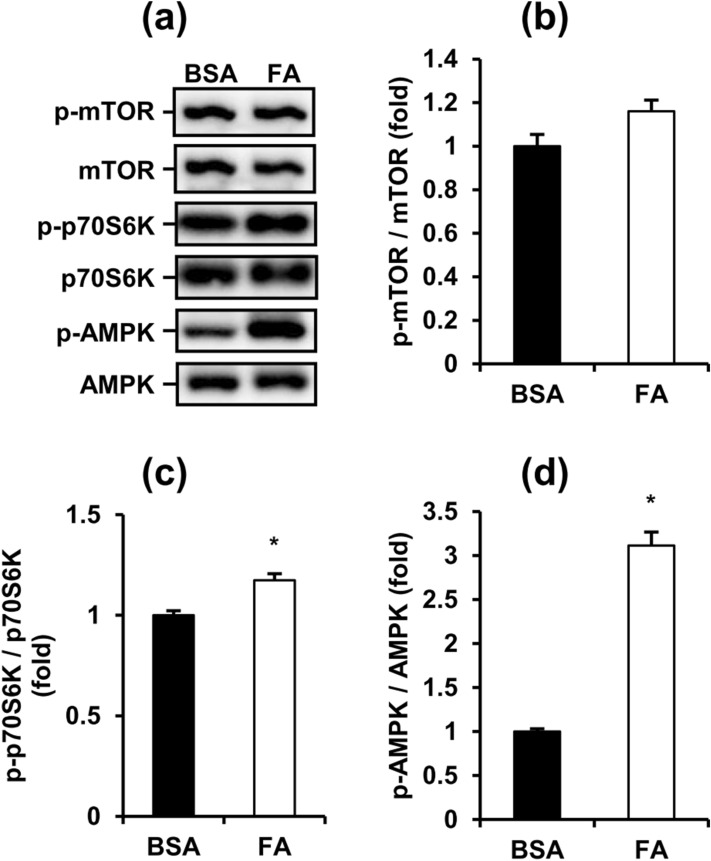
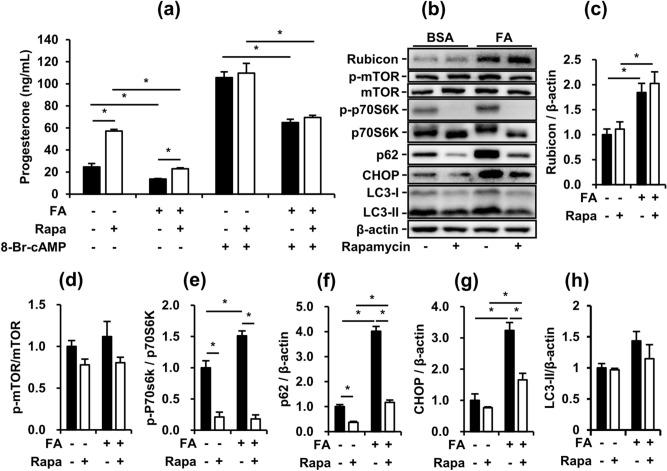
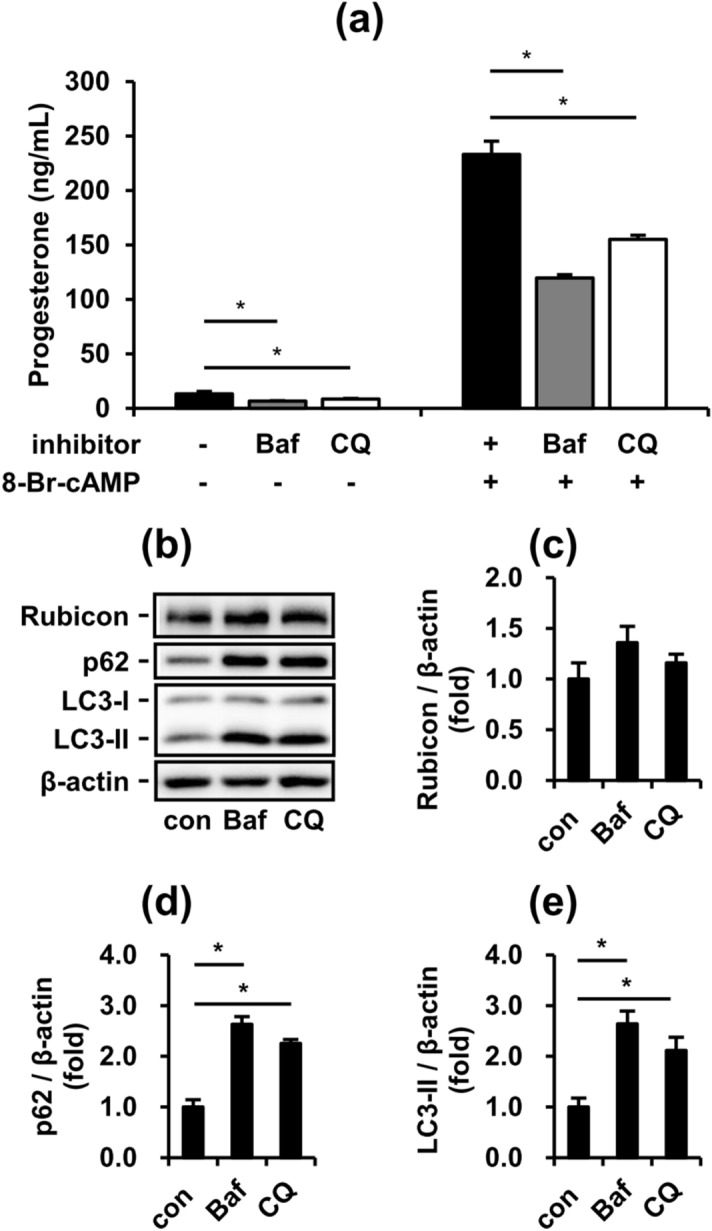
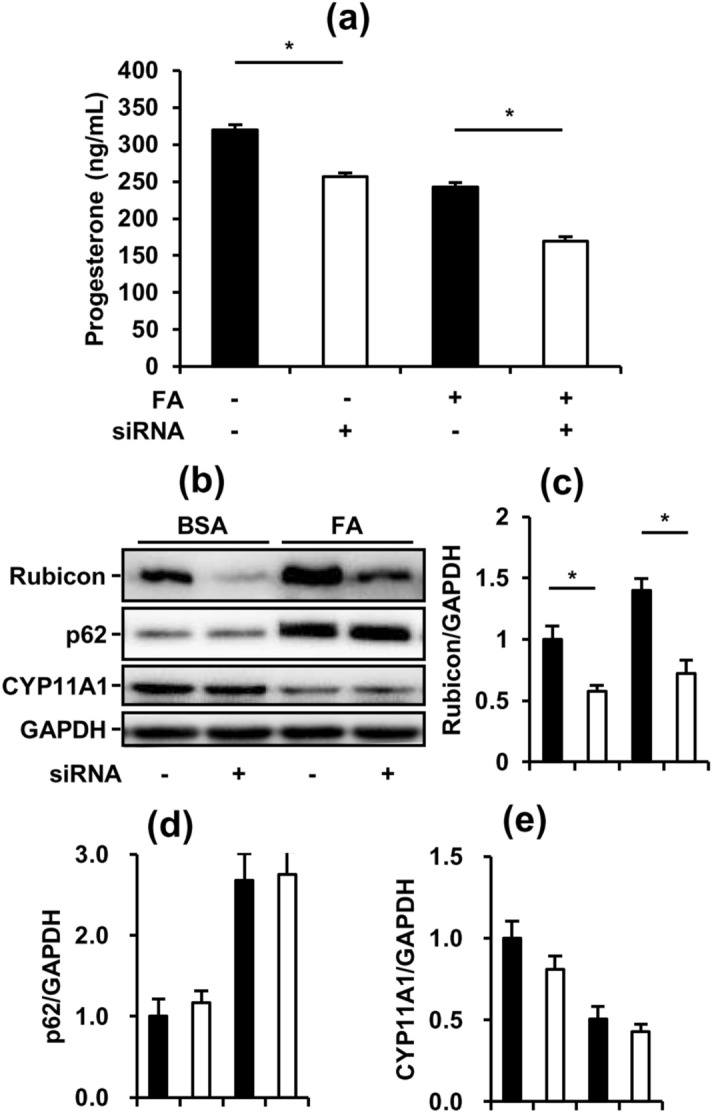
Obese men have lower circulating testosterone than men with an optimal body mass index. Elevated fatty acids (FAs) caused by obesity have been reported to suppress the steroidogenesis of Leydig cells. Recent studies have demonstrated that autophagy regulates steroidogenesis in endocrine cells; however, few studies have investigated the molecular mechanisms of FA-impaired steroidogenesis. To study FA regulation in the steroidogenesis of Leydig cells, MA-10 cells were treated with an FA mixture and co-treated with 8-Br-cAMP to stimulate the steroidogenesis capacity. We showed that FAs led to cellular lipid accumulation and decreased steroidogenesis of MA-10 cells, and FA-suppressed steroidogenesis was largely recovered by P5 treatment but not by 22R-OHC treatment, suggesting the primary defect was the deficiency of CYP11A1. To examine the involvement of autophagy in the steroidogenesis of Leydig cells, we treated MA-10 cells with autophagy regulators, including rapamycin, bafilomycin, and chloroquine. Inhibition of late-stage autophagy including FA-upregulated Rubicon suppressed the steroidogenesis of MA-10 cells. More interestingly, Rubicon played a novel regulatory role in the steroidogenesis of MA-10 cells, independent of inhibitors of late-stage autophagy. Collectively, this study provides novel targets to investigate the interaction between FAs and steroidogenesis in steroidogenic cells.


Conflict of interest statement

The authors declare no competing interests.

Figures

Figure 1
Figure 1
Fatty acids induce lipid accumulation and inhibit the steroidogenesis of MA-10 cells. MA-10 cells were treated with 1% BSA, 0.8 mM (0.4 mM PA mixed with 0.4 mM OA) to 1.2 mM fatty acids (0.6 mM PA mixed with 0.6 mM OA) for 48 h. The cells were then stained with Nile Red to quantify lipid accumulation and with Hoechst 33,342 to normalize the cell numbers. (a) The relative lipid accumulation under different FA dosages is shown as the means ± standard errors of the mean (SEM) (n = 3). After FA treatment for 48 h, MA-10 cells were treated with or without 50 µM 8-Br-cAMP for 4 additional hours to induce steroidogenesis. Conditioned medium was then collected to measure steroidogenesis. (b) The progesterone levels in the conditioned medium are shown as means ± SEM (n = 3). Different letters represent a significant difference between groups analyzed by one-way ANOVA followed with Duncan’s multiple comparisons (p < 0.05).
Figure 2
Figure 2
Fatty acid-suppressed steroidogenesis through impaired steroidogenic signaling is largely recovered by P5 treatment in MA-10 cells. (a) Representative blots in FA-induced MA-10 cells after 4-h 8-Br-cAMP treatment are shown. (b), (c), (d) Quantifications of blots normalized by β-actin or GAPDH are shown as means ± SEM (n = 3). (e) The progesterone levels from FA-induced MA-10 cells treated with or without 50 µM 8-Br-cAMP, 1 µg/mL of P5 and 10 µg/mL of 22R-OHC for 4 additional hours. The data are represented as means ± SEM (n = 3). *P < 0.05. n.s.: no significant difference.
Figure 3
Figure 3
Fatty acids disrupt autophagy and increase ER stress in MA-10 cells. (a) Representative blots of autophagy and ER stress markers in FA-induced MA-10 cells are shown. (b), (c), (d), (e), (f) Quantification of blots normalized by β-actin are shown as means ± SEM (n = 3). *P < 0.05.
Figure 4
Figure 4
Fatty acids simultaneously activate the inhibition and induction signaling of early-stage autophagy in MA-10 cells. (a) Representative blots of mTOR and AMPK signaling in FA-induced MA-10 cells are shown. (b), (c), (d) Quantification of blots normalized by β-actin are shown as means ± SEM (n = 3). *P < 0.05.
Figure 5
Figure 5
Rapamycin partially restores FA-suppressed basal steroidogenesis of MA-10 cells. After treatment with FA for 48 h and co-treatment with 10 nM rapamycin in the last 24 h, MA-10 cells were treated with or without 50 µM 8-Br-cAMP for 4 additional hours to induce steroidogenesis. (a) Progesterone levels in conditioned medium from the assigned groups of MA-10 cells. (b) Representative blots of autophagy and ER stress markers in cultured MA-10 cells are shown. (c), (d), (e), (f), (g), (h) Quantifications normalized by β-actin are shown as means ± SEM (n = 3). *P < 0.05.
Figure 6
Figure 6
Inhibition of autophagy suppresses both basal and stimulated steroidogenesis of MA-10 cells. To further investigate the effects of inhibited autophagy in MA-10 cells, we applied two late-stage autophagy inhibitors, bafilomycin A1 (Baf) and chloroquine (CQ). After treatment with or without 50 nM Baf and 20 µM CQ for 24 h, the conditioned medium and cell lysates from cultured MA-10 cells were collected for further analysis. (a) Progesterone levels in condition medium from the assigned groups of MA-10 cells. (b) Representative blots of autophagy markers in cultured MA-10 cells. (c), (d), (e) Quantifications normalized by β-actin are shown as means ± SEM (n = 4). *P < 0.05.
Figure 7
Figure 7
Rubicon plays an indispensable role in maintaining and regulating the steroidogenesis of MA-10 cells, independent of the inhibition of late-stage autophagy. To further check the effects of late-stage autophagy inhibition on FA-suppressed steroidogenesis, we applied siRNAs to knock down Rubicon. After transfection with or without 10 nM Rubcn siRNAs for 72 h and treatment with 1% BSA or 1200 µM fatty acids (0.6 mM PA mixed with 0.6 mM OA) in the last 48 h, the conditioned medium and cell lysates from cultured MA-10 cells were collected for further analysis. (a) Progesterone levels in condition medium from the assigned groups of MA-10 cells. (b) Representative blots of autophagy and steroidogenesis markers in cultured MA-10 cells. (c), (d), (e) Quantifications normalized by GAPDH are shown as the means ± SEM (n = 3). *P < 0.05.

References

    1. Eisenberg ML, et al. The relationship between male BMI and waist circumference on semen quality: Data from the LIFE study. Hum. Reprod. 2013;29:193–200. doi: 10.1093/humrep/det428. - DOI - PMC - PubMed
    1. Sallmén M, Sandler DP, Hoppin JA, Blair A, Baird DD. Reduced fertility among overweight and obese men. Epidemiology. 2006;17:520–523. doi: 10.1097/01.ede.0000229953.76862.e5. - DOI - PubMed
    1. Sermondade N, et al. BMI in relation to sperm count: An updated systematic review and collaborative meta-analysis. Hum. Reprod. Update. 2012;19:221–231. doi: 10.1093/humupd/dms050. - DOI - PMC - PubMed
    1. Bekaert M, et al. Determinants of testosterone levels in human male obesity. Endocrine. 2015;50:202–211. doi: 10.1007/s12020-015-0563-4. - DOI - PMC - PubMed
    1. Meikle AW, Benson SJ, Liu XH, Boam WD, Stringham JD. Nonesterified fatty acids modulate steroidogenesis in mouse Leydig cells. Am. J. Physiol. 1989;257:E937–E942. - PubMed

Publication types

MeSH terms