. 2020;128(7):10.1063/5.0011247.
doi: 10.1063/5.0011247.

Extracting electron densities in n-type GaAs from Raman spectra: Comparisons with Hall measurements

Affiliations

Extracting electron densities in n-type GaAs from Raman spectra: Comparisons with Hall measurements

Maicol A Ochoa et al. J Appl Phys. 2020.

Abstract

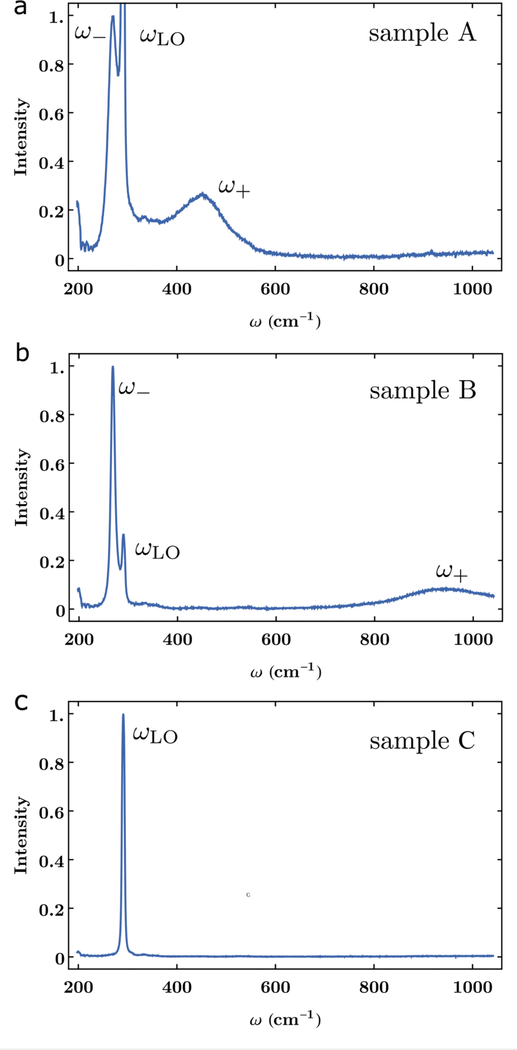
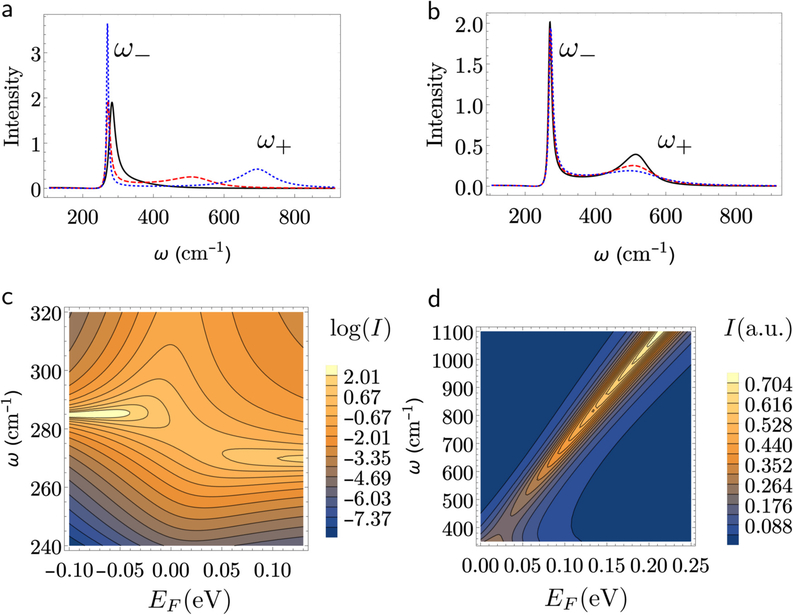
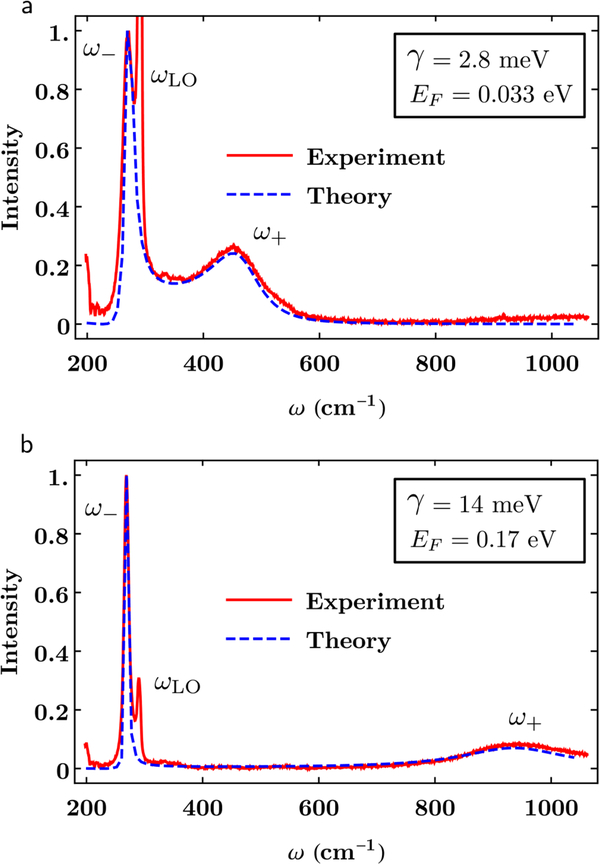
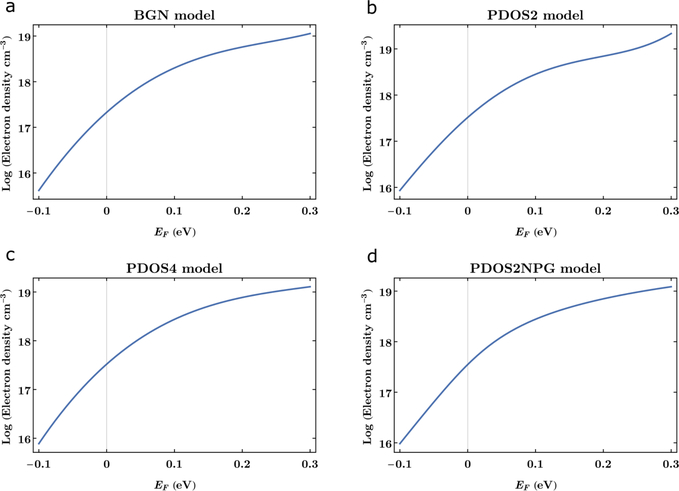
We demonstrate quantitatively how values of electron densities in GaAs extracted from Raman spectra of two samples depend on models used to describe electric susceptibility and band structure. We, therefore, developed a theory that is valid for any temperature, doping level, and energy ratio proportional to q 2=(ω + ) (where q is the magnitude of wave vector, ω is Raman frequency, and γ is plasmon damping). We use a full Mermin-Lindhard description of Raman line shape and compare n-type GaAs spectra obtained from epilayers with our simulated spectra. Our method is unique in two ways: (1) we do a sensitivity analysis by employing four different descriptions of the GaAs band structure to give electron densities as functions of Fermi energies and (2) one of the four band structure descriptions includes bandgap narrowing that treats self-consistently the many-body effects of exchange and correlation in distorted-electron densities of states and solves the charge neutrality equation for a two-band model of GaAs at 300 K. We apply these results to obtain electron densities from line shapes of Raman spectra and thereby demonstrate quantitatively how the values of electron densities extracted from Raman spectra of n-type GaAs depend of various models for susceptibility and band structure.


Figures

FIG. 1.
FIG. 1.
Experimental Raman line shapes measured on samples of GaAs with nominal values on the electron densities Ne. (a) Ne = 1:4 × 1018 cm−3. (b) Ne = 5:8 × 1018 cm−3. (c) Ne = 5.2 − 8:4 × 106 cm−3 The line shape in (c), corresponding to a sample with low electron density, reveals a single peak for the longitudinal optical mode ωLO in GaAs. As the electron density increases, local plasmons develop, which couple to the LO mode. The resulting coupled states appear as two additional peaks in the Raman spectra ω and ω+ in (a) and (b). We notice that the frequencies ω and ω+, as well as their broadening, are sensitive to the dopant concentration of the sample. The intensity is normalized to the maximum signal in ωLO for (c) and ω in (a) and (b).
FIG. 2.
FIG. 2.
Raman scattering line shapes obtained from Eq. (8) for model systems. (a) Line shape as a function of the incident frequency ω for three different values of the Fermi energy EF at a fix damping rate of γ = 7 meV, EF = 0 eV (black, solid), EF = 0:05 eV (red, dashed), and EF = 0:10 eV (blue, dotted). (b) line shape for different values in the damping energy γ at a fix value Fermi energy EF = 0:05 eV, γ = 3:5 meV (black, solid), γ = 7 meV (red, dashed), and γ = 10:5 meV (blue, dotted). (c) and (d) present, respectively, in the logarithmic and normal scale, contour plots for the Raman Spectra I, in atomic units, as a function of the Raman frequency ω and the Fermi energy EF. (c) Reveals the formation of hybrid plasmon–phonon states with characteristic frequencies ω and ω+. Due to thermal broadening and the plasmon damping, the avoided crossing in the dispersion curve is shadowed. (d) shows how the frequency ω+ shifts with Fermi energy EF. Although the intensity of the ω+ branch increases with EF, in real Raman scattering measurements the intensity of this branch decreases as the electron density increases due to the increase of plasmon damping arising from ionized impurity scattering. Other parameters are CFH = −0:28, ωLO = 284.7 cm−1, ωTO = 267:8 cm−1, meff = 0:067mo, ε = 10.9.
FIG. 3.
FIG. 3.
Numerical fit of the theoretical line shape in Eq. (8) to the experimentally measured Raman spectra reported in Fig. 1. The intensity is normalized to the maximum of the ω peak. The Fermi energy EF and the damping γ are the fitting parameters. In (a) EF = 33 meV and γ = 2.8 meV and (b) EF = 0.17 eV and γ = 14 meV. Other parameters are as in Fig. 1.
FIG. 4.
FIG. 4.
Determination of electron densities nM in GaAs from the Fermi energy identified in the Raman line shapes. The logarithm of the electron densities for (a) BGN, (b) PDOS2, (c) PDOS4, and (d) PDOS2NPG models as a function of Fermi energy are shown.

References

    1. Bennett HS, J. Res. Natl. Inst. Stand. Technol 112, 25 (2007). - PMC - PubMed
    1. Bennett HS, Andres H, and Pellegrino J, J. Res. Natl. Inst. Stand. Technol 114, 237 (2009). - PMC - PubMed
    1. Garlapati SK, Divya M, Breitung B, Kruk R, Hahn H, and Dasgupta S, Adv. Mater 30, 1707600 (2018). - PubMed
    1. Spirkoska D, Abstreiter G, and I Morral AF, Nanotechnology 19, 435704 (2008). - PubMed
    1. Jeganathan K, Debnath R, Meijers R, Stoica T, Calarco R, Grützmacher D, and Lüth H, J. Appl. Phys 105, 123707 (2009).

LinkOut - more resources