

Enhancing Cubes with Models to Describe Multidimensional Data
- PMID: 34131390
- PMCID: PMC8192225
- DOI: 10.1007/s10796-021-10147-3
Enhancing Cubes with Models to Describe Multidimensional Data
Abstract
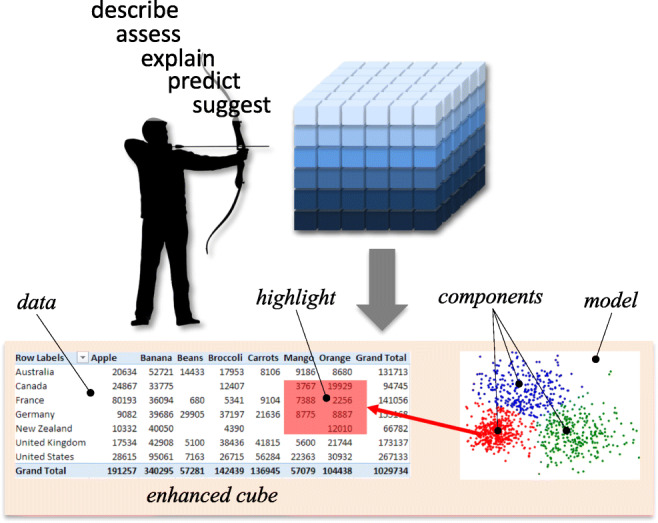
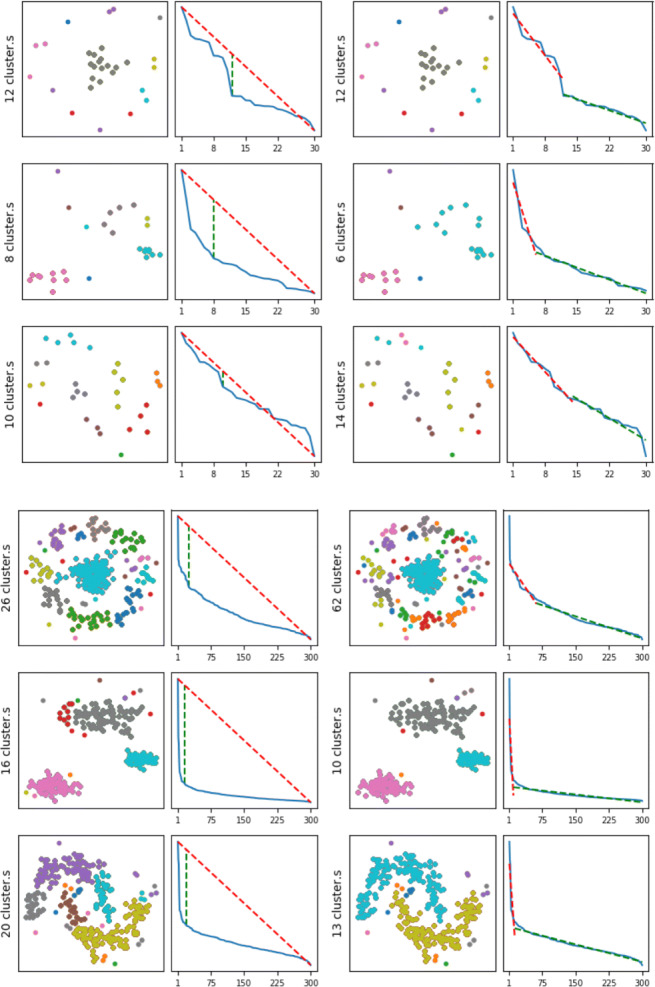
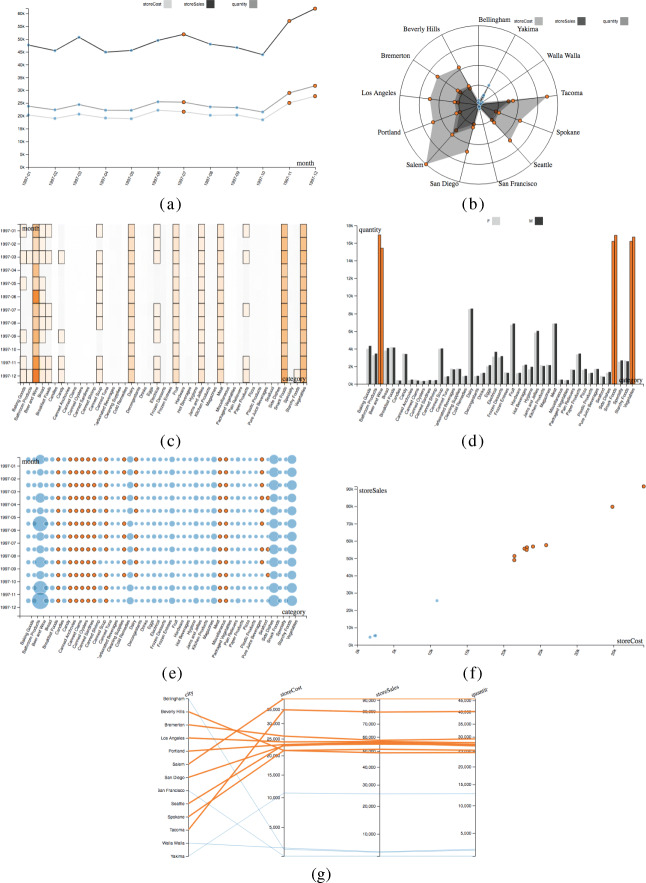
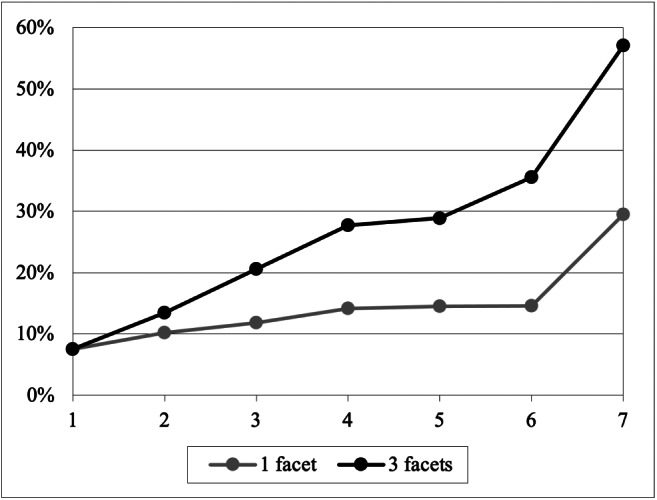
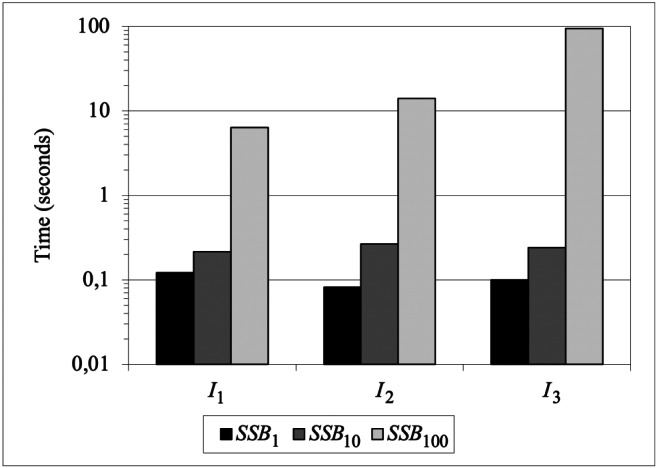
The Intentional Analytics Model (IAM) has been recently envisioned as a new paradigm to couple OLAP and analytics. It relies on two basic ideas: (i) letting the user explore data by expressing her analysis intentions rather than the data she needs, and (ii) returning enhanced cubes, i.e., multidimensional data annotated with knowledge insights in the form of interesting model components (e.g., clusters). In this paper we contribute to give a proof-of-concept for the IAM vision by delivering an end-to-end implementation of describe, one of the five intention operators introduced by IAM. Among the research challenges left open in IAM, those we address are (i) automatically tuning the size of models (e.g., the number of clusters), (ii) devising a measure to estimate the interestingness of model components, (iii) selecting the most effective chart or graph for visualizing each enhanced cube depending on its features, and (iv) devising a visual metaphor to display enhanced cubes and interact with them. We assess the validity of our approach in terms of user effort for formulating intentions, effectiveness, efficiency, and scalability.
Keywords: Data exploration; Models; Multidimensional data; OLAP.
© The Author(s) 2021.
Figures


References
-
- Abela, A. (2008). Advanced presentations by design. Pfeiffer.
-
- Bentayeb, F., & Favre, C. (2009). RoK: Roll-up with the k-means clustering method for recommending OLAP queries. In Proceedings of DEXA (pp. 501–515).
-
- Bie, T.D. (2013). Subjective interestingness in exploratory data mining. In Proceedings of IDA (pp. 19–31).
-
- Börner K. Atlas of knowledge: anyone can map. Cambridge: MIT Press; 2015.
-
- Chédin, A., Francia, M., Marcel, P., Peralta, V., & Rizzi, S. (2020). The tell-tale cube. In Proceedings of ADBIS (pp. 204–218). Lyon, France.
LinkOut - more resources
Full Text Sources