

Semiautomatic robust regression clustering of international trade data
- PMID: 34131421
- PMCID: PMC8193608
- DOI: 10.1007/s10260-021-00569-3
Semiautomatic robust regression clustering of international trade data
Abstract
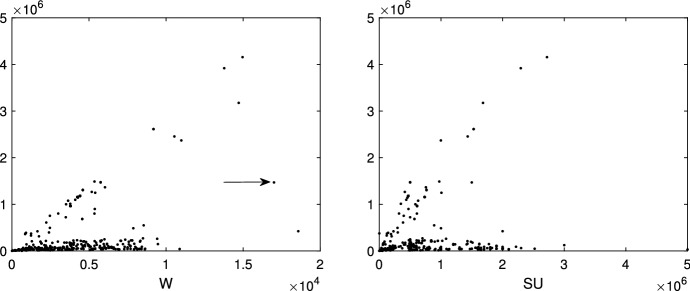
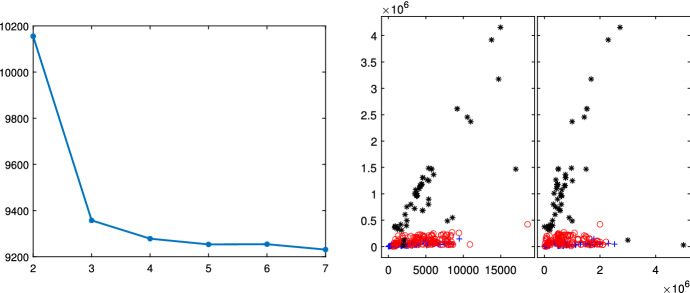
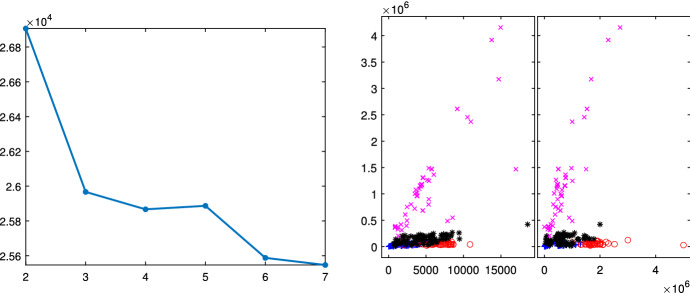
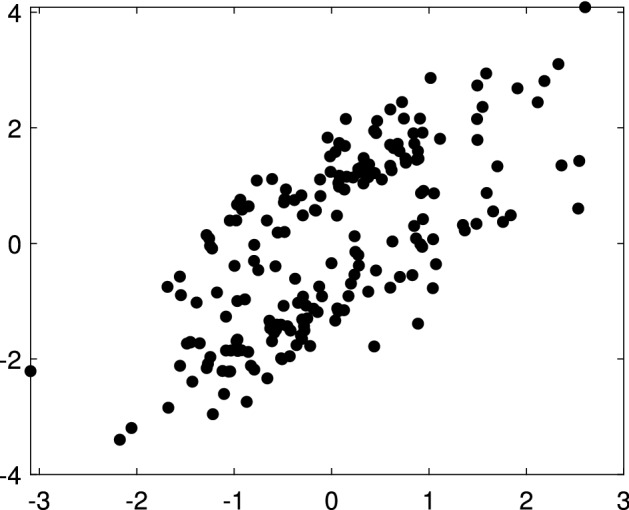
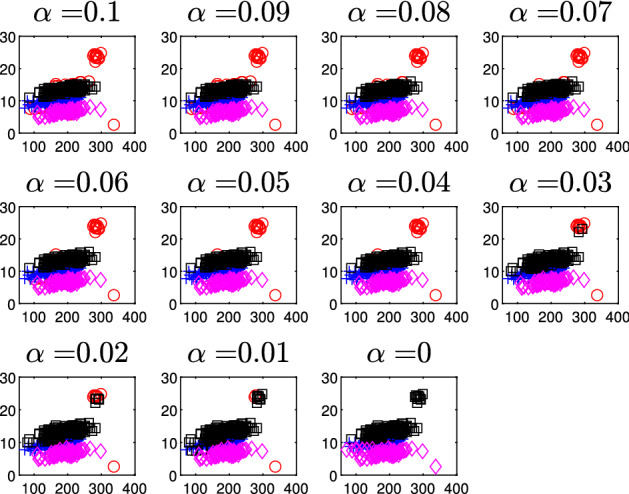
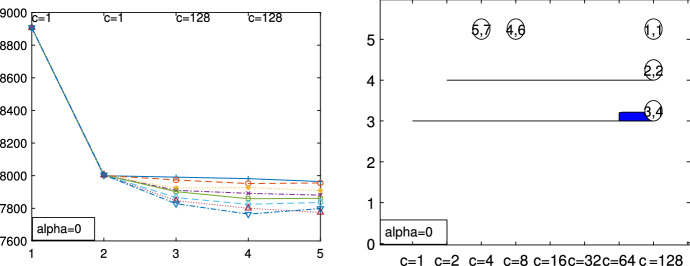
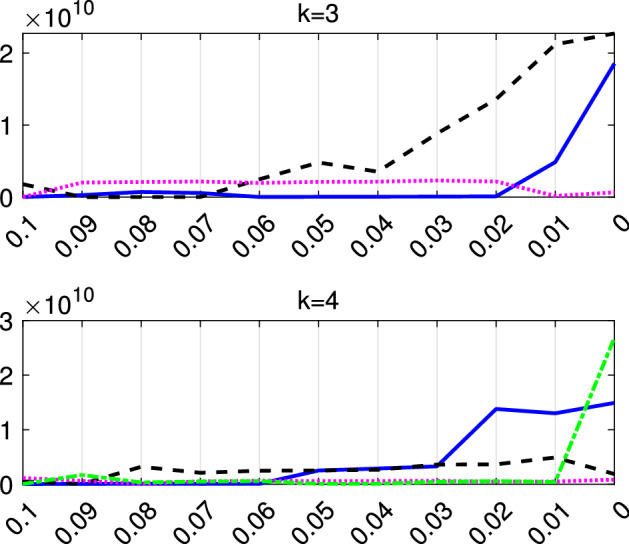
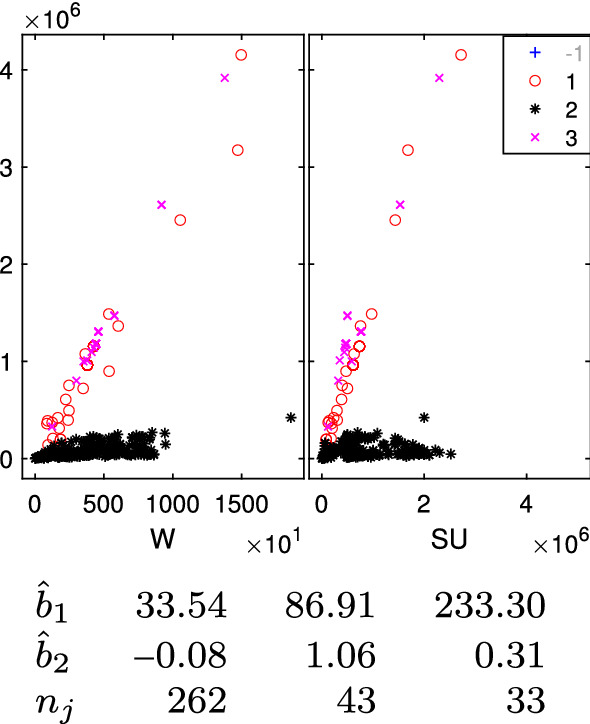
The purpose of this paper is to show in regression clustering how to choose the most relevant solutions, analyze their stability, and provide information about best combinations of optimal number of groups, restriction factor among the error variance across groups and level of trimming. The procedure is based on two steps. First we generalize the information criteria of constrained robust multivariate clustering to the case of clustering weighted models. Differently from the traditional approaches which are based on the choice of the best solution found minimizing an information criterion (i.e. BIC), we concentrate our attention on the so called optimal stable solutions. In the second step, using the monitoring approach, we select the best value of the trimming factor. Finally, we validate the solution using a confirmatory forward search approach. A motivating example based on a novel dataset concerning the European Union trade of face masks shows the limitations of the current existing procedures. The suggested approach is initially applied to a set of well known datasets in the literature of robust regression clustering. Then, we focus our attention on a set of international trade datasets and we provide a novel informative way of updating the subset in the random start approach. The Supplementary material, in the spirit of the Special Issue, deepens the analysis of trade data and compares the suggested approach with the existing ones available in the literature.
Keywords: Clustering; Forward search; International trade; Monitoring; Multiple start; Outliers; Regression; TCLUST; Trimming.
© The Author(s) 2021.
Figures
Similar articles
-
How to Use Model-Based Cluster Analysis Efficiently in Person-Oriented Research.J Pers Oriented Res. 2021 Aug 26;7(1):22-35. doi: 10.17505/jpor.2021.23449. eCollection 2021. J Pers Oriented Res. 2021. PMID: 34548917 Free PMC article.
-
Technique of Gene Expression Profiles Extraction Based on the Complex Use of Clustering and Classification Methods.Diagnostics (Basel). 2020 Aug 12;10(8):584. doi: 10.3390/diagnostics10080584. Diagnostics (Basel). 2020. PMID: 32806785 Free PMC article.
-
The future of Cochrane Neonatal.Early Hum Dev. 2020 Nov;150:105191. doi: 10.1016/j.earlhumdev.2020.105191. Epub 2020 Sep 12. Early Hum Dev. 2020. PMID: 33036834
-
TCLUST: a fast method for clustering genome-scale expression data.IEEE/ACM Trans Comput Biol Bioinform. 2011 May-Jun;8(3):808-18. doi: 10.1109/TCBB.2010.34. IEEE/ACM Trans Comput Biol Bioinform. 2011. PMID: 20479508
-
Retrospective analysis: reproducibility of interblastomere differences of mRNA expression in 2-cell stage mouse embryos is remarkably poor due to combinatorial mechanisms of blastomere diversification.Mol Hum Reprod. 2018 Jul 1;24(7):388-400. doi: 10.1093/molehr/gay021. Mol Hum Reprod. 2018. PMID: 29746690
Cited by
-
Preventing profiling for ethical fake news detection.Inf Process Manag. 2023 Mar;60(2):None. doi: 10.1016/j.ipm.2022.103206. Inf Process Manag. 2023. PMID: 36874352 Free PMC article.
-
Heterogeneous Learning of Functional Clustering Regression and Application to Chinese Air Pollution Data.Int J Environ Res Public Health. 2023 Feb 25;20(5):4155. doi: 10.3390/ijerph20054155. Int J Environ Res Public Health. 2023. PMID: 36901175 Free PMC article.
-
Towards Data-Driven Decision-Making in the Korean Film Industry: An XAI Model for Box Office Analysis Using Dimension Reduction, Clustering, and Classification.Entropy (Basel). 2023 Mar 27;25(4):571. doi: 10.3390/e25040571. Entropy (Basel). 2023. PMID: 37190359 Free PMC article.
References
-
- Atkinson AC, Riani M. The forward search and data visualisation. Comput Stat. 2004;19:29–54. doi: 10.1007/bf02915275. - DOI
-
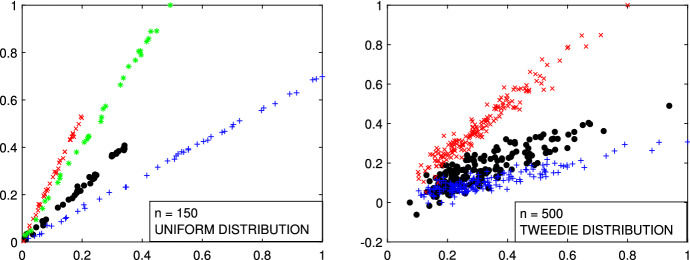
- Barabesi L, Cerasa A, Perrotta D, Cerioli A. Modeling international trade data with the tweedie distribution for anti-fraud and policy support. Eur J Oper Res. 2015;248(3):1031–1043. doi: 10.1016/j.ejor.08.042. - DOI
-
- Biernacki C, Celeux G. Govaert. Assessing a mixture model for clustering with the integrated completed likelihood. IEEE Trans Pattern Anal Mach Intell. 2000;22:719–725. doi: 10.1109/34.865189. - DOI
-
- Cerioli A, Perrotta D. Robust clustering around regression lines with high density regions. Adv Data Anal Classif. 2014;8:5–26. doi: 10.1007/s11634-013-0151-5. - DOI
-
- Cerioli A, Riani M, Atkinson AC, Corbellini A. The power of monitoring: How to make the most of a contaminated multivariate sample (with discussion) Stat Methods Appl. 2017 doi: 10.1007/s10260-017-0409-8. - DOI
Publication types
LinkOut - more resources
Full Text Sources