. 2016;3(4):10.1364/optica.3.000414.
doi: 10.1364/optica.3.000414.

Dual-comb spectroscopy

Affiliations

Dual-comb spectroscopy

Ian Coddington et al. Optica. 2016.

Abstract

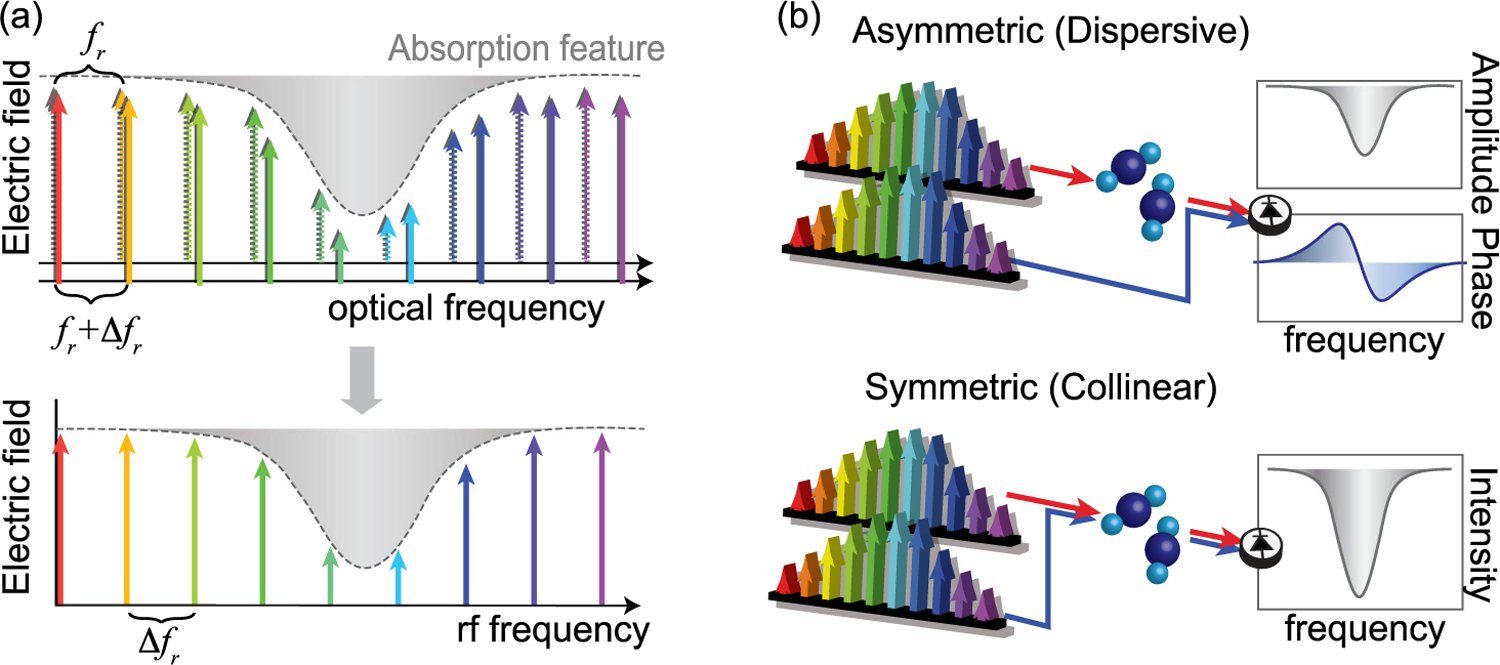
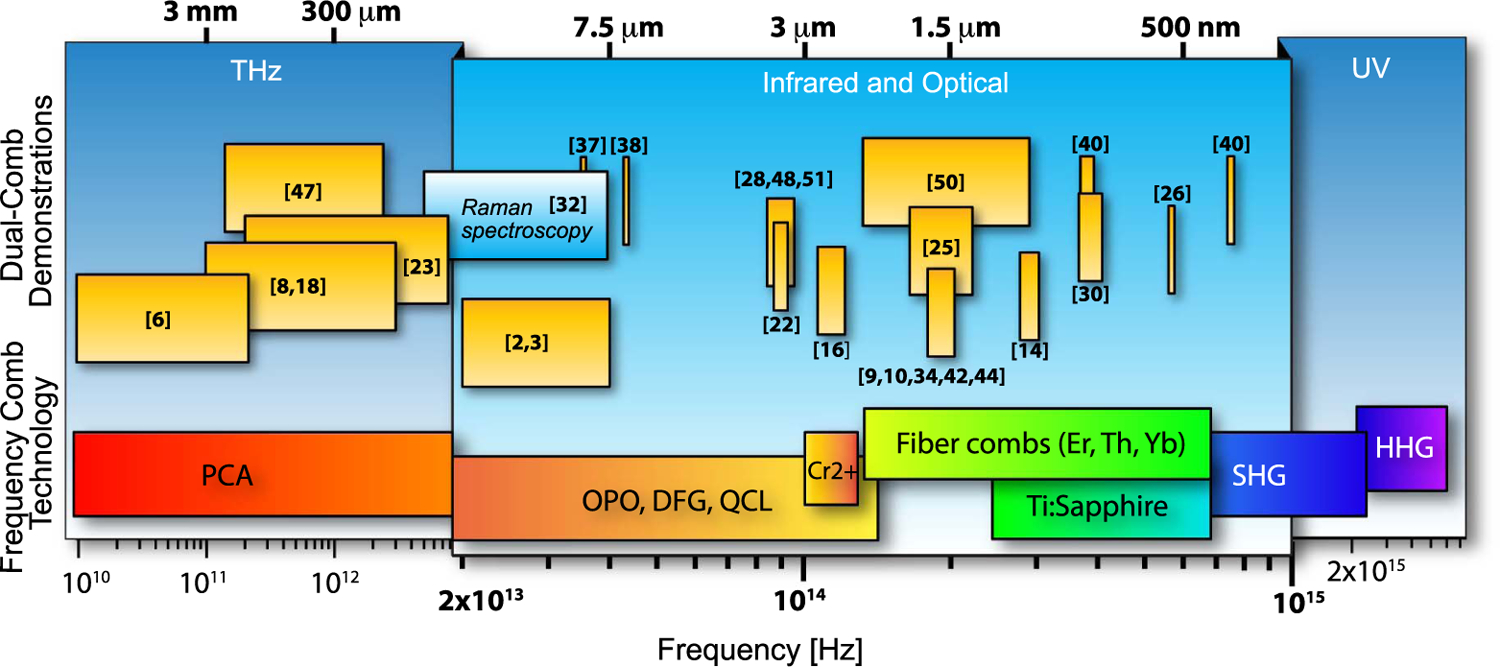
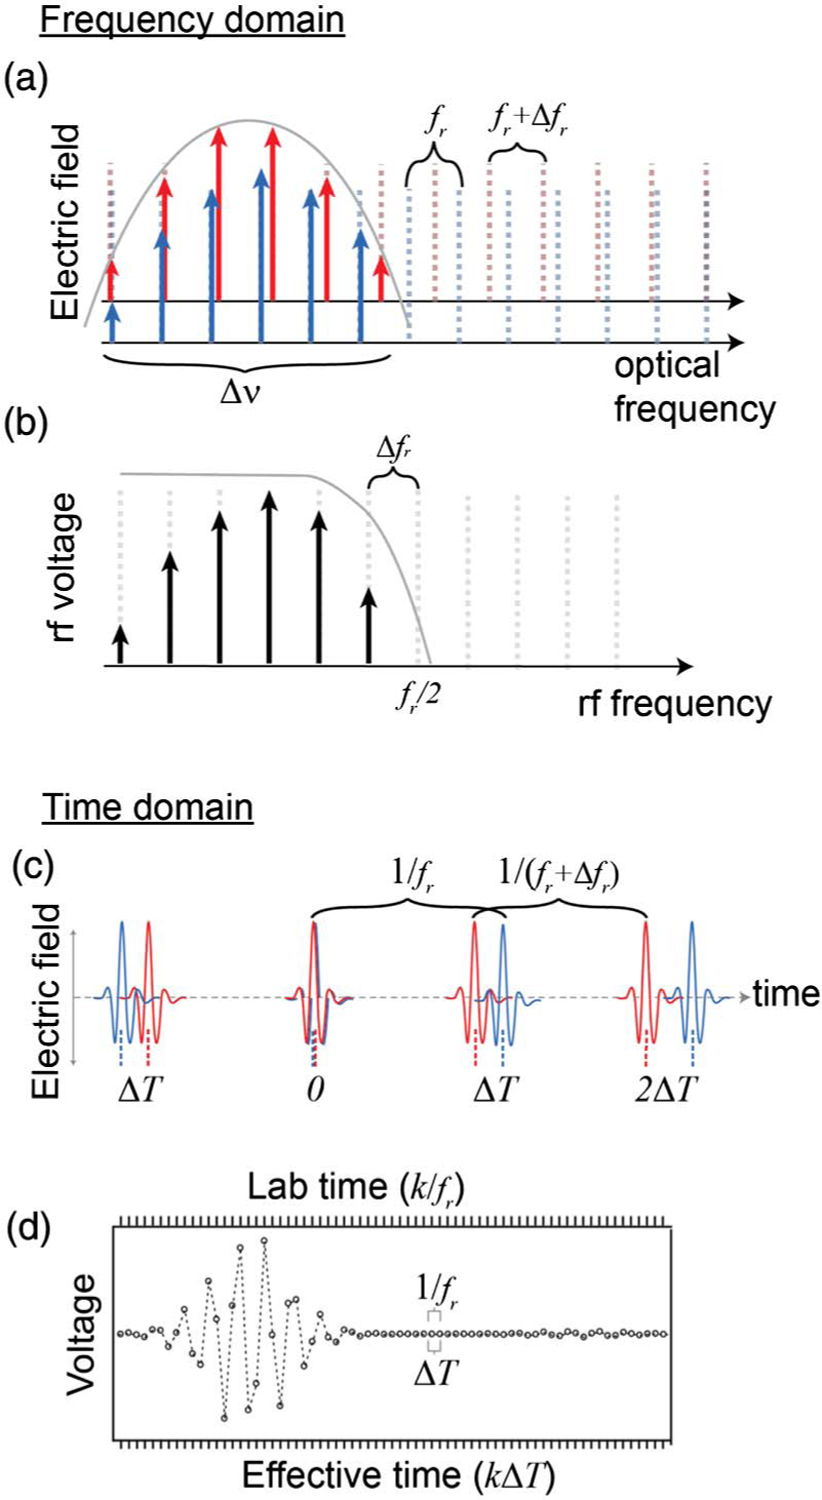
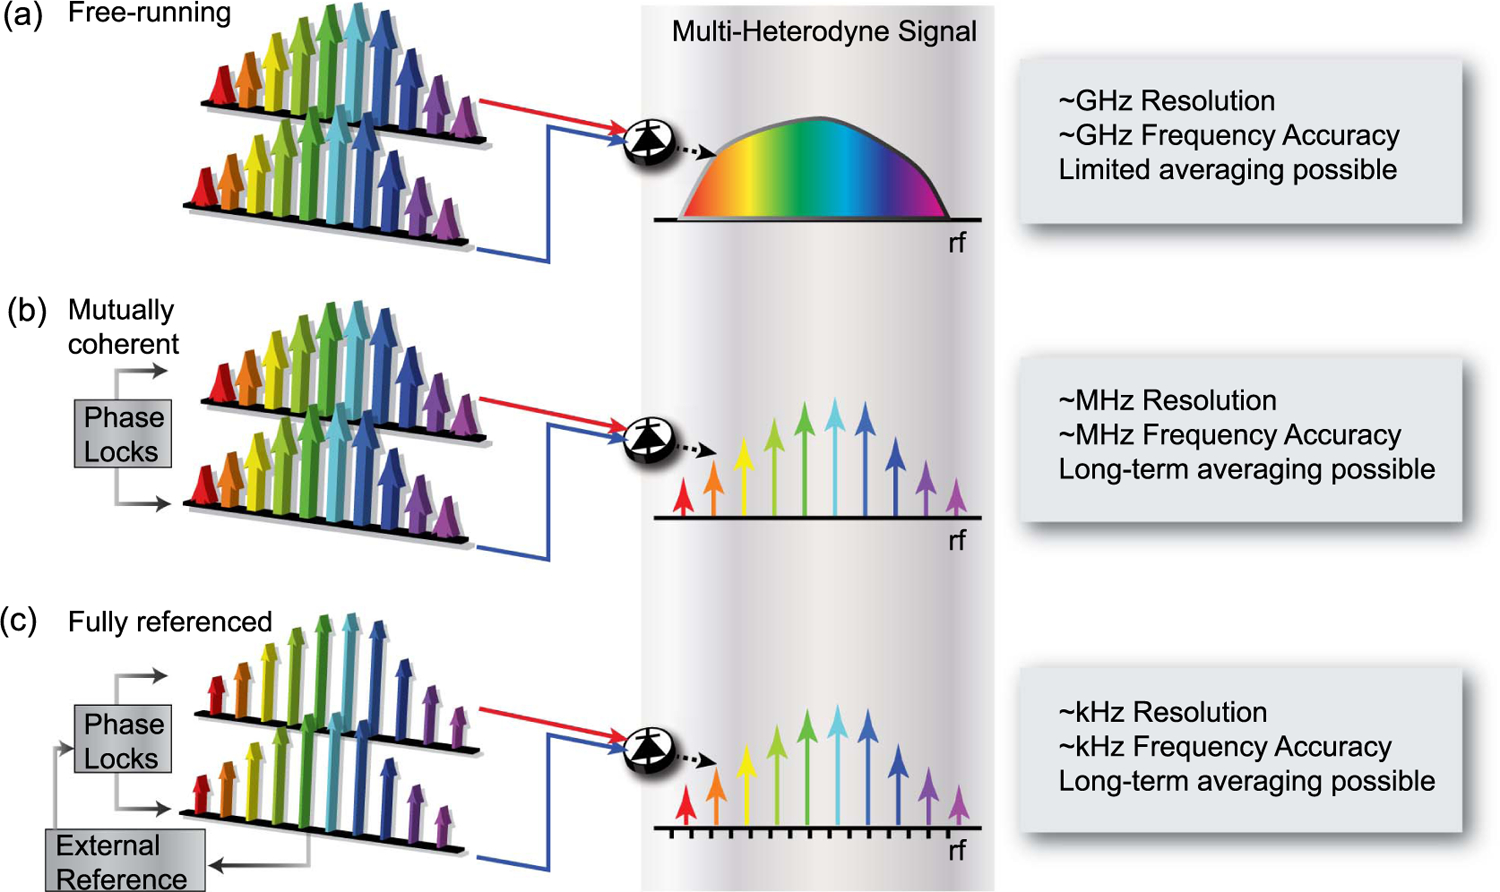
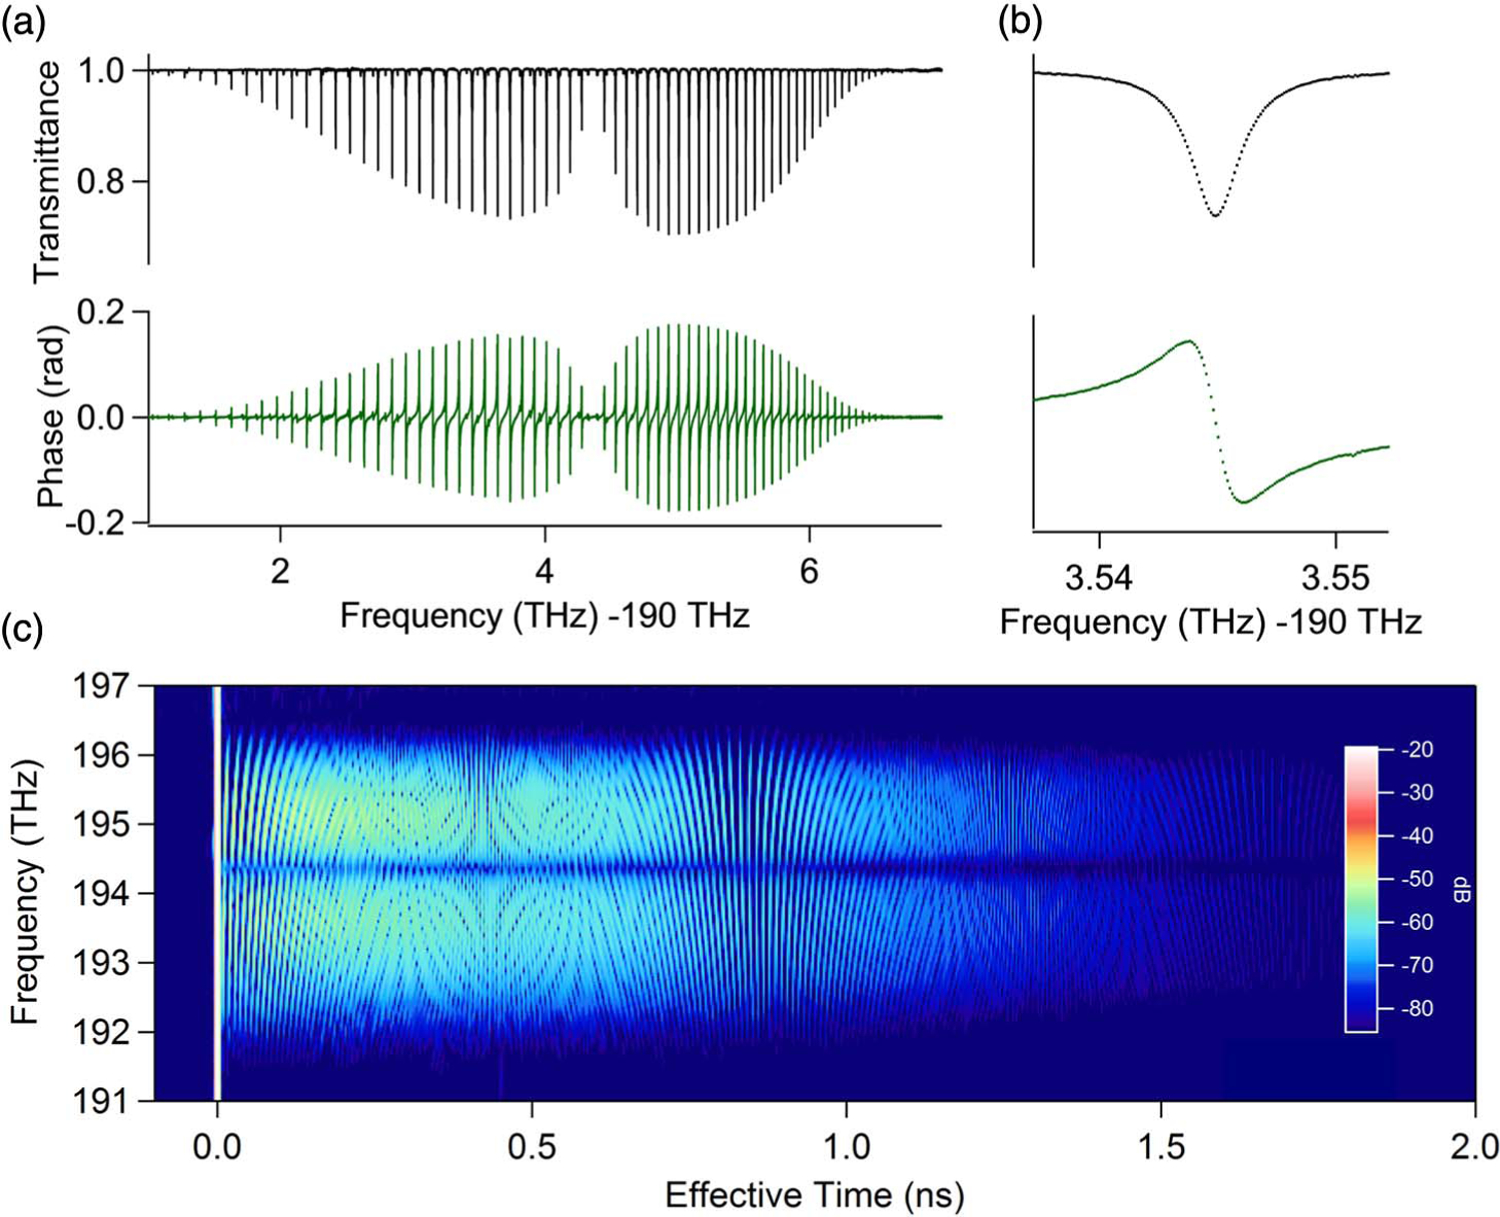
Dual-comb spectroscopy is an emerging new spectroscopic tool that exploits the frequency resolution, frequency accuracy, broad bandwidth, and brightness of frequency combs for ultrahigh-resolution, high-sensitivity broadband spectroscopy. By using two coherent frequency combs, dual-comb spectroscopy allows a sample's spectral response to be measured on a comb tooth-by-tooth basis rapidly and without the size constraints or instrument response limitations of conventional spectrometers. This review describes dual-comb spectroscopy and summarizes the current state of the art. As frequency comb technology progresses, dual-comb spectroscopy will continue to mature and could surpass conventional broadband spectroscopy for a wide range of laboratory and field applications.

Keywords: (280.0280) Remote sensing and sensors; (300.0300) Spectroscopy; (300.6360) Spectroscopy, laser; (300.6495) Spectroscopy, terahertz.


Figures

Fig. 1.
Fig. 1.
(a) Simple DCS concept. Two combs with repetition rates fr and fr + Δfr are mixed and detected by a single photoreceiver. As a result of the comb structure, each pair of optical teeth yields an rf heterodyne signal at a unique rf frequency. These rf frequencies form an rf comb of spacing Δfr. The rf teeth can be tightly packed such that >105 comb teeth can be observed simultaneously. For much of the original DCS work, fr was typically ∼100 MHz and Δfr was 100 Hz to 1 kHz, but these values can vary considerably across different frequency comb sources. (b) For spectroscopy, either one or both combs are passed through the sample. The resulting absorption (or phase shifts) on the comb teeth is encoded onto the corresponding amplitude (or phase) of the measured rf comb teeth.
Fig. 2.
Fig. 2.
Spectral coverage of dual-comb spectroscopy demonstrations (top band) and underlying frequency comb technologies (bottom band). The span covers over 14 octaves across the THz, IR, and optical. DCS has also been proposed in the extreme UV [77]. Section 4 discusses some of these different demonstrations. PCA, photoconductive antenna; OPO, optical parametric oscillator; DFG, difference frequency generation; QCL, quantum cascade laser; SHG, second-harmonic generation; HHG, high-harmonic generation.
Fig. 3.
Fig. 3.
(a) Two frequency combs (red and blue) are mixed to produce (b) the rf comb. Solid gray lines indicate filter functions applied in the rf and optical to avoid aliasing effects. (c) The equivalent time-domain picture showing the pulse-to-pulse walk-off between the two comb pulse trains. (d) The photoreceiver voltage output corresponds to the product of the two comb pulses, integrated over the receiver bandwidth. This output can be viewed in laboratory time, where the samples are at time intervals of 1∕fr, or in effective time, where the samples are at time intervals of ΔT (as with FTIR interferograms). In both time scales k is the sample number. The large “centerburst” corresponds to the simultaneous arrival of the two pulses. Also visible in the “tail” to the right is a weak ringing containing absorption information of the sample gas.
Fig. 4.
Fig. 4.
Three different categories of DCS demonstrations. (a) Free-running combs can yield dual-comb spectra, but with low resolution, low frequency accuracy, and low SNR, since only limited signal averaging is possible; (b) mutually coherent combs can yield comb-tooth-resolved spectra that can be averaged for high SNR; and (c) fully referenced combs yield spectra with simultaneous high resolution, absolute frequency accuracy, and high SNR. Text boxes indicate some general rules of thumb for frequency combs based on mode-locked lasers.
Fig. 5.
Fig. 5.
Signature of the full rotational band from the C-H overtone of HCN gas as measured in the dispersive dual-comb spectrometer configuration [19]. (a) The phase and amplitude signature at 100 MHz point spacing has a signal-to-noise ratio per point of ∼4000 with respect to unity transmission; (b) expanded view showing the spectral sampling points; (c) joint time–frequency domain signature from the short-time Fourier transform of the data that clearly shows the free-induction decay signals in the “P” and “R” branches as vertical stripes. The overall decay results from Doppler and collisional dephasing.
Fig. 6.
Fig. 6.
Spectral SNR versus bandwidth for DCS demonstrations in the near-IR (NIR; yellow triangles) and mid-IR (MIR; red triangles). In the near-IR, data points include only experiments that enforced mutual coherence through either active phase/timing feedback [25], digital phase/timing correction [24], or analog adaptive sampling [42]. The solid triangles indicate that coherent averaging was implemented. Approximate regions of operation for FTIR and tunable laser spectroscopy (TLS) are added in blue. The number of spectral elements M is the bandwidth/fr, where fr is ∼100 MHz for most demonstrations shown here.

References

    1. Schiller S, “Spectrometry with frequency combs,” Opt. Lett 27, 766–768 (2002). - PubMed
    1. Keilmann F, Gohle C, and Holzwarth R, “Time-domain mid-infrared frequency-comb spectrometer,” Opt. Lett 29, 1542–1544 (2004). - PubMed
    1. Schliesser A, Brehm M, Keilmann F, and van der Weide D, “Frequency-comb infrared spectrometer for rapid, remote chemical sensing,” Opt. Express 13, 9029–9038 (2005). - PubMed
    1. Yasui T, Saneyoshi E, and Araki T, “Asynchronous optical sampling terahertz time-domain spectroscopy for ultrahigh spectral resolution and rapid data acquisition,” Appl. Phys. Lett 87, 061101 (2005).
    1. Brehm M, Schliesser A, and Keilmann F, “Spectroscopic near-field microscopy using frequency combs in the mid-infrared,” Opt. Express 14, 11222–11233 (2006). - PubMed

LinkOut - more resources