Review
. 2021 Oct 1;23(10):1634-1646.
doi: 10.1093/neuonc/noab138.

Reimagining pilocytic astrocytomas in the context of pediatric low-grade gliomas

Affiliations
Review

Reimagining pilocytic astrocytomas in the context of pediatric low-grade gliomas

Till Milde et al. Neuro Oncol. .

Abstract

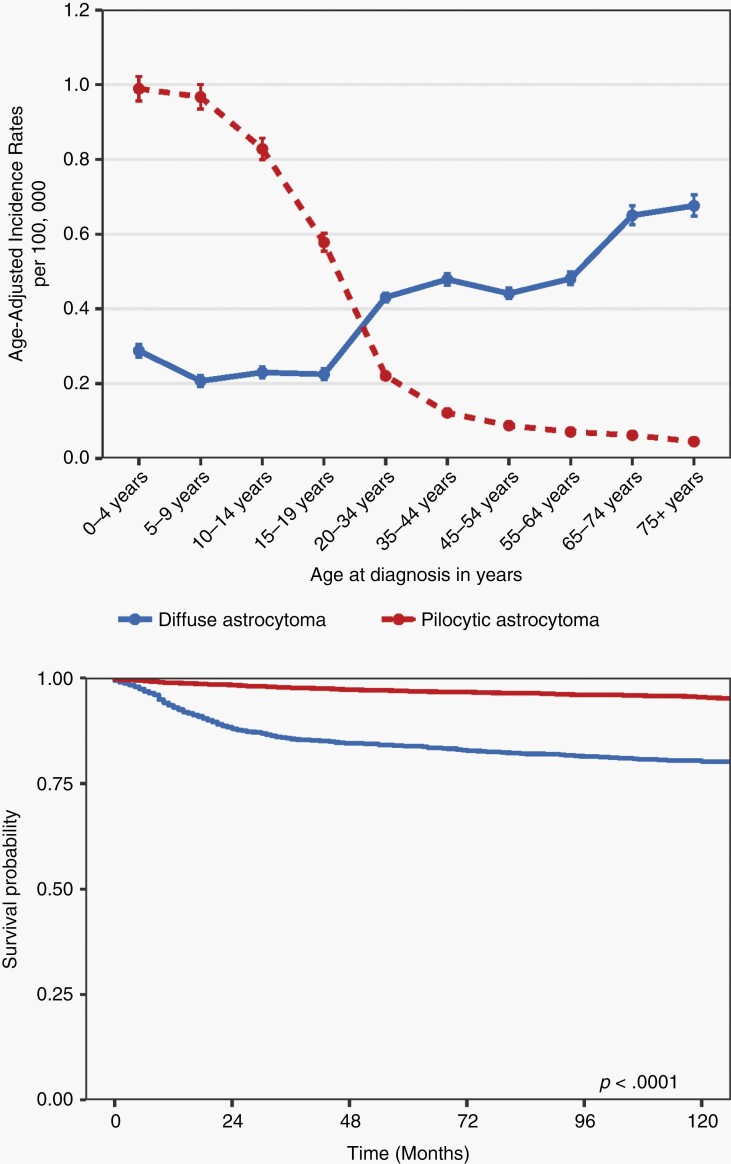
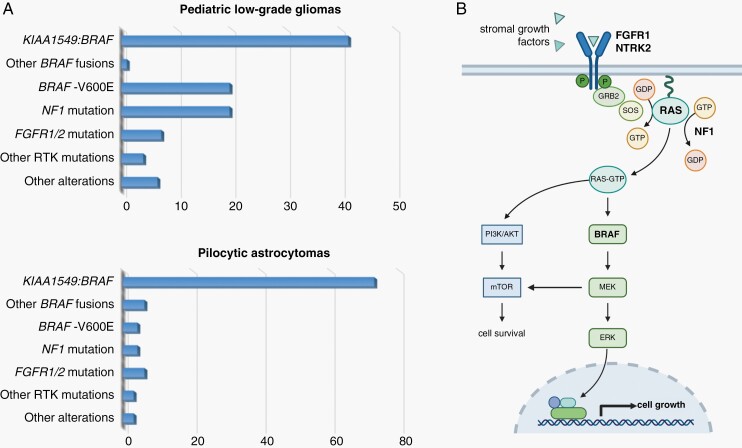
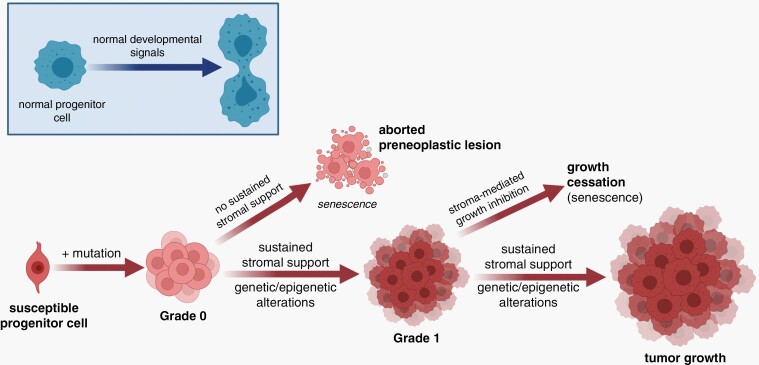
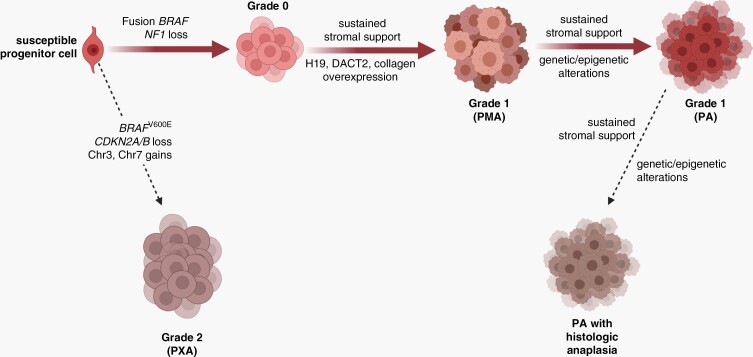
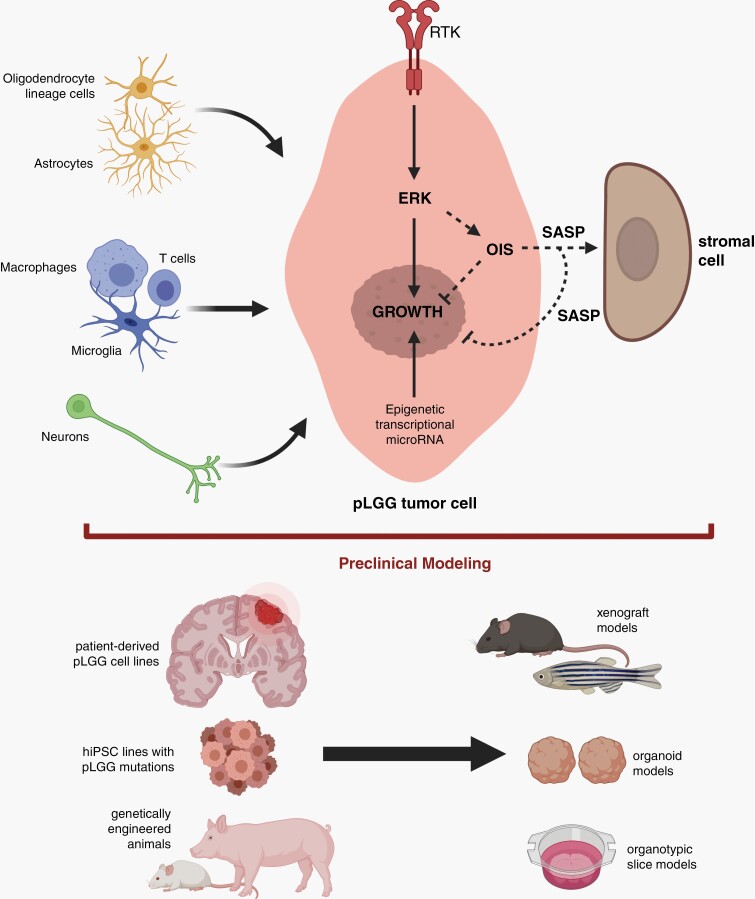
Pediatric low-grade gliomas (pLGGs) are the most common brain tumor in children and are associated with lifelong clinical morbidity. Relative to their high-grade adult counterparts or other malignant childhood brain tumors, there is a paucity of authenticated preclinical models for these pLGGs and an incomplete understanding of their molecular and cellular pathogenesis. While large-scale genomic profiling efforts have identified the majority of pathogenic driver mutations, which converge on the MAPK/ERK signaling pathway, it is now appreciated that these events may not be sufficient by themselves for gliomagenesis and clinical progression. In light of the recent World Health Organization reclassification of pLGGs, and pilocytic astrocytoma (PA), in particular, we review our current understanding of these pediatric brain tumors, provide a conceptual framework for future mechanistic studies, and outline the challenges and pressing needs for the pLGG clinical and research communities.

Keywords: BRAF; MEK; cellular senescence; low-grade glioma; neurofibromatosis type 1; pediatric brain tumor; pilocytic astrocytoma; tumor microenvironment.


Figures

Fig. 1
Fig. 1
Epidemiology of pediatric low-grade gliomas. (A) Average annual age-adjusted incidence rates with 95% confidence intervals for individuals aged 19 years or younger with pilocytic astrocytoma (PA; red) vs diffuse astrocytoma (DA; blue) by age at initial diagnosis. Rates are per 100 000 and age-adjusted to the 2000 US Standard Population (19 age groups—Census P25-1130) standard; confidence intervals (Tiwari mod) are 95% for rates. CBTRUS: data provided by CDC’s National Program of Cancer Registries and NCI’s Surveillance, Epidemiology and End Results Program, 2000-2017. (B) Kaplan-Meier overall survival curve for PA (red) vs DA (blue) in individuals aged 19 years or younger (log-rank P value). National Program of Cancer Registries, 2001-2016.
Fig. 2
Fig. 2
Histopathology of pilocytic astrocytomas (PA) and other related pediatric low-grade gliomas. PAs are typically biphasic tumors containing piloid areas with (A) Rosenthal fibers and (B) oligodendrocyte-like areas with eosinophilic granular bodies. (C) Multinucleated cells in a loose myxoid stroma are found in a subset of cases. (D) In contrast, the pilomyxoid astrocytoma subtype has a monomorphous appearance embedded within a myxoid background and frequent perivascular aggregates. (E) Histologic features of anaplasia in PA may be recognizable as cellular aggregates in an otherwise conventional PA, (F) with increased mitotic activity. Subsets of pediatric low-grade astrocytomas with distinct alterations include (G) angiocentric glioma (with MYB-QKI fusions), (H) MYB-altered diffuse astrocytoma, and (I) pleomorphic xanthoastrocytoma, which frequently harbors BRAFV600E mutations. Magnification, ×400 (A, B, C, E, H, I), ×600 (F), ×200 (D, G).
Fig. 3
Fig. 3
Mutational spectrum in pediatric low-grade gliomas. (A) Distribution of molecular alterations in pediatric low-grade gliomas (top) and pilocytic astrocytomas (bottom). X-axis denotes the percentage of tumors with identified mutations in each cohort (N = 400, pLGGs; N = 96, PAs). (B) Graphic illustration of the MAPK/ERK signaling pathway, highlighting the genetic/genomic alterations commonly observed in these tumors that increase MEK signaling (bold; involving the FGFR1, NTRK2, RAS, BRAF, and NF1 genes). Created with BioRender.com. Abbreviations: MAPK/ERK, mitogen-activated protein kinase/extracellular signal-regulated kinase; PAs, pilocytic astrocytomas; pLGGs, pediatric low-grade gliomas.
Fig. 4
Fig. 4
Proposed model of PA pathogenesis. Similar to normal brain development where progenitor cells receive developmental signals from their environment (blue inset), pilocytic astrocytomas arise from susceptible progenitor cells following the acquisition of a genetic alteration (e.g., NF1 loss, FGFR1 mutation, KIAA1549:BRAF fusion), which creates a preneoplastic state (grade 0). These lesions in the setting of inhibitory growth signals from the tumor microenvironment undergo senescence or death and do not form gliomas. However, in the setting of sustained stromal support, they evolve into grade 1 tumors whose continued growth is dictated by ongoing microenvironment growth factors and conditions. Alternatively, or in concert with stromal paracrine factor support, additional genetic (microRNA) or epigenetic events could facilitate continued tumor growth and progression. Created with BioRender.com. Abbreviations: NF1, neurofibromatosis type 1; PA, pilocytic astrocytoma.
Fig. 5
Fig. 5
Proposed model of pilocytic astrocytoma (PA) progression. The spectrum of PA-like tumors are hypothesized to arise from similar cells of origin (susceptible progenitor cells), whose further evolution is dictated by the specific genetic/genomic alterations and stromal support. While formation and continued growth of classic PAs are heavily dependent on microenvironment conditions (e.g., stromal growth factors) and/or genetic (microRNA) or epigenetic alterations, the acquisition of additional genetic/genomic aberrations facilitates the formation of tumors with less stromal dependence and more clinically aggressive behavior. In this regard, pleomorphic xanthoastrocytoma (PXA) harbor chromosomal gains, CDKN2A/B locus loss, and oncogenic BRAF mutations. Additionally, PAs may arise from pilomyxoid astrocytomas (PMA) that develop in response to the overexpression of specific genes (i.e., H19, DACT2, and collagen) important for tumor progression. Lastly, sustained stromal support and further genetic/epigenetic alterations are likely responsible for the progression of PAs to PAs with histologic anaplasia. Created with BioRender.com.
Fig. 6
Fig. 6
Future directions for pediatric low-grade gliomas (pLGG) study. Additional research is required to explore the interactions between stromal cells (oligodendrocyte lineage cells, astrocytes, immune-like cells, neurons) and pLGG tumor cells, especially as they relate to ERK-mediated growth regulation. Moreover, the determinants that regulate oncogene-induced senescence (OIS) and the senescence-associated secretory phenotype (SASP) will provide key insights into how growth cessation is controlled. Similarly, the role of epigenetic, transcriptional, and microRNA expression changes within pLGG cells on ERK-regulated cell growth necessitates further investigation. With a greater appreciation of the pLGG tumor microenvironment circuitry, more refined preclinical models will emerge that leverage patient-derived pLGG cell lines, hiPSC cellular engineering, and genetically engineered animals. Created with BioRender.com.

References

    1. Patil N, Kelly ME, Yeboa DN, et al. . Epidemiology of Brainstem High-Grade Gliomas in Children and Adolescents in the United States, 2000-2017. Neuro Oncol. 2020;23(6):990–998. - PMC - PubMed
    1. Louis DN, Perry A, Reifenberger G, et al. . The 2016 World Health Organization classification of tumors of the central nervous system: a summary. Acta Neuropathol. 2016;131(6):803–820. - PubMed
    1. Ostrom QT, Patil N, Cioffi G, Waite K, Kruchko C, Barnholtz-Sloan JS. CBTRUS Statistical Report: primary brain and other central nervous system tumors diagnosed in the United States in 2013-2017. Neuro Oncol. 2020;22(12 Suppl 2):iv1–iv96. - PMC - PubMed
    1. NPCR and SEER. National Program of Cancer Registries and Surveillance Epidemiology, and End Results Program. SEER*Stat Database: NPCR and SEER Incidence – U.S. Cancer Statistics 2001–2016 Public Use Research Database, 2019 submission (2001–2016), United States Department of Health and Human Services, Centers for Disease Control and Prevention and National Cancer Institute. Released June 2020; Available at www.cdc.gov/cancer/uscs/public-use. Accessed May 18, 2021.
    1. SEER. Surveillance Epidemiology, and End Results Program SEER*Stat Database: Incidence - SEER Research Data, 9 Registries, Nov 2019 Sub (1975-2017) - Linked To County Attributes - Time Dependent (1990-2017) Income/Rurality, 1969-2017 Counties, National Cancer Institute, DCCPS, Surveillance Research Program. Available at www.seer.cancer.gov. Accessed May 18, 2021.

Publication types