Review
. 2021 Aug;22(8):1416-1435.
doi: 10.3348/kjr.2020.1082. Epub 2021 May 26.

Non-Infectious Granulomatous Lung Disease: Imaging Findings with Pathologic Correlation

Affiliations
Review

Non-Infectious Granulomatous Lung Disease: Imaging Findings with Pathologic Correlation

Tomás Franquet et al. Korean J Radiol. 2021 Aug.

Abstract

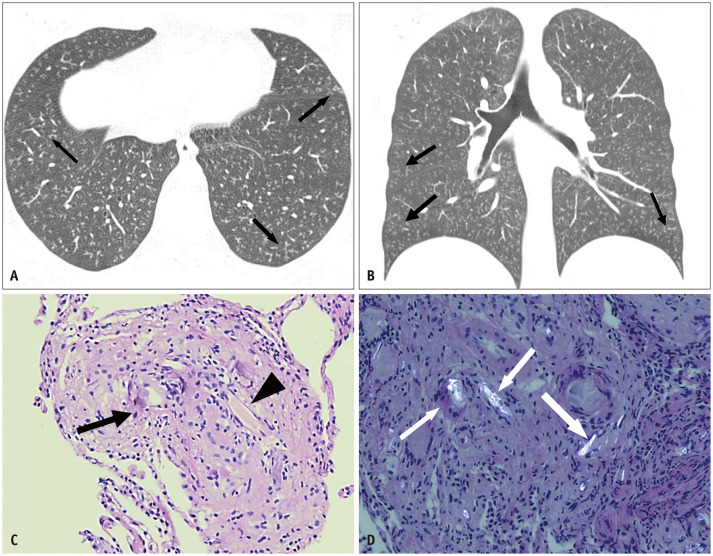
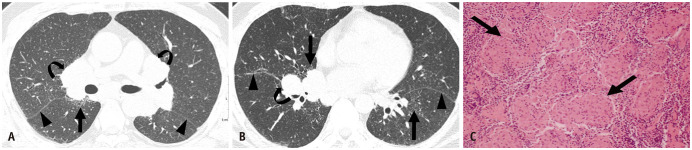
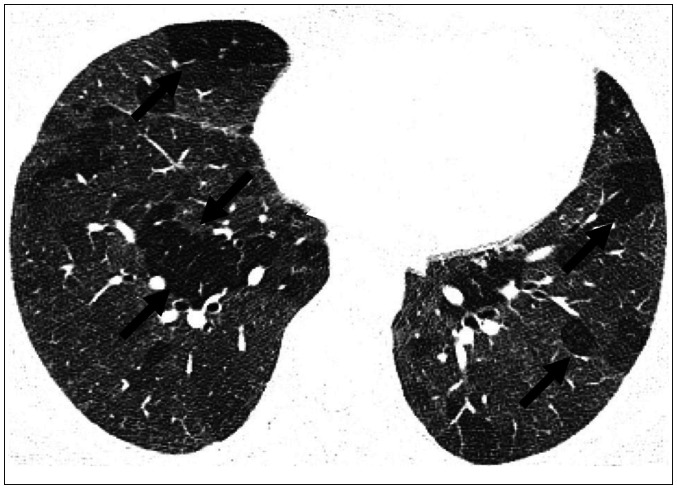
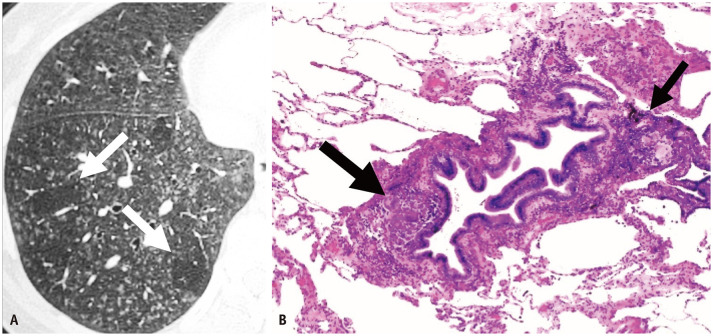
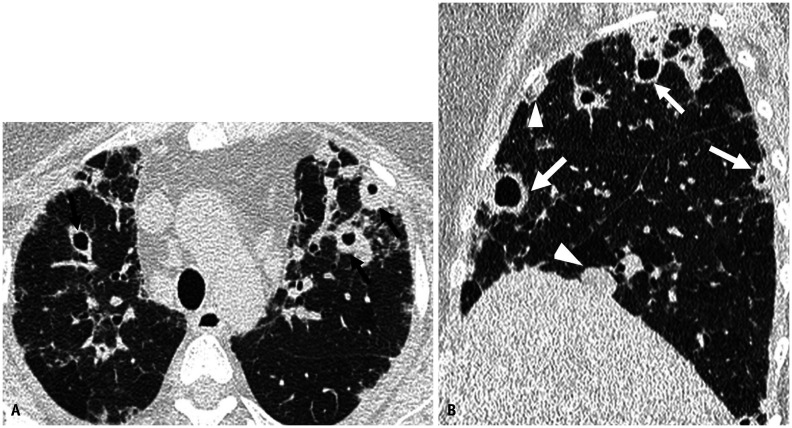
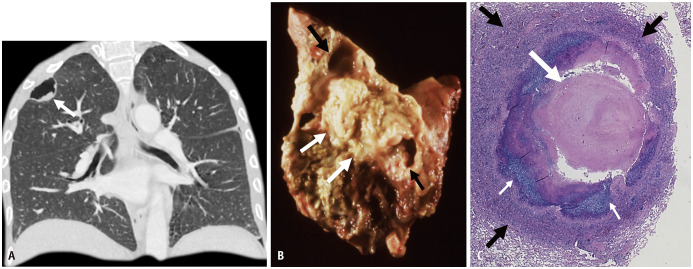
Non-infectious granulomatous lung disease represents a diverse group of disorders characterized by pulmonary opacities associated with granulomatous inflammation, a relatively nonspecific finding commonly encountered by pathologists. Some lesions may present a diagnostic challenge because of nonspecific imaging features; however, recognition of the various imaging manifestations of these disorders in conjunction with patients' clinical history, such as age, symptom onset and duration, immune status, and presence of asthma or cutaneous lesions, is imperative for narrowing the differential diagnosis and determining appropriate management of this rare group of disorders. In this pictorial review, we describe the pathologic findings of various non-infectious granulomatous lung diseases as well as the radiologic features and high-resolution computed tomography imaging features.

Keywords: Granulomatous lung disease; High-resolution computed tomography; Lung parenchyma; Non-infectious granulomatosis; Radiography.


Conflict of interest statement

The authors have no potential conflicts of interest to disclose.

Figures

Fig. 1
Fig. 1. Sarcoidosis in 51-year-old male (perilymphatic pattern).
A. Close-up view of an axial CT scan shows sparse micronodules with a typical perilymphatic distribution, especially along the fissures (arrowheads) and bronchovascular bundles (arrows). B. Low-power scanning magnification demonstrates the lymphangitic distribution of granulomas involving bronchovascular bundles, pleura, and interlobular septa typical of sarcoid (arrows). These findings correlate with the CT appearance (hematoxylin and eosin stain, × 40).
Fig. 2
Fig. 2. Sarcoidosis in 28-year-old female (reversed halo sign).
A. Close-up view of a coronal CT scan shows two central ground-glass opacities surrounded by a more or less complete ring of consolidation (reversed halo sign) (arrow). B. Medium power magnification demonstrates the compact, well-circumscribed non-necrotizing granulomas containing multinucleated giant cells typical of sarcoid (arrow) (hematoxylin and eosin stain, × 200).
Fig. 3
Fig. 3. Sarcoidosis in 40-year-old male (galaxy sign).
A, B. Axial (A) and coronal (B) CT images show multiple upper lobe-predominant solid pulmonary nodules surrounded by tiny satellite micronodules 1–2 mm (arrows).
Fig. 4
Fig. 4. Necrotizing sarcoid granulomatosis.
A. Coronal (MIP reformatted image) chest CT shows bilateral nodular opacities with irregular borders (arrows). B. Coronal (minIP reformatted image) chest CT shows hypodense nodules (arrow). Mediastinal and hilar adenopathies are also seen (arrowheads). C. Medium-power magnification demonstrates a conglomeration of necrotizing (pale eosinophilic hypocellular zones) granulomas with scattered multinucleated giant cells (arrows) compatible with “sarcoidosis with necrotizing sarcoid granulomatosis pattern” that correlates with nodules and masses seen on chest CT (hematoxylin and eosin stain, × 40).
Fig. 5
Fig. 5. Lymphomatoid granulomatosis a 56-year-old female.
A. Axial pre-contrast CT image demonstrates multiple pulmonary nodules and masses (arrows). Nodules and masses are distributed along bronchovascular bundle and in subpleural region. Large mass in the right lower lobe is cavitary (arrowhead). B. Autopsy gross specimen shows multiple ill-defined yellowish nodules (black arrows) that coalesce leading to large masses (white arrows). C. High-power magnification demonstrates vessel wall destruction by marked infiltrates of small Tlymphocytes that obscure malignant large B-lymphocytes seen in lymphomatoid granulomatosis (arrows) (hematoxylin and eosin stain, × 400).
Fig. 6
Fig. 6. Lymphomatoid granulomatosis a 62-year-old male.
A. Posteroanterior chest imaging shows a large cavitary mass in the left upper lobe (arrows). Ill-defined randomly distributed rounded opacities are iobserved in the rest of the lung parenchyma (arrowheads). B. Corresponding axial chest CT scan shows multiple rounded peripheral solid (black arrows) or cavitary nodules (white arrows).
Fig. 7
Fig. 7. Granulomatous-lymphocytic interstitial lung disease.
A. Axial chest CT scan shows multiple peripheral and peribronchovascular ground-glass and consolidation (arrows). B. Low-power scanning magnification of lung demonstrates airway centered marked infiltrates of chronic inflammatory cells (black arrows) that results in cystic remodeling of distal small airways (white arrows) (hematoxylin and eosin stain, × 40). C. High-power magnification demonstrates poorly formed collection of histiocytes and a multinucleated giant cell (arrows). The airway centered lung injury correlates with the peribronchovascular ground glass and consolidation seen on the chest CT (hematoxylin and eosin stain, × 200).
Fig. 8
Fig. 8. Aspiration pneumonia in 72-year-old male smoker.
A. Coronal reformatted contrast-enhanced CT shows right upper lobe heterogeneous consolidation and a large empyema (arrows). B. Medium-power magnification of lung shows airway centered fibrosis containing two clusters of multinucleated giant cells (arrows) (hematoxylin and eosin stain, × 40). C. On high-power magnificent in the right histologic image, the multinucleated giant cells and organizing pneumonia surround fragments of plant material (arrows) (hematoxylin and eosin stain, × 400).
Fig. 9
Fig. 9. Talcosis.
A, B. Axial and coronal reformatted CT images show numerous small bilateral centrilobular nodules, associated with a tree-in-bud pattern (arrows). C. Lung tissue biopsy demonstrates an interstitial granulomatous reaction to the talc particles (arrowhead) with a giant-cell reaction (arrow) (hematoxylin and eosin stain, × 400). D. Under polarized light, birefringent crystals are visible (arrows) (hematoxylin and eosin stain, × 400).
Fig. 10
Fig. 10. Berylliosis in a 49-year-old male who worked for 7 years in metal polishing.
A, B. Axial thin-section CT scans (1.0-mm-thick-sections) obtained at the levels of the bronchus intermedius (A). At the basal segmental bronchus shows multiple small nodules along the bronchovascular bundles (straight arrows) and in subfissural regions (arrowheads) and enlarged hilar lymph nodes (curved arrows) (B). C. High-power magnification of a pathologic specimen obtained with mediastinoscopic lymph node biopsy shows multiple noncaseating granulomas (arrows) (Courtesy of Chong S) (hematoxylin and eosin stain, × 400).
Fig. 11
Fig. 11. Subacute or cluster 1 hypersensitivity pneumonitis.
Axial thin-section CT scan at the level of lung bases shows diffuse ground-glass opacity interposed with areas of normal lung and lobular areas of decreased attenuation (arrows).
Fig. 12
Fig. 12. Subacute or cluster 1 hypersensitivity pneumonitis.
A. Close-up view of thin-section CT scan at the level of the right-lower lobe shows diffuse ground-glass opacities and poorly defined centrilobular nodules (arrows). Note lobular areas of decreased attenuation and vascularity reflecting air trapping (arrows). B. Medium-power magnification of lung demonstrates airway centered chronic inflammation containing poorly formed granulomata (arrows). The chronic inflammatory infiltrates surrounding small airways correlate with the centrilobular nodules and mosaic attenuation seen on the CT axial image A (hematoxylin and eosin stain, × 200).
Fig. 13
Fig. 13. Chronic or cluster 2 hypersensitivity pneumonitis.
Typical CT findings of biopsy-proven chronic hypersensitivity pneumonitis in a bird breeder. High-resolution CT scans show mild reticulation with superimposed patchy ground-glass opacities and traction bronchiectasis and bronchiolectasis (white arrowheads). Lobular areas of decreased attenuation and vascularity (black arrows) are also present.
Fig. 14
Fig. 14. Granulomatosis with polyangiitis in a 68-year-old male.
A, B. Axial thin-section CT scan at the level of lung bases (lung window) (A) and (B), mediastinal window show two rounded opacities of different sizes in the lateral segment of the middle lobe and in the superior segment of the right lower lobe (black arrows in A; white arrows in B); largest nodule shows central cavitation with thick walls and irregular inner margins (blackarrowhead in A).
Fig. 15
Fig. 15. Granulomatosis with polyangiitis (reversed halo sign).
A, B. Axial (A) and coronal (B) thin-section CT shows bilateral rounded opacities of different sizes with a central hypodense zone surrounded by a ring of consolidation (reversed halo sign) (arrows). C. Medium power magnification of lung demonstrates necrotizing vasculitis evidenced by an arterial wall (arrows) infiltrated and destroyed by neutrophils (hematoxylin and eosin stain, × 400).
Fig. 16
Fig. 16. Eosinophilic granulomatosis with polyangiitis in a 23-year-old male with severe asthma.
A. Axial thin-section CT scan (lung window) at the level of the carina shows an ill-defined nodule surrounded by a halo of ground-glass attenuation (arrow) in the right upper lobe. Note bilateral thickening of bronchial walls (arrowheads). B. Axial thin-section CT at the level of lung bases shows bilateral thickening of bronchioles (arrows), mucous plugging and basilar-predominant centrilobular nodules of varying sizes (arrowheads). C. Lung biopsy was done through video-assisted thoracic surgery. Low-power magnification shows airway destruction (arrows) with submucosal infiltration and luminal filling with lymphocytes and eosinophils (arrowheads) (hematoxylin and eosin stain, × 400).
Fig. 17
Fig. 17. Rheumatoid nodules.
A, B. Axial (A) and sagittal thin-section CT (B) images show numerous subpleural pulmonary necrotic (arrows) and solid (arrowheads) necrobiotic pulmonary nodules.
Fig. 18
Fig. 18. Rheumatoid nodule.
A. Coronal reformatted contrast-enhanced CT shows a peripheral right upper lobe cavitary mass (arrow). B. Surgical gross specimen shows an ill-defined cavitary mass (black arrows) containing necrotic tissue (white arrows). C. Low-power scanning magnification of lung demonstrates a necrotizing granuloma with a central zone of necrosis (white arrow) surrounded by a rim of palisading histiocytes (black arrows). The dark blue periphery of the necrotic zone is nuclear debris (small arrows) (hematoxylin and eosin stain, × 40).

Similar articles

Cited by

References

    1. Myers JL, Tazelaar HD. Challenges in pulmonary fibrosis: 6 · Problematic granulomatous lung disease. Thorax. 2008;63:78–84. - PubMed
    1. Ohshimo S, Guzman J, Costabel U, Bonella F. Differential diagnosis of granulomatous lung disease: clues and pitfalls: number 4 in the series “pathology for the clinician” edited by Peter Dorfmüller and Alberto Cavazza. Eur Respir Rev. 2017;26:170012. - PMC - PubMed
    1. Freundlich IM, Capp MP. Granulomatous disease of the lungs. Radiol Clin North Am. 1973;11:295–316. - PubMed
    1. El-Zammar OA, Katzenstein AL. Pathological diagnosis of granulomatous lung disease: a review. Histopathology. 2007;50:289–310. - PubMed
    1. Colby TV, Specks U. Wegener's granulomatosis in the 1990s--a pulmonary pathologist's perspective. Monogr Pathol. 1993;(36):195–218. - PubMed