. 2021 Jun 16:10:e63104.
doi: 10.7554/eLife.63104.

Intrinsic OXPHOS limitations underlie cellular bioenergetics in leukemia

Affiliations

Intrinsic OXPHOS limitations underlie cellular bioenergetics in leukemia

Margaret Am Nelson et al. Elife. .

Abstract

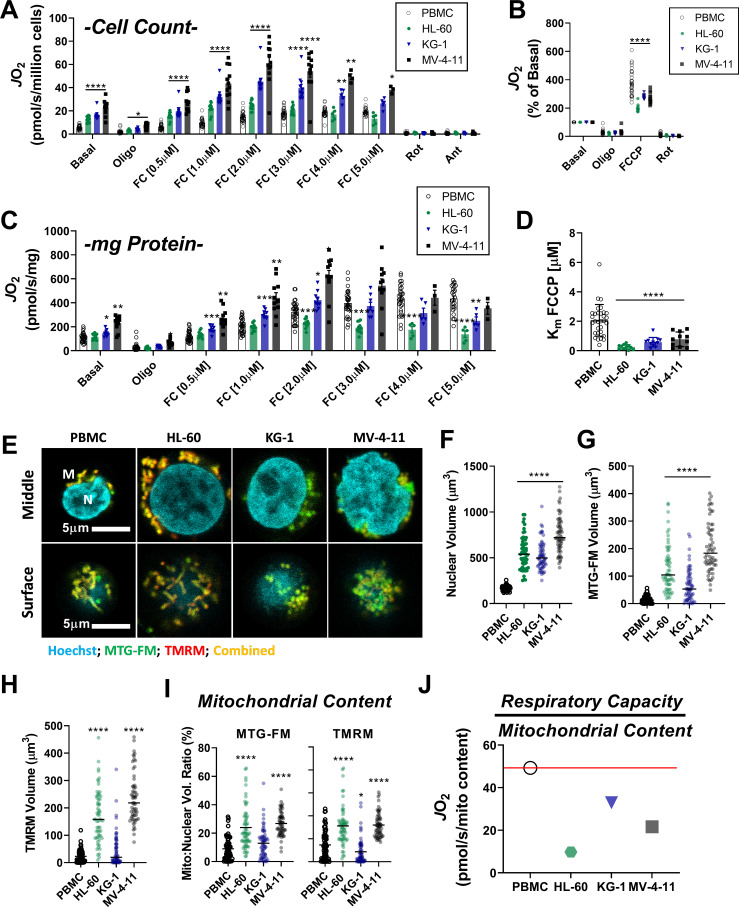
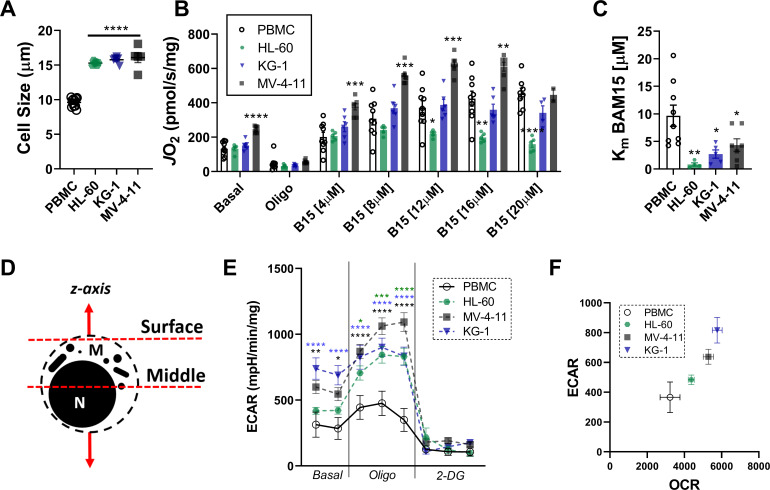
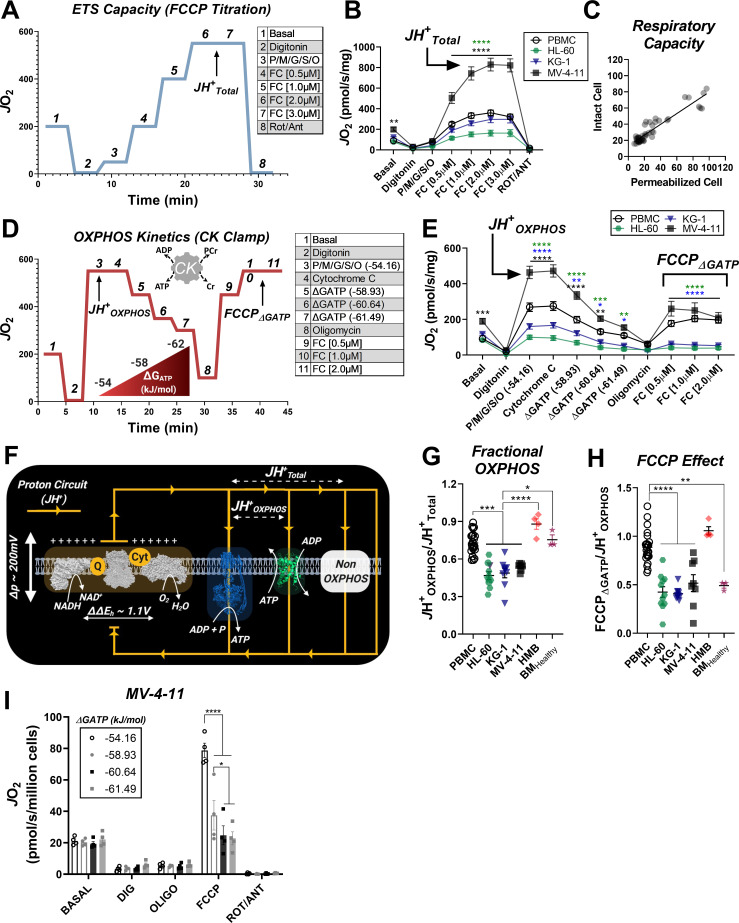
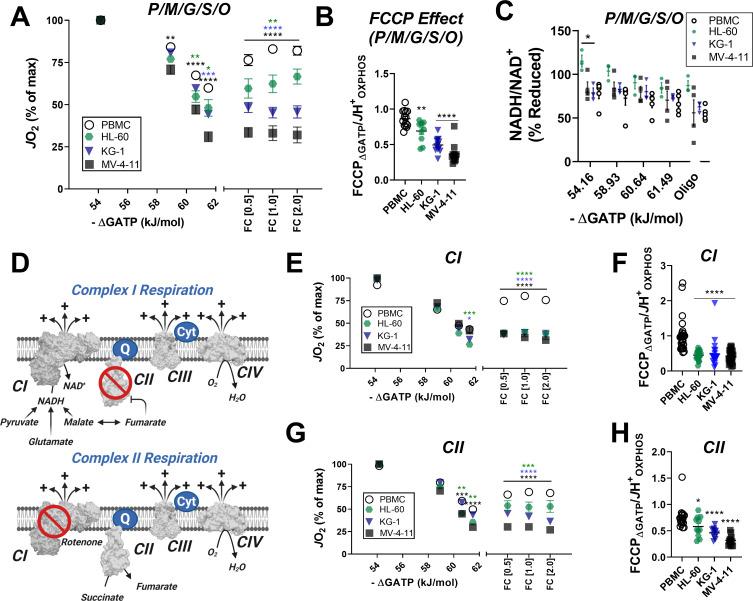
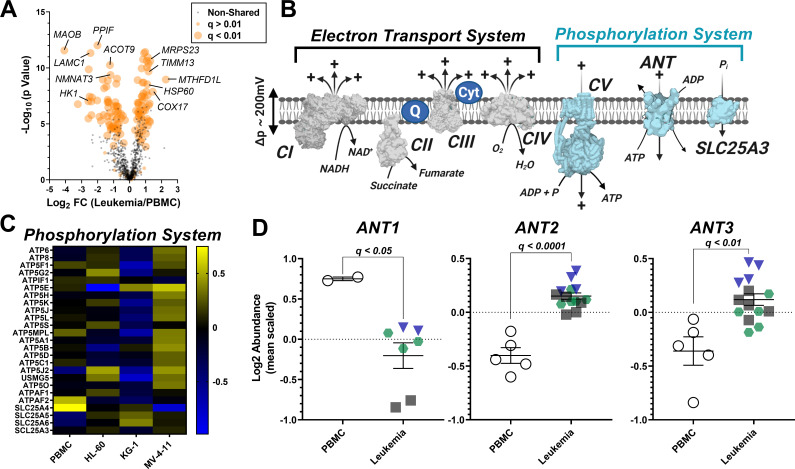
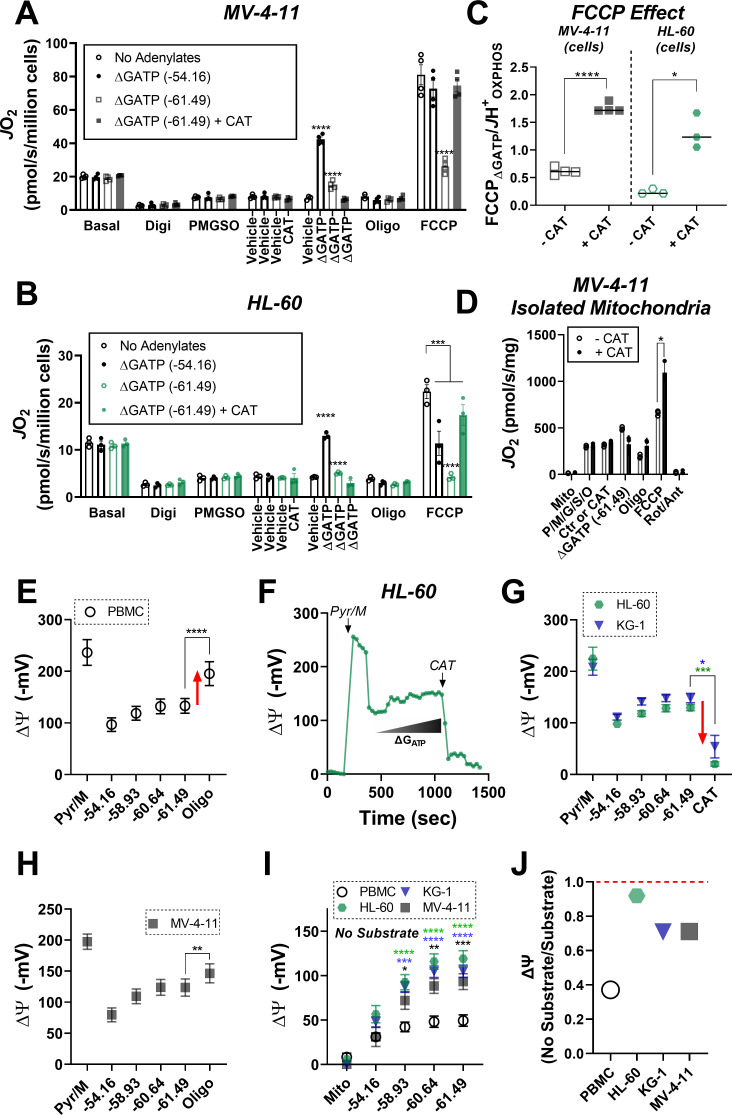
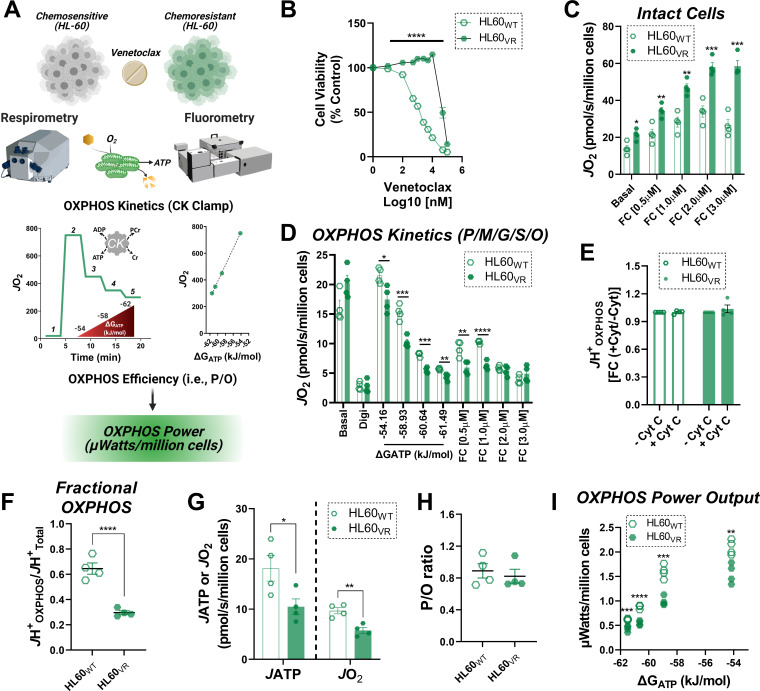
Currently there is great interest in targeting mitochondrial oxidative phosphorylation (OXPHOS) in cancer. However, notwithstanding the targeting of mutant dehydrogenases, nearly all hopeful 'mito-therapeutics' cannot discriminate cancerous from non-cancerous OXPHOS and thus suffer from a limited therapeutic index. Using acute myeloid leukemia (AML) as a model, herein, we leveraged an in-house diagnostic biochemical workflow to identify 'actionable' bioenergetic vulnerabilities intrinsic to cancerous mitochondria. Consistent with prior reports, AML growth and proliferation was associated with a hyper-metabolic phenotype which included increases in basal and maximal respiration. However, despite having nearly 2-fold more mitochondria per cell, clonally expanding hematopoietic stem cells, leukemic blasts, as well as chemoresistant AML were all consistently hallmarked by intrinsic OXPHOS limitations. Remarkably, by performing experiments across a physiological span of ATP free energy, we provide direct evidence that leukemic mitochondria are particularly poised to consume ATP. Relevant to AML biology, acute restoration of oxidative ATP synthesis proved highly cytotoxic to leukemic blasts, suggesting that active OXPHOS repression supports aggressive disease dissemination in AML. Together, these findings argue against ATP being the primary output of leukemic mitochondria and provide proof-of-principle that restoring, rather than disrupting, OXPHOS may represent an untapped therapeutic avenue for combatting hematological malignancy and chemoresistance.

Keywords: OXPHOS; acute myeloid leukemia; biochemistry; cancer bioenergetics; cancer biology; chemical biology; human; mitochondria; mitochondrial proteomics.


Conflict of interest statement

MN, KM, JH, HC, CS, MK, KK, JM, PN, PB, NV, DL, MC, KF No competing interests declared

Figures

Figure 1.
Figure 1.. Leukemia exhibits impaired cellular respiratory capacity amid an increased mitochondrial network.
All experiments were performed in intact cells. FCCP-stimulated flux normalized to cell count (A) and protein concentration (C) and represented as percentage of basal respiration (B). (D) Km of FCCP calculated from FCCP titration (cell lines n = 12, PBMC n = 31). (E-I) Confocal microscopy was performed using two mitochondrial targeted cationic fluorescent dyes, MitoTracker Green FM (MTG-FM) and TMRM. (E) Representative fluorescent images of nuclear volume (F) and mitochondrial volume as measured by MTG-FM (G) and TMRM labeling (H) (n = 65 cells/cell type). (I) Ratios of mitochondrial to nuclear volumes assessed by MTG-FM and TMRM labeling. (J) Respiratory deficiency of cell type calculated by comparing respiratory capacity (the protein-normalized maximal respiration rate) to mitochondrial content (mitochondrial TMRM volume). Data are presented as mean ± SEM and analyzed by two-way ANOVA (A-D) and one-way ANOVA (F-I). *p<0.05, **p<0.01, ***p<0.001, ****p<0.0001.
Figure 1—figure supplement 1.
Figure 1—figure supplement 1.. Morphology of leukemia and respiratory flux stimulated by BAM15, a mitochondrial uncoupler.
(A) Comparison of cell size of leukemia cells and PBMC. Respiratory flux driven by BAM15 (B15), a mitochondrial uncoupler (B) and observed Km (C). (D) Cellular focal planes used to obtain confocal images. (E) Extracellular acidification rate (ECAR) in intact cell. (F) Relationship between ECAR and OCR in intact cells under basal conditions. Data are presented as mean ± SEM and analyzed by one-way ANOVA (A, C), two-way ANOVA (B), or unpaired t-tests (E). n = 5–7 independent experiments. *p<0.05, **p<0.01, ***p<0.001, ****p<0.0001.
Figure 2.
Figure 2.. Impaired OXPHOS kinetics and ATP-dependent inhibition of ETS flux are unique phenotypes of leukemic mitochondria.
All experiments were performed using digitonin-permeabilized cells. (A) Schematic depicting changes in oxygen consumption (JO2) during an ETS capacity protocol (FCCP titration) where points 6–7 represent the maximum proton conductance of the respiratory system (JH+Total). (B) ETS capacity protocol measured in leukemia cell lines and PBMC. (C) Comparison of respiratory capacity between intact and permeabilized experimental conditions across cell types. (D) Schematic depicting JO2 during an OXPHOS kinetics protocol (ΔGATP titration) where point three represents maximum proton conductance by the OXPHOS system (JH+OXPHOS) and point 10–11 represents maximum proton conductance of the respiratory system in the presence of ΔGATP (FCCP ΔGATP). (E) OXPHOS capacity protocol measured in leukemia cell lines and PBMC. (F) Illustration detailing maximal proton current generated by the electron transport system (JH+Total) and proportion of current harnessed by the phosphorylation system (JH+OXPHOS). (G) Comparison of fractional OXPHOS calculated as the ratio of JH+OXPHOS to JH+Total. (H) Comparison of FCCP Effect calculated as the ratio of FCCP ΔGATP to JH+OXPHOS. For all experiments, n = 10 for leukemia cell lines, n = 22 for PBMC, n = 4 for HMB, and n = 3 for BMHealthy. (I) FCCP-stimulated flux was measured under four ATP-free energy (ΔGATP) conditions in permeabilized MV-4–11 cells; n = 4 independent experiments. Data are presented as mean ± SEM and analyzed by two-way ANOVA in (B, E, I) and one-way ANOVA in (G-H). *p<0.05, **p<0.01, ***p<0.001, ****p<0.0001.
Figure 2—figure supplement 1.
Figure 2—figure supplement 1.. Respiratory profile of healthy bone marrow mononuclear cells and primary human myoblasts.
(A–E) Permeabilized cells were used for all experiments. ETS capacity (A) and OXPHOS kinetic (B) protocols were performed in permeabilized BMHealthy. Data depict results from each replicate across samples from three independent donors. ETS capacity (C) and OXPHOS kinetic (D) protocols were performed in permeabilized primary human myoblasts; n = 4 independent experiments. (E) OXPHOS kinetics were performed with PCr and creatine kinase but in the absence of ATP in permeabilized MV-4–11 cells; n = 6 independent experiments. Data are presented as mean ± SEM and analyzed by paired t-test (E). *p<0.05.
Figure 3.
Figure 3.. In leukemic mitochondria ΔGATP regulates ETS flux independent of substrate condition.
(A) OXPHOS kinetics supported by P/M/G/S/O in mitochondria isolated from PBMC and leukemia cells. (B) Comparison of FCCP Effect calculated as the ratio of FCCP ΔGATP to JH+OXPHOS from B. (C) Relationship between ΔGATP and NADH/NAD + redox supported by P/M/G/S/O in mitochondria isolated from leukemia cell lines and PBMC. (D) Schematic depicting CI supported respiration driven by pyruvate/glutamate/malate and inhibition of CII by equilibration of malate/fumarate (top) and CII supported respiration driven by succinate and inhibition of CI by rotenone (bottom). OXPHOS kinetics of mitochondria isolated from PBMC and leukemia cells and supported by Complex I substrates (E) and Complex II substrates (G). FCCP Effect of complex I (F) and complex II (H) supported respiration. (A, B, E–H) n = 7–10 for leukemia cell lines and n = 22 for PBMC. (C) n = 3–5 independent experiments. Data are mean ± SEM and analyzed by one-way ANOVA in (A) and two-way ANOVA in (B–C, E–H). *p<0.05, **p<0.01, ***p<0.001, ****p<0.0001.
Figure 4.
Figure 4.. Analysis of mitochondrial proteome reveal disparate expression of ANT isoforms in leukemia.
TMT-labeled nLC-MS/MS was performed on mitochondrial lysates from each cell type. (A) Volcano plot depicting changes in proteome between leukemia cell lines and PBMC with mitochondrial proteins shown in orange. Significance is indicated by size of each circle with changes in significance (p<0.01) represented by larger circles. (B) Schematic depicting the OXPHOS system with enzymes integral to the ETS shown in gray and the phosphorylation system shown in blue. (C) Heat map displaying the common differentially expressed proteins across the phosphorylation system of leukemia and PBMC. Data are displayed as Log2 protein intensity of all quantified master proteins. (D) Comparison of log2 abundance of ANT isoforms in leukemia and PBMC; n = 4–6 mitochondrial preparations per cell lines. Data are presented as mean ± SEM and analyzed by unpaired t-tests with multiple hypothesis correction (Padjusted, Benjamini Hochberg FDR correction, significance cutoff of q < 0.1).
Figure 4—figure supplement 1.
Figure 4—figure supplement 1.. Heatmap analysis depicting abundance of subunits and assembly factors that comprise the ETS complexes.
Heatmap displaying relative protein abundance of the individual subunits and assembly factors belonging to (A) complex I (B) complex II (C) Complex III and (D) Complex IV.
Figure 5.
Figure 5.. ETS flux inhibition by ΔGATP links to matrix ATP consumption in leukemia.
(A–B) OXPHOS kinetics (via CK clamp) were assessed in the absence of adenylates or in the presence of minimal ΔGATP (−54.16), maximal ΔGATP (−61.49), or maximal ΔGATP + CAT (Carboxyatractyloside; ANT inhibitor). Comparison of OXPHOS kinetics in MV-4–11 (A) and HL-60 cells (B). (C) Ratio of FCCP ΔGATP to JH+OXPHOS with and without CAT in MV-4–11 and HL-60 cells. (D) OXPHOS kinetics measured in the presence of CAT in mitochondria isolated from MV-4–11. (A–D) n = 4 independent experiments per cell type. (E) Mitochondrial membrane potential (ΔΨ) in PBMC isolated mitochondria across a ΔGATP span, followed by CV inhibition with oligomycin; n = 8 independent experiments. (F) Representative trace of ΔΨ in HL-60 isolated mitochondria across a ΔGATP span, followed by ANT inhibition with CAT. (G) Quantification of the experiment depicted in panel F in HL-60 and KG-1 isolated mitochondria; n = 3 independent experiments. (H) Mitochondrial ΔΨ in MV411 isolated mitochondria across a ΔGATP span, followed by CV inhibition with oligomycin; n = 9 independent experiments. (I) Mitochondrial ΔΨ in isolated mitochondria across a ΔGATP span in the absence of any carbon substrates; n = 4 independent experiments. (J) Ratio of group mean ΔΨ generated at ΔGATP = −61.49 kJ/mol in the absence versus presence of carbon substrates (pyruvate, malate). Data are presented as mean ± SEM and analyzed by two-way ANOVA (A–B, I) or paired t-tests (C–E, G–H). *p<0.05, **p<0.01, ***p<0.001, ****p<0.0001.
Figure 5—figure supplement 1.
Figure 5—figure supplement 1.. ETS flux in the presence of ΔGATP is restored by ANT inhibition ANT.
(A) OXPHOS kinetics in permeabilized HL-60 cells in the presence of DMSO (vehicle), bongkrekic acid (20 µM; ANT inhibitor) or gamitrinib (1 µM; TRAP1 inhibitor with mitochondria-targeted moiety); n = 3 independent experiments. (B) Mitochondrial membrane potential (ΔΨ) in HL-60 isolated mitochondria across a ΔGATP span, followed by CV inhibition with oligomycin; n = 3 independent experiments. Data are presented as mean ± SEM and analyzed by two-way ANOVA (A) or paired t-test (B). *p<0.05, **p<0.01, ***p<0.001, ****p<0.0001.
Figure 6.
Figure 6.. 17-AAG and gamitrinib increase fractional OXPHOS and restore ETS flux in the presence of ΔGATP.
(A) Log2 Abundance of TRAP1 in PBMC and leukemia cells. (B) Comparison of OXPHOS kinetics in presence of the TRAP1 inhibitor, 17-AAG (15 µM); n = 4 independent cell experiments. Comparison of (C) Fractional OXPHOS and (D) FCCP Effect in MV-4–11 cells treated with DMSO or 17-AAG (15 µM). (E) Comparison of respiratory flux inhibition within MV-4–11 cells across a range of ΔGATP in the absence and presence of 17-AAG (15 µM). Respiration was stimulated by the addition of FCCP (1 µM), followed by PCR titration to manipulate ΔGATP. (F) Relative abundance of TRAP1 mRNA following shRNA knockdown of TRAP1 in MV-4–11 cells. (G) Basal respiration in intact cells. (H) OXPHOS kinetics in permeabilized MV-4–11 cells infected with lentivirus encoding shRNA targeted to TRAP1 (TRAP1 KD) or scrambled shRNA (Control). (I–J) Fractional OXPHOS and FCCP Effect measured in the presence of vehicle (DMSO), 17-AAG (15 µM), or gamitrinib (1 µM) in control and TRAP1 KD cells. (K) OXPHOS kinetics in permeabilized MV-4–11 cells in the presence of DMSO or curcumin (10–20 µM). FCCP Effect is graphed to the right. (L) Schematic depicting the presumed mechanism of action of 17-AAG, gamitrinib and curcumin in which the compounds selectively block ATP uptake via the VDAC-ANT axis to restore OXPHOS kinetics. (M) Cell proliferation expressed as a percentage of Control. (N) Cell viability in MV-4–11 cells infected with lentivirus encoding shRNA targeted to TRAP1 or scrambled shRNA and treated for 24 hr with increasing concentrations of Ara-C. Additional treatments included gamitrinib (1 µM), 17-AAG (15 µM) or curcumin (10–20 µM) either alone or plus Ara-C (20 µM). Data depicted as viability based on the percentage of vehicle using the propidium iodide assay. (A) n = 4/6/group; (B–D) n = 4 independent experiments; (E–K) n = 3 independent experiments; (M) n = 8 independent experiments; (N) n = 4–6 independent experiments. Data are presented as mean ± SEM analyzed by unpaired t-tests (F–H, M) two-way ANOVA (B, K), one-way ANOVA (A, I, J, N), paired t-tests (B–E). *p<0.05, **p<0.01, ***p<0.001, ****p<0.0001.
Figure 6—figure supplement 1.
Figure 6—figure supplement 1.. Effects of 17-AAG on OXPHOS kinetics.
(A) Comparison of FCCP-stimulated respiration with the addition of 17-AAG (15 µM) in permeabilized MV-4–11 cells; n = 3 independent experiments. (B–D) OXPHOS kinetics in permeabilized HL-60 cells in the presence of DMSO or 17-AAG (15 µM); n = 3 independent experiments. (E–F) OXPHOS kinetics in permeabilized MV-4–11 or KG-1 cells in the presence of DMSO or 17-AAG (15 µM). Cell were energized with either CI (Pyr/M) or CII linked substrates (S/R); n = 3 independent experiments. (G) Schematic of changes in ATP, ADP, PCR, and CR concentrations across a range of ΔGATP. (H) Inhibition of respiration by antimycin A (ANT) across a range of ΔGATP in permeabilized HL-60 cells; n = 3 independent experiments. (I–J) Comparison of respiratory flux inhibition within permeabilized AML cells across a range of ΔGATP induced by functional TRAP1. Respiration was stimulated by the addition of FCCP (1 µM), followed by PCR titration to manipulate ΔGATP; n = 3 independent experiments. (K) ETS capacity assay in permeabilized MV-4–11 cells infected with lentivirus encoding shRNA targeted to TRAP1 (TRAP1 KD) or scrambled shRNA (Control); n = 3 independent experiments. (L) Comparison of OXPHOS kinetics in the presence of DMSO, 17-AAG (15 µM), or gamitrinib (1 µM) in Control and TRAP1 KD cells. Data depicted as a percentage of basal respiration based on oxygen consumption rates obtained prior to digitonin permeabilization; n = 3 independent experiments. Data are presented as mean ± SEM and analyzed by paired t-tests (A–F, H–J) or unpaired t-tests (K–L). *p<0.05, **p<0.01, ***p<0.001, ****p<0.0001.
Figure 7.
Figure 7.. Human primary leukemia is characterized by low Fractional OXPHOS.
(A) Basal respiration in intact cells – ‘PBMC’ (age-matched to the primary leukemia samples); ‘BMHealthy’ (bone marrow mononuclear cells); ‘CD34+’ (pure CD34+ cells not exposed to growth factors); ‘P. Leukemia’ (mononuclear cells isolated from bone marrow of patients with confirmed leukemia); ‘CD34+GFs’ (pure CD34+ cells stimulated to undergo clonal expansion in culture). (B) ETS capacity assay in permeabilized cells. (C) OXPHOS kinetics in permeabilized cells. (D) Fractional OXPHOS. (A–D) n = 3–15 independent experiments. (E) Comparison of OXPHOS kinetics in the presence of DMSO or 17-AAG (15 µM) in a cohort of patients with confirmed AML. Graph to the right depicts JH+OXPHOS depicted as a fold change from DMSO; n = 7 independent cell experiments. (F) Comparison of OXPHOS kinetics in the presence of DMSO or 17-AAG (15 µM) in CD34+GFs; n = 4 independent cell experiments. (E–F) Data depicted as a percentage of basal respiration based on oxygen consumption rates obtained in intact cells. Data are presented as mean ± SEM analyzed by one-way ANOVA (A, D) two-way ANOVA (B–C), or paired t-tests (E–F). *p<0.05, **p<0.01, ***p<0.001, ****p<0.0001.
Figure 7—figure supplement 1.
Figure 7—figure supplement 1.. Effects of 17-AAG on OXPHOS kinetics and cell viability in PBMC and healthy bone marrow mononuclear cells.
(A) Comparison of OXPHOS kinetics in the presence of DMSO or 17-AAG (15 µM) in permeabilized PBMC from healthy donors; n = 5 independent experiments. (B) Comparison of OXPHOS kinetics in the presence of DMSO or 17-AAG (15 µM) in permeabilized BMHealthy. Graph to the right depicts JH+OXPHOS depicted as a fold change from DMSO. Data depicted as a percentage of basal respiration based on oxygen consumption rates obtained in intact cells; n = 3 independent cell experiments. (C) Cell viability in PBMC from healthy donors cultured for 24 hr in the presence of vehicle (DMSO), 17-AAG (15 µM), or gamitrinib (1 µM) plus increasing concentrations of Ara-C. Data depicted as viability based on the percentage of vehicle using the propidium iodide assay; n = 3–4 independent experiments. Data are presented as mean ± SEM and analyzed by paired t-test (A–B) or two-way ANOVA (C). *p<0.05.
Figure 8.
Figure 8.. OXPHOS power output is reduced in the setting of venetoclax resistance.
(A) Study schematic depicting bioenergetic characterization of OXPHOS power output in HL-60 cells either sensitive (HL60WT) or made resistant to venetoclax by continuous exposure to 1 µM venetoclax (HL60VR). (B) Cell viability, expressed as a percentage of control, following 48 hr exposure to increasing concentrations of venetoclax; n = 6 independent experiments. (C) Intact cellular respiration under basal conditions, as well as in response to FCCP titration in bicarbonate free RPMI media. (D) OXPHOS kinetics in permeabilized cells. (E) Effect of cytochrome C addition on JH+OXPHOS. Data expresses as fold change from rates obtained prior to cytochrome C addition. (F) Fractional OXPHOS - note, JH+Total was calculated from the intact cell assay in C using the maximal rate stimulated by FCCP. (G) Rate of ATP synthesis (JATP) and oxygen consumption (JO2) in permeabilized cells energized with P/M/G/S/O. (H) Calculated P/O ratio. (I) Calculated OXPHOS power output. (C–I) n = 4 independent experiments. Data are presented as mean ± SEM analyzed by unpaired t-tests. *p<0.05, **p<0.01, ***p<0.001, ****p<0.0001.

References

    1. Benjamini Y, Hochberg Y. Controlling the false discovery rate: a practical and powerful approach to multiple testing. Journal of the Royal Statistical Society: Series B. 1995;57:289–300. doi: 10.1111/j.2517-6161.1995.tb02031.x. - DOI
    1. Bryant KG, Chae YC, Martinez RL, Gordon JC, Elokely KM, Kossenkov AV, Grant S, Childers WE, Abou-Gharbia M, Altieri DC. A Mitochondrial-targeted purine-based HSP90 antagonist for leukemia therapy. Oncotarget. 2017;8:112184–112198. doi: 10.18632/oncotarget.23097. - DOI - PMC - PubMed
    1. Buck MD, O'Sullivan D, Klein Geltink RI, Curtis JD, Chang CH, Sanin DE, Qiu J, Kretz O, Braas D, van der Windt GJ, Chen Q, Huang SC, O'Neill CM, Edelson BT, Pearce EJ, Sesaki H, Huber TB, Rambold AS, Pearce EL. Mitochondrial dynamics controls T cell fate through metabolic programming. Cell. 2016;166:63–76. doi: 10.1016/j.cell.2016.05.035. - DOI - PMC - PubMed
    1. Byrd JC, Furman RR, Coutre SE, Flinn IW, Burger JA, Blum KA, Grant B, Sharman JP, Coleman M, Wierda WG, Jones JA, Zhao W, Heerema NA, Johnson AJ, Sukbuntherng J, Chang BY, Clow F, Hedrick E, Buggy JJ, James DF, O'Brien S. Targeting BTK with ibrutinib in relapsed chronic lymphocytic leukemia. New England Journal of Medicine. 2013;369:32–42. doi: 10.1056/NEJMoa1215637. - DOI - PMC - PubMed
    1. Calvo SE, Clauser KR, Mootha VK. MitoCarta2.0: an updated inventory of mammalian mitochondrial proteins. Nucleic Acids Research. 2016;44:D1251–D1257. doi: 10.1093/nar/gkv1003. - DOI - PMC - PubMed

Publication types

Substances