Anti‑inflammatory role of microRNA‑429 in human gingival epithelial cells‑inhibition of IL‑8 production through direct binding to IKKβ mRNA
- PMID: 34132371
- PMCID: PMC8223109
- DOI: 10.3892/mmr.2021.12220
Anti‑inflammatory role of microRNA‑429 in human gingival epithelial cells‑inhibition of IL‑8 production through direct binding to IKKβ mRNA
Abstract
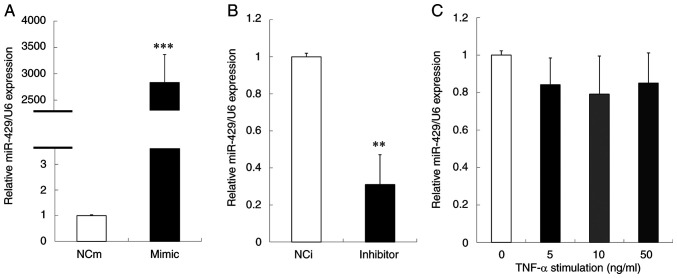
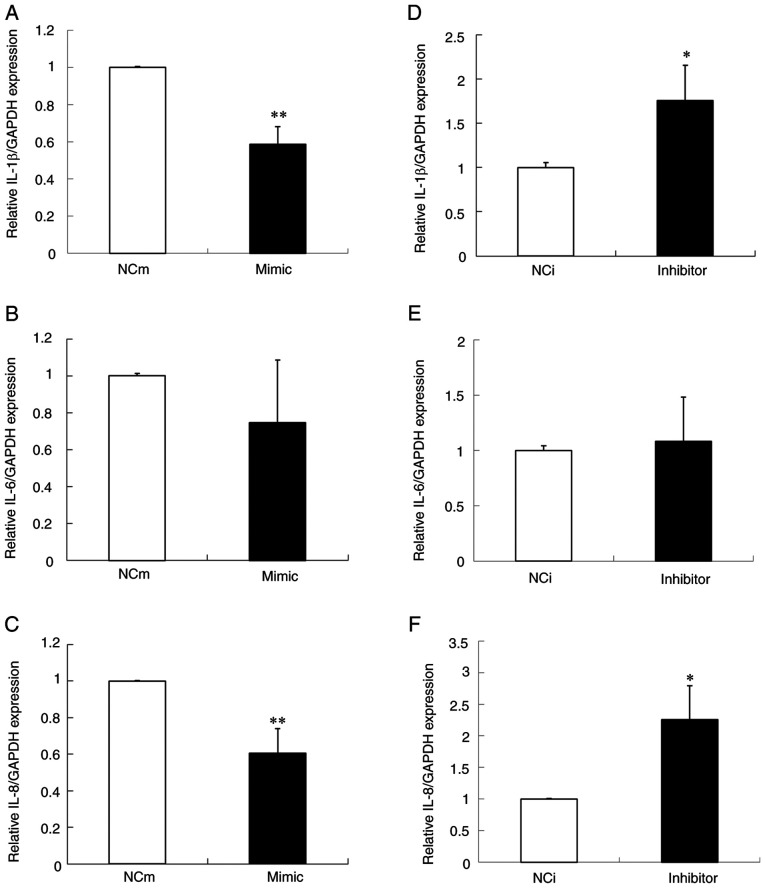
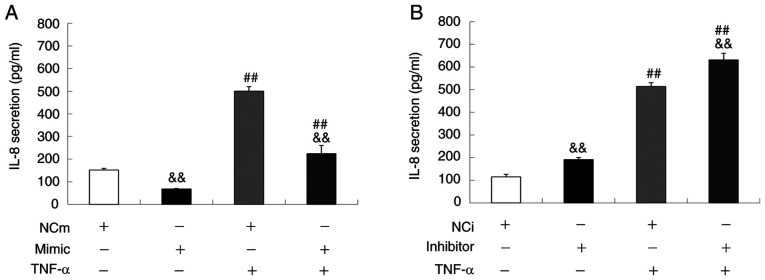
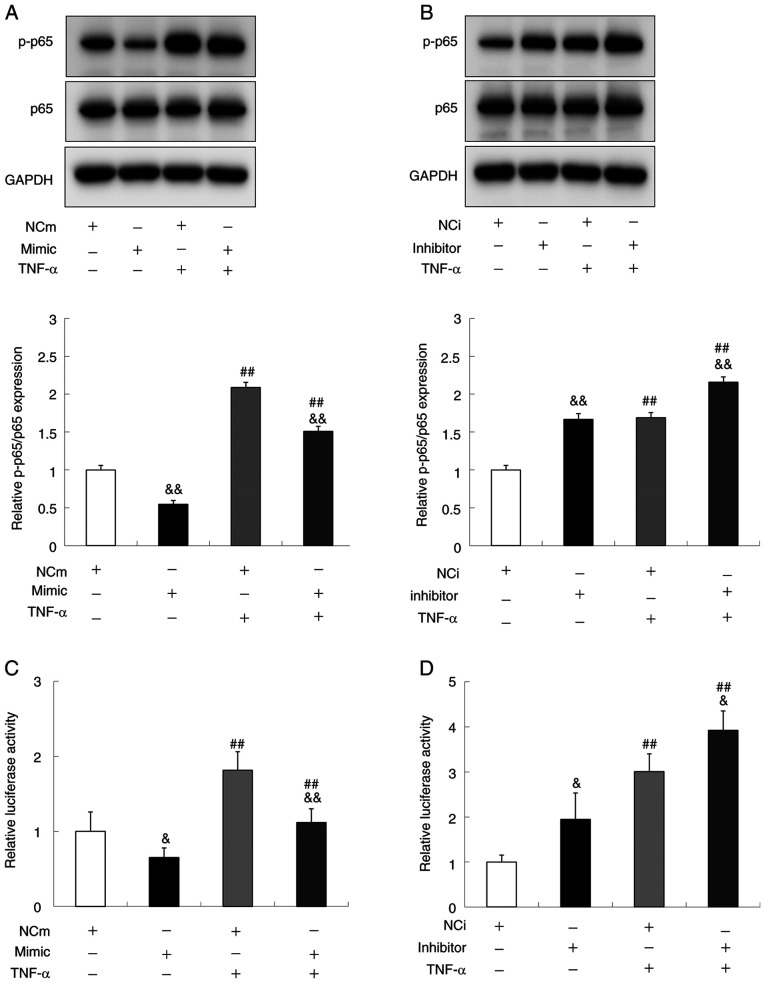
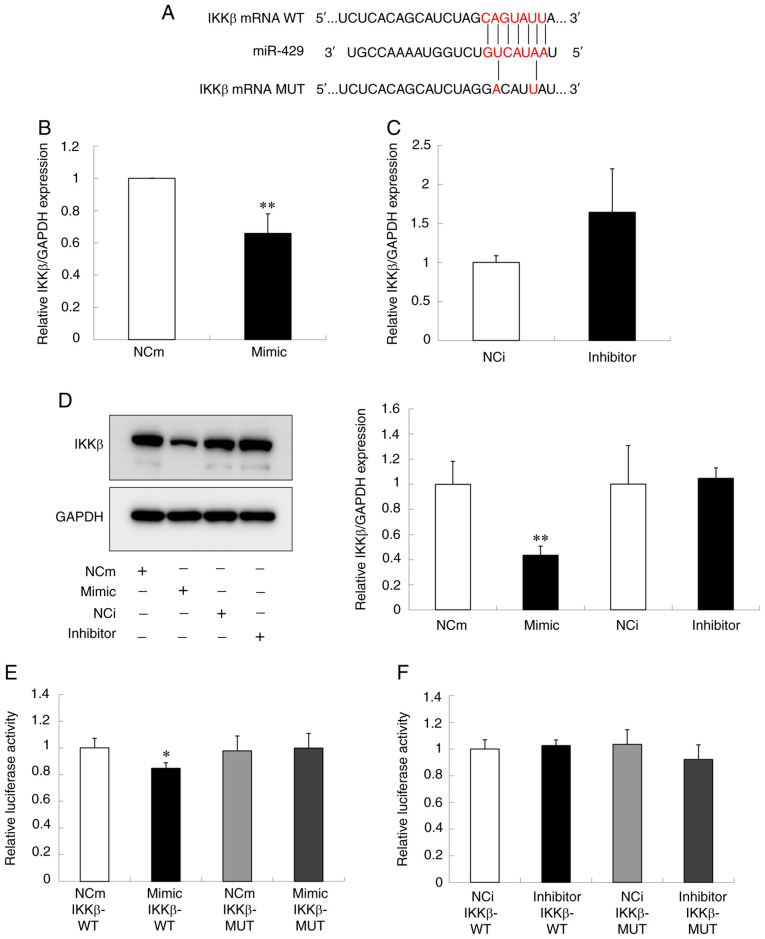
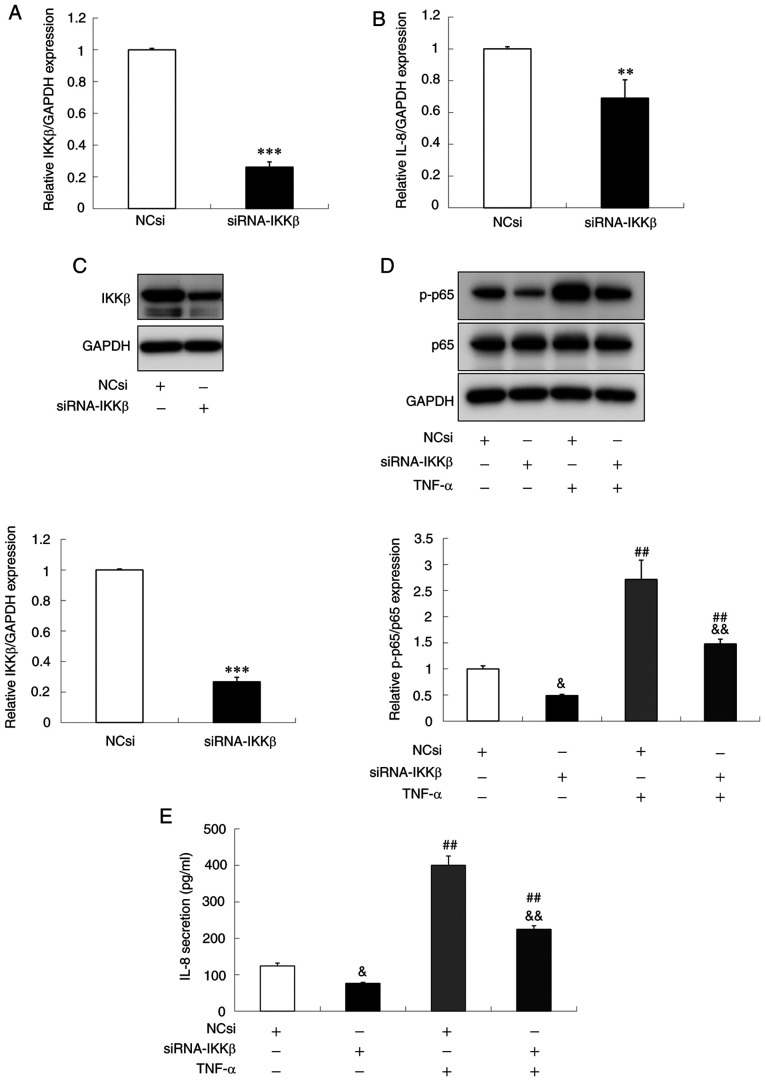
MicroRNAs (miRNAs), a family of small non‑coding RNAs, serve a pivotal role in the regulation of the inflammation by modulating the expression of various genes. However, the molecular mechanism by which miRNAs regulate inflammation‑associated molecules in oral epithelial cells remains to be elucidated. The present study examined the biological function of miR‑429 by performing the gain‑/loss‑of‑function studies of miR‑429 in a gingival squamous cell carcinoma line Ca9‑22 cells that either over‑ or under‑expressed miR‑429 through transient transfection with miR‑429 mimic or miR‑429 inhibitor, respectively. The results demonstrated that the over‑expression of miR‑429 suppressed the mRNA level of several interleukins, including IL‑8. In addition, the over‑expression of miR‑429 reduced IL‑8 secretion under the basal and TNF‑α stimulated conditions, whereas the secretion of IL‑8 was enhanced when miR‑429 was under‑expressed. The over‑expression of miR‑429 inhibited the activation of the transcription factor NF‑κB. Furthermore, we found that miR‑429 suppressed both mRNA and protein levels of IKKβ via its direct binding to the 3'‑untranslated region of IKKβ mRNA. In addition, the downregulation of IKKβ by small interfering RNA reduced both NF‑kB activity and IL‑8 production in Ca9‑22 cells. Taken together, the findings revealed the molecular mechanism of miR‑429 to regulate the inflammatory mediator in gingival cells and suggested that it could be useful as a therapeutic target of oral inflammatory diseases.
Keywords: IKKβ; IL‑8; NF‑κB; gingival epithelial cell; inflammation; microRNA‑429.
Conflict of interest statement
The authors declare that they have no competing interests.
Figures
Similar articles
-
MicroRNA‑16 inhibits interleukin‑13‑induced inflammatory cytokine secretion and mucus production in nasal epithelial cells by suppressing the IκB kinase β/nuclear factor‑κB pathway.Mol Med Rep. 2018 Oct;18(4):4042-4050. doi: 10.3892/mmr.2018.9394. Epub 2018 Aug 17. Mol Med Rep. 2018. PMID: 30132525
-
EBV LMP1 in Gingival Epithelium Potentially Contributes to Human Chronic Periodontitis via Inducible IL8 Production.In Vivo. 2019 Nov-Dec;33(6):1793-1800. doi: 10.21873/invivo.11670. In Vivo. 2019. PMID: 31662504 Free PMC article.
-
MiR-200b attenuates IL-6 production through IKKβ and ZEB1 in human gingival fibroblasts.Inflamm Res. 2018 Dec;67(11-12):965-973. doi: 10.1007/s00011-018-1192-1. Epub 2018 Oct 10. Inflamm Res. 2018. PMID: 30306207 Free PMC article.
-
MicroRNA‑199a‑3p suppresses high glucose‑induced apoptosis and inflammation by regulating the IKKβ/NF‑κB signaling pathway in renal tubular epithelial cells.Int J Mol Med. 2020 Dec;46(6):2161-2171. doi: 10.3892/ijmm.2020.4751. Epub 2020 Oct 12. Int J Mol Med. 2020. PMID: 33125105 Free PMC article.
-
NF-κB-IKKβ Pathway as a Target for Drug Development: Realities, Challenges and Perspectives.Curr Drug Targets. 2018;19(16):1933-1942. doi: 10.2174/1389450119666180219120534. Curr Drug Targets. 2018. PMID: 29468963 Review.
Cited by
-
Streptococcus gordonii Supragingival Bacterium Oral Infection-Induced Periodontitis and Robust miRNA Expression Kinetics.Int J Mol Sci. 2024 Jun 5;25(11):6217. doi: 10.3390/ijms25116217. Int J Mol Sci. 2024. PMID: 38892405 Free PMC article.
-
Construction of lncRNA-miRNA-mRNA network based on ceRNA mechanism reveals the function of lncRNA in the pathogenesis of gout.J Clin Lab Anal. 2022 Jun;36(6):e24451. doi: 10.1002/jcla.24451. Epub 2022 May 6. J Clin Lab Anal. 2022. PMID: 35524416 Free PMC article.
-
HIF-1-Induced hsa-miR-429: Understanding Its Direct Targets as the Key to Developing Cancer Diagnostics and Therapies.Cancers (Basel). 2023 May 25;15(11):2903. doi: 10.3390/cancers15112903. Cancers (Basel). 2023. PMID: 37296866 Free PMC article. Review.
-
Role of microRNAs in immunoregulatory functions of epithelial cells.BMC Immunol. 2024 Dec 20;25(1):84. doi: 10.1186/s12865-024-00675-3. BMC Immunol. 2024. PMID: 39707170 Free PMC article. Review.
-
Therapeutic potential of garlic, aged garlic extract and garlic‑derived compounds on pancreatic cancer (Review).Biomed Rep. 2025 Jan 27;22(3):54. doi: 10.3892/br.2025.1932. eCollection 2025 Mar. Biomed Rep. 2025. PMID: 39926043 Free PMC article. Review.