

Precise transcriptional control of cellular quiescence by BRAVO/WOX5 complex in Arabidopsis roots
- PMID: 34132490
- PMCID: PMC8207686
- DOI: 10.15252/msb.20209864
Precise transcriptional control of cellular quiescence by BRAVO/WOX5 complex in Arabidopsis roots
Abstract
Understanding stem cell regulatory circuits is the next challenge in plant biology, as these cells are essential for tissue growth and organ regeneration in response to stress. In the Arabidopsis primary root apex, stem cell-specific transcription factors BRAVO and WOX5 co-localize in the quiescent centre (QC) cells, where they commonly repress cell division so that these cells can act as a reservoir to replenish surrounding stem cells, yet their molecular connection remains unknown. Genetic and biochemical analysis indicates that BRAVO and WOX5 form a transcription factor complex that modulates gene expression in the QC cells to preserve overall root growth and architecture. Furthermore, by using mathematical modelling we establish that BRAVO uses the WOX5/BRAVO complex to promote WOX5 activity in the stem cells. Our results unveil the importance of transcriptional regulatory circuits in plant stem cell development.
Keywords: BRAVO; WOX5; mathematical modelling; quiescent centre; root growth.
© 2021 The Authors. Published under the terms of the CC BY 4.0 license.
Conflict of interest statement
The authors declare that they have no conflict of interest.
Figures

- A–D
Confocal images of mPS‐PI‐stained 6‐day‐old seedlings of Col‐0 (A), bravo‐2 (B), wox5‐1 (C) and bravo‐2 wox5‐1 (D) mutants. Left black arrows indicate QC cells, and right white arrows indicate CSC. Scale bar: 50 µm.
- E
Quantification of the QC divisions in 6‐day‐old roots expressed in percentage (n > 50, 3 replicates). D: QC divided; ND: QC non‐divided.
- F
Quantification of CSC layers in 6‐day‐old roots expressed in percentage (n > 50, 3 replicates).
- G
Lateral root density (number of lateral roots per mm of root length) of 7‐day‐olf WT, bravo‐2, wox5‐1 and bravo‐2 wox5‐1 mutants (n > 40, 2 replicates). Different letters indicate statistically significant differences (P‐value < 0.05 Student’s t‐test). In the boxplot, box width represents the interquartile range (IQR = Q3‐Q1), with the horizontal line denoting the median, while whiskers extend from Q1‐1.5IQR to Q3+1.5IQR. White dots are the outliers.

- A–G
Confocal images of PI‐stained 6‐day‐old roots. GFP‐tagged expression is shown in yellow. A‐C) pBRAVO:GFP in WT (A), bravo‐2 (B) and wox5‐1 (C) knockout backgrounds. D‐G) pWOX5:GFP in the WT (D), bravo‐2 (E), wox5‐1 (F) and bravo‐2 wox5‐1 (G) knockout backgrounds. Scale bar: 50 µm.
- H, I
Quantification of the GFP fluorescent signal of the roots in A‐C (H) and D‐G (I). Boxplot indicating the average pixel intensity of the GFP in the stem cell niche (n > 25, 3 biological replicates, *P‐value < 0.05 Student’s t‐test for each genotype versus the WT in the same condition). Quantification was done by integrating the GFP signal in each root across defined areas that included the whole SCN (Appendix Fig S7). In the boxplot, box width represents the interquartile range (IQR = Q3‐Q1), with the horizontal line denoting the median, while whiskers extend from Q1‐1.5IQR to Q3+1.5IQR. White dots are the outliers, and black dots are the experimental observations.

- A, B
Schematic representation of the effective regulations in the SCN between BRAVO and WOX5 in the Alleviation (A) and Activation (B) models. (A) In the alleviation model, BRAVO feeds back on its own expression by reducing it and is activated by WOX5. WOX5 also feeds back on its own expression by reducing it, a regulation that becomes partially impaired by BRAVO. (B) In the activation model, BRAVO is also able to activate WOX5 which negatively feedbacks on its own expression. BRAVO is regulated by WOX5 as in the alleviation model.
- C, D
Parameter space exploration of (C) the alleviation and the (D) activation models. Boxplots showing the distribution of stationary promoter pBRAVO (pB) and pWOX5 (pW) fold‐changes in each mutant and overexpression lines over the WT obtained for different parameter values. Superindexes denote the genotype, standing bravo for bravo mutant, wox5 for wox5 mutant, dm for the bravo wox5 double mutant, Woe for WOX5 overexpression and Boe for BRAVO overexpression. Box width represents the interquartile range (IQR = Q3‐Q1), with the horizontal line denoting the median, while whiskers extend from Q1‐1.5IQR to Q3+1.5IQR. The results are obtained by solving N = 1,000 different runs of each model at the stationary state (red and blue stripplots) for the WT, mutants and overexpressor scenarios. These N runs differ in the parameter values, which are chosen at random from a uniform distribution between P 0/2 and 2P 0, where P 0 is the default set of non‐dimensional parameter values (see Appendix Table S1). For each run, the WT, mutants and overexpressor scenarios are computed all with the same parameter values. Circles denote the fold‐change obtained in each run, which indicates the fold‐change predicted by the model for that parameter set. These are to be compared with the experimental values of the fold‐changes of the mean expressions in the mutants and overexpressor lines over the mean WT expression, which are represented by the red and blue squares overlaying the box plots, with error bars denoting ± standard deviations. The experimental values are computed from the same data as in Fig 2H and I, Appendix Figs S3 and S4). The horizontal grey line at promoter fold‐change = 1 is indicated to visually separate the region of fold‐change < 1 (i.e. the promoter activity is reduced in the mutant or in the overexpressor line) from the region where the fold‐change > 1 (i.e. the promoter activity is increased in the mutant or in the overexpressor line).
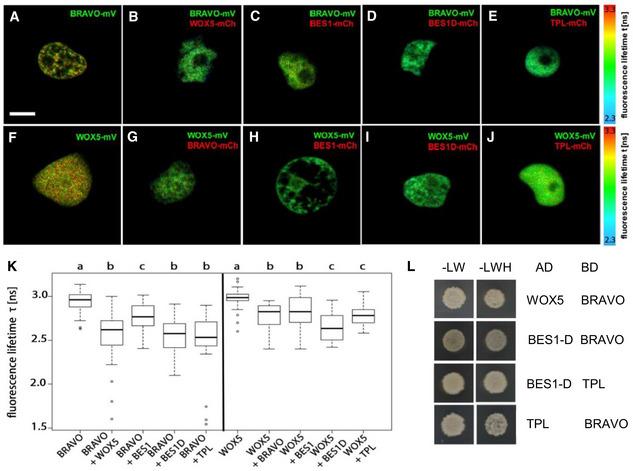
- A–J
Interaction of BRAVO with WOX5 (B), BES1 (C), BES1‐D (D) and TPL (E); and interaction of WOX5 with BRAVO (G), BES1 (H), BES1‐D (I) and TPL (J) measured by FRET‐FLIM. GFP fluorescence lifetime τ [ns] was measured in transiently expressing Nicotiana benthamiana leaf epidermal cells. GFP fluorescence lifetime fitted pixel‐wise with a mono‐exponential model of BRAVO and WOX5 interactions. mV, mVenus; mCh, mCherry. Scale bar: 5 µm.
- K
Fluorescence‐weighted average lifetimes of BRAVO and WOX5 interactions fitted with a double‐exponential model of the indicated samples are summarized in box plots. Statistical significance was tested by one‐way ANOVA with a Sidakholm post hoc test. Different letters indicate statistically significant differences (P‐value < 0.01). For each combination, two to three independent experiments were carried out, and in total, more than 20 biological replicates were measured. In the boxplot, box width represents the interquartile range (IQR = Q3‐Q1), with the horizontal line denoting the median, while whiskers extend from Q1‐1.5IQR to Q3+1.5IQR. White dots are the outliers.
- L
Yeast two‐hybrid assay showing BRAVO interacting with WOX5, BES1‐D and TPL; and BES1‐D interacting with TPL. In the left column, yeast cells were grown on control media, and in the right column yeast cells were grown on control media lacking Leu, Trp and His, indicating an interaction between the proteins.

Computational estimation of the contributions of BRAVO‐mediated (), WOX5‐mediated () and BRAVO‐WOX5 joint () regulations of QC divisions in the WT, as a function of the attenuating factor of BRAVO contribution in the wox5 mutant, . Continuous lines represent the best estimated values, while dashed lines are the enveloping confidence intervals (e.g. ). The horizontal grey dashed lines mark the zero lines. For a wide range of values, the joint contribution of BRAVO and WOX5 is the only one relevant. The individual contribution of BRAVO becomes significant only for small values of . In all three panels, we set = 0.8. Positive contributions correspond to repression of QC divisions, while negative contributions correspond to activation of QC divisions.
Sketch representing the spatial distribution of BRAVO, WOX5 and their product BRAVO x WOX5, which can be interpreted as the protein complex. Their joint interaction peaks at the QC, where repression of cell division occurs.

Scheme of the methodology used for the QC‐specific RNA‐seq. Plants expressing pWOX5:GFP in WT, bravo‐2 and wox5‐1 background were used for protoplasting followed by Fluorescent Activated Cell Sorting (FACS) to isolate QC cells for RNA sequencing.
Area‐proportional Venn diagram showing the overlap between BRAVO and WOX5‐regulated genes in the QC (q value < 0.05 and FC > 1).
Expression of the 380 common BRAVO and WOX5‐regulated genes from (B).
Expression of the 53 genes from (C) showing similar expression in bravo and wox5 mutants.
Expression of the 41 genes from (C) showing opposite expression levels in bravo and wox5 mutants.
References
-
- Banda J, Bellande K, von Wangenheim D, Goh T, Guyomarc'h S, Laplaze L, Bennett MJ (2019) Lateral root formation in Arabidopsis: a well‐ordered LRexit. Trends Plant Sci 24: 826–839 - PubMed
-
- Bennett T, van den Toorn A, Willemsen V, Scheres B (2014) Precise control of plant stem cell activity through parallel regulatory inputs. Development 141: 4055–4064 - PubMed
-
- van den Berg C, Willemsen V, Hage W, Weisbeek P, Scheres B (1995) Cell fate in the Arabidopsis root meristem determined by directional signalling. Nature 378: 62–65 - PubMed
-
- van den Berg C, Willemsen V, Hendriks G, Weisbeek P, Scheres B (1997) Short‐range control of cell differentiation in the Arabidopsis root meristem. Nature 390: 287–289 - PubMed
Publication types
MeSH terms
Substances
LinkOut - more resources
Full Text Sources
Molecular Biology Databases
Miscellaneous
