. 2021 Sep 27;38(10):4362-4375.
doi: 10.1093/molbev/msab173.

Fluctuating Environments Maintain Genetic Diversity through Neutral Fitness Effects and Balancing Selection

Affiliations

Fluctuating Environments Maintain Genetic Diversity through Neutral Fitness Effects and Balancing Selection

Farah Abdul-Rahman et al. Mol Biol Evol. .

Abstract

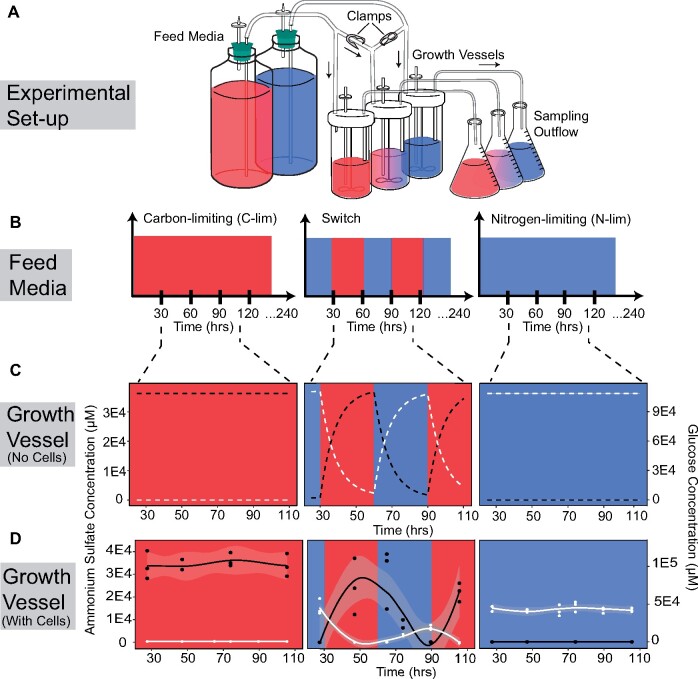
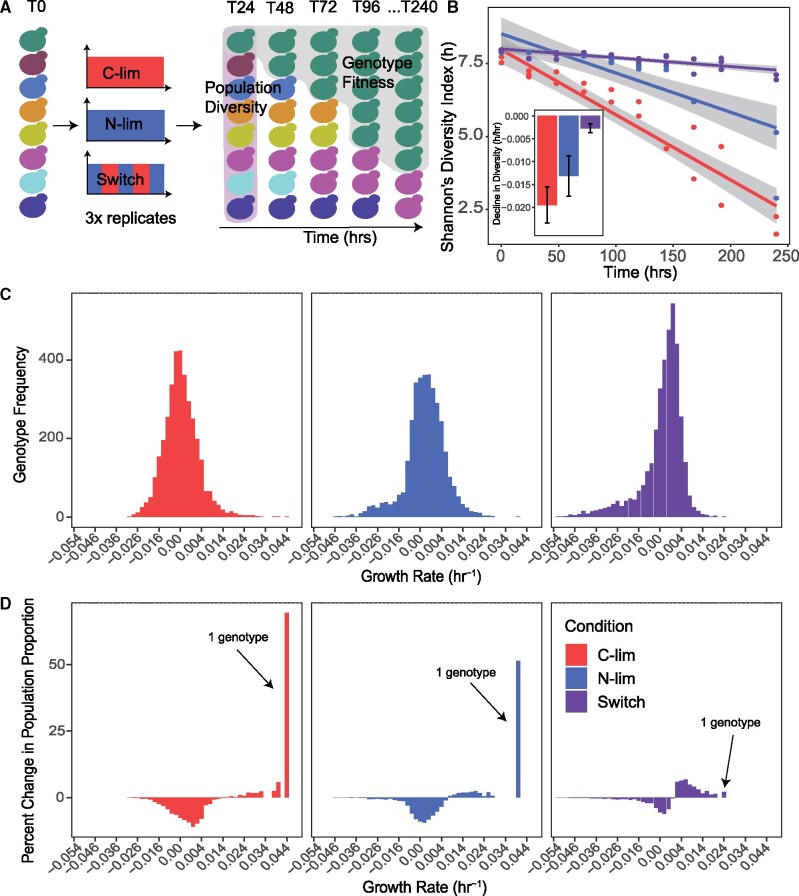
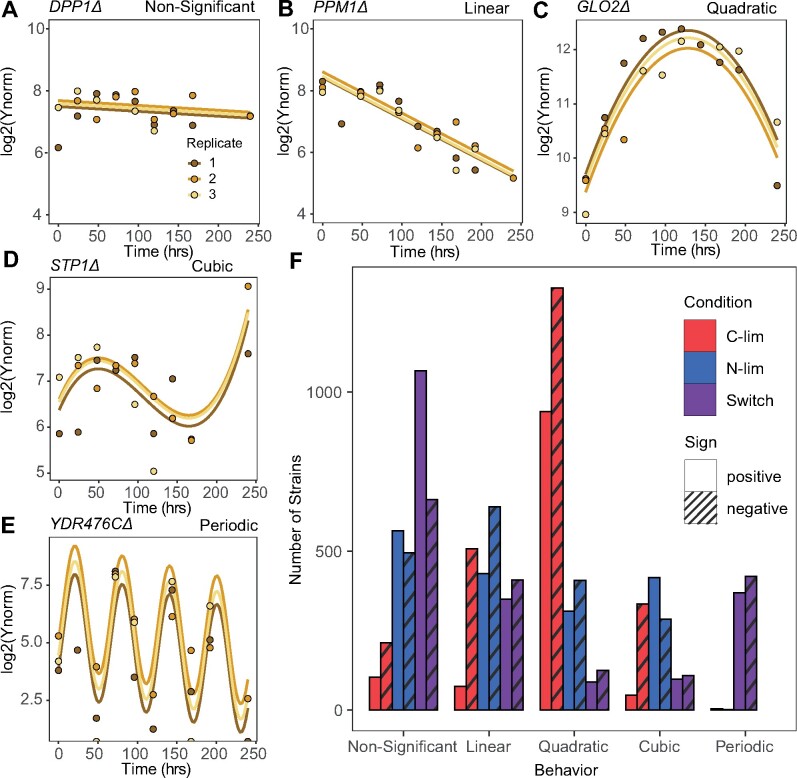
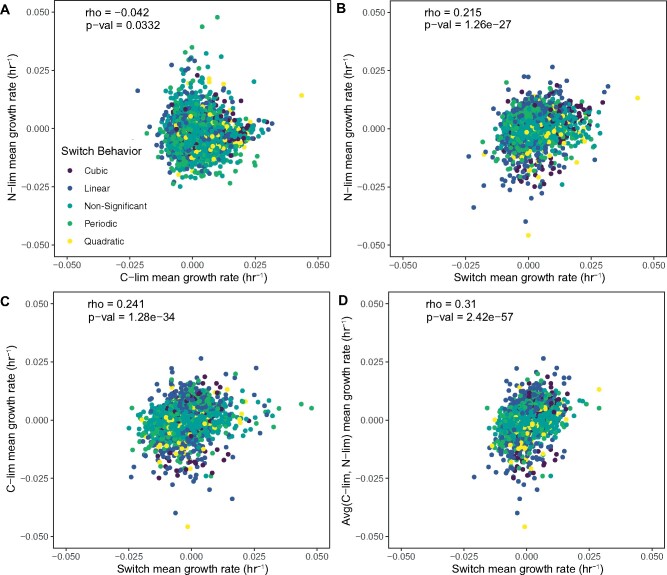
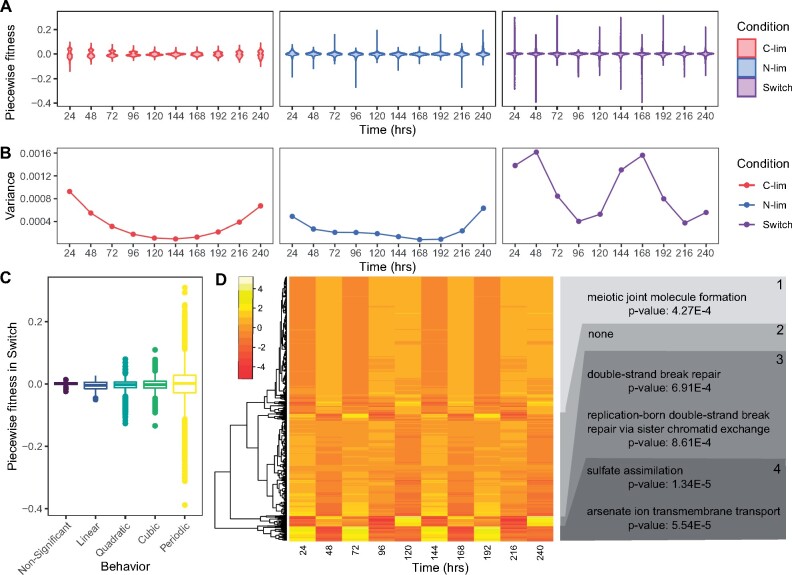
Genetic variation is the raw material upon which selection acts. The majority of environmental conditions change over time and therefore may result in variable selective effects. How temporally fluctuating environments impact the distribution of fitness effects and in turn population diversity is an unresolved question in evolutionary biology. Here, we employed continuous culturing using chemostats to establish environments that switch periodically between different nutrient limitations and compared the dynamics of selection to static conditions. We used the pooled Saccharomyces cerevisiae haploid gene deletion collection as a synthetic model for populations comprising thousands of unique genotypes. Using barcode sequencing, we find that static environments are uniquely characterized by a small number of high-fitness genotypes that rapidly dominate the population leading to dramatic decreases in genetic diversity. By contrast, fluctuating environments are enriched in genotypes with neutral fitness effects and an absence of extreme fitness genotypes contributing to the maintenance of genetic diversity. We also identified a unique class of genotypes whose frequencies oscillate sinusoidally with a period matching the environmental fluctuation. Oscillatory behavior corresponds to large differences in short-term fitness that are not observed across long timescales pointing to the importance of balancing selection in maintaining genetic diversity in fluctuating environments. Our results are consistent with a high degree of environmental specificity in the distribution of fitness effects and the combined effects of reduced and balancing selection in maintaining genetic diversity in the presence of variable selection.

Keywords: chemostat; fluctuating selection; genetic diversity.


Figures

Fig. 1.
Fig. 1.
Periodically fluctuating environments in the chemostat. (A) We used chemostat cultures to study evolutionary dynamics in static and fluctuating conditions. To switch between media types in the fluctuating condition (middle panels), clamps were used to turn on or off the media flow. (B) Populations were cultured in either carbon-limited (C-lim) media ([glucose] = 444.4 μM, [ammonium sulfate] = 37 mM), nitrogen-limited (N-lim) media ([glucose] = 111.1 mM, [ammonium sulfate] = 400 μM), or media that switched between the two nutrient-limiting conditions every 30 hours (i.e., a period of 60 hours). All selections were maintained for a total of 240 hours. (C) An ordinary differential equation model was used to determine the expected concentrations of glucose (white), the sole carbon source, and ammonium sulfate (black), the sole nitrogen source, in the culture vessels in the absence of cellular consumption. (D) We experimentally measured glucose (white) and ammonium sulfate (black) concentrations in each of the culture vessels to determine the contribution of cellular consumption to environmental nutrient concentrations. Measured values of glucose in C-lim and ammonium sulfate in N-lim are close to (low micromolar range), but not equal to, zero.
Fig. 2.
Fig. 2.
Fluctuating selective conditions maintain greater genetic diversity than static selective conditions. A single-gene deletion library containing ∼4,000 distinct gene knockout mutants was grown for 240 hours (approximately 40 generations) in static carbon-limitation, static nitrogen-limitation, and switching conditions in biological triplicate. Populations were sampled every 24 hours for a total of 10 time points. Barseq was used to estimate relative genotype abundance at each time point (Materials and Methods). (A) Population diversity and genotype fitness were computed based on changes in mutant abundance across time (supplementary methods, Supplementary Material online). (B) The changes in Shannon’s diversity index show a clear reduction in population diversity over time in static conditions, but not in a fluctuating environment. The inset shows the rate of change for each condition, with error bars indicating the upper and lower bounds of the 95% confidence interval. (C) The distribution of growth rates, relative to the arithmetic mean over all genotypes, for ∼4,000 genotypes in each condition estimated over the complete 240 hours of growth and (D) the change in the population proportion within each growth rate bin between t = 0 and t = 240 hours.
Fig. 3.
Fig. 3.
Diverse temporal trajectories of genotypes in different selective conditions. Temporal dynamics of genotypes across time fit to (A) nonsignificant, (B) linear, (C) quadratic, (D) cubic, and (E) periodic models across time. (F) The distribution of temporal dynamics in each condition. Abundance changes are categorized as positive or negative based on the change in average growth rate between t = 0 and t = 240. Model fits for periodic models were defined as positive or negative on the basis of phase.
Fig. 4.
Fig. 4.
A subset of genotypes has a predictive relationship between fluctuating and static selective conditions. (A) The correlation in temporal mean growth rate per cell of genotypes between the two static conditions is low. There is an intermediate correlation between the temporal mean growth rate per cell of the Switch condition and C-lim (B) and N-lim (C). The relationships between temporal mean growth rate per cell in the switch conditions and the average of the temporal mean growth rate per cell for the two static conditions has the highest correlation (D). Point colors indicate the model fit of the genotype as described in figure 3.
Fig. 5.
Fig. 5.
The switch condition uniquely results in short-term fitness changes that are not detected over larger timescales. (A) Piecewise (temporal mean) relative fitness measurements were calculated by obtaining the difference between log normalized abundance at consecutive time points and dividing by the difference in time. Violin plots represent the distributions of piecewise fitness in each condition. (B) The variance of fitness measurements in each condition shows unique trends over time. (C) The distribution of piecewise fitness values according to best model fit. (D) Heatmap of scaled piecewise fitness for all periodically oscillating genotypes in the switch condition falling into four defined clusters. GO-terms that are enriched in each cluster are labeled on the right-hand side.

References

    1. Airoldi EM, Miller D, Athanasiadou R, Brandt N, Abdul-Rahman F, Neymotin B, Hashimoto T, Bahmani T, Gresham AD.. 2016. Steady-state and dynamic gene expression programs in Saccharomyces cerevisiae in response to variation in environmental nitrogen. Mol Biol Cell. 27(8):1383–1396. - PMC - PubMed
    1. Bell G.2008. Selection. Oxford: Oxford University Press.
    1. Bell G.2010. Fluctuating selection: the perpetual renewal of adaptation in variable environments. Philos Trans R Soc Lond B Biol Sci. 365(1537):87–97. - PMC - PubMed
    1. Bergland AO, Behrman EL, O'Brien KR, Schmidt PS, Petrov DA.. 2014. Genomic evidence of rapid and stable adaptive oscillations over seasonal time scales in Drosophila. PLoS Genet. 10(11):e1004775. - PMC - PubMed
    1. Bertram J, Masel J.. 2019. Different mechanisms drive the maintenance of polymorphism at loci subject to strong versus weak fluctuating selection. Evolution 73(5):883–896. - PubMed

Publication types