Review
. 2021 Jun 16;12(1):79.
doi: 10.1186/s13244-021-01024-3.

Differential diagnosis of uncommon prostate diseases: combining mpMRI and clinical information

Affiliations
Review

Differential diagnosis of uncommon prostate diseases: combining mpMRI and clinical information

Chao Han et al. Insights Imaging. .

Abstract

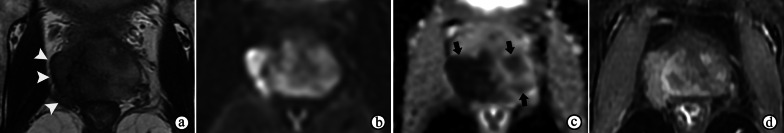
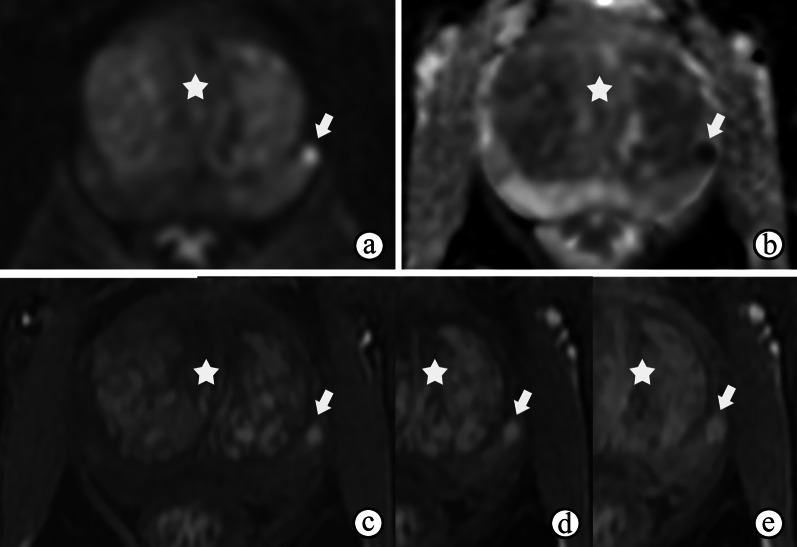
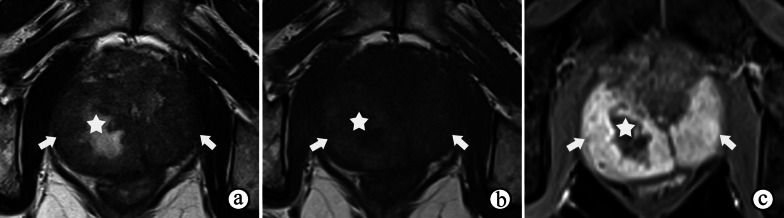
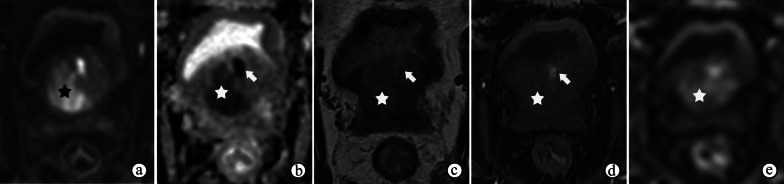
The differential diagnosis of abnormalities in the prostate is broad, covering common (acinar adenocarcinoma, benign prostatic hyperplasia, chronic prostatitis, hemorrhage, cysts, calcifications, atrophy and fibrosis) and less common conditions (tumors other than acinar adenocarcinoma, granulomatous prostatitis containing tuberculosis, abscesses and other conditions, and idiopathic disorders such as amyloidosis and exophytic benign prostatic hyperplasia). Recent advances in magnetic resonance imaging (MRI) of the prostate gland and imaging guidelines, such as the Prostate Imaging Reporting and Data System version 2.1 (PI-RADS v2.1), have dramatically improved the ability to distinguish common abnormalities, especially the ability to detect clinically significant prostate cancer (csPCa). Overlap can exist in the clinical history and imaging features associated with various common/uncommon prostate abnormalities, and biopsy is often required but is invasive. Prostate abnormalities can be divided into two categories: category 1, diseases for which PI-RADS scores are suitable for use, and category 2, diseases for which PI-RADS scores are unsuitable for use. Radiologists must have an intimate knowledge of other diseases, especially uncommon conditions. Past relevant history, symptoms, age, serum prostate-specific antigen (PSA) levels, MRI manifestations, and the applicability of the PI-RADS assessment should be considered when diagnosing prostate abnormalities.

Keywords: Magnetic resonance imaging; Prostate; Uncommon prostatic diseases.


Conflict of interest statement

The authors declare that they have no competing interests.

Figures

Fig. 1
Fig. 1
BPH in a 66-year-old man with an elevated serum PSA level fluctuating from 4 to 10 ng/mL. a–g Axial T2-weighted images captured in Jan 2010 (size of 1.3 cm), May 2012, Mar 2013, Dec 2013, Feb 2015, May 2015, and Jul 2019 (size of 2.6 cm) show a gradually increasing nodule with heterogeneous hyperintensity and a well-defined capsule in the left peripheral zone (arrow), the size of which increases with the progress of BPH in the TZ (☆)
Fig. 2
Fig. 2
Nonspecific granulomatous prostatitis in a 57-year-old male who experienced frequency, urgency and burning micturition for 1 month, with a serum PSA level of 18.67 ng/mL transiting to 5.04 ng/mL. a–c T2WI, DWI at a b-value of 1400 s/mm2 and ADC maps show a diffusely and multifocally low signal intensity in the surrounding parenchyma on T2WI (a), a high signal intensity on DWI (b) and low ADC values (arrows on c in the prostate, with extraprostatic extension (arrowheads on a). (d) DCE imaging shows diffuse and multifocal areas of enhancement. The abnormal appearances of the prostate in the images shown in a–d result in a PI-RADS score of 5
Fig. 3
Fig. 3
Nonspecific granulomatous prostatitis in a 57-year-old male with dysuria and urinary retention for 1 month and a serum PSA level of 13.22 ng/mL. a, b DWI at a b-value of 1400 s/mm2 and ADC maps show a focal nodule with obviously restricted diffusion (arrow) in the left peripheral zone of the prostate. c–e DCE imaging shows early and prolonged enhancement of the nodule (arrow). The appearances of the nodule in a–e result in a PI-RADS score of 4. Note the prostatic hyperplasia in the TZ (☆), which may have caused the symptoms of dysuria and urinary retention
Fig. 4
Fig. 4
Diffuse granulomatous prostatitis in a 67-year-old male. a T2WI shows diffuse swelling of bilateral peripheral zones and the signal intensity is diffusely decreased (arrow). b T1WI shows a diffusely increased signal intensity in the bilateral PZs (arrow). c DCE imaging shows a rapid enhancement of bilateral PZs (arrow). Note the central necrosis in the lesion (☆)
Fig. 5
Fig. 5
Prostate abscess in a 68-year-old male with dysuria for 2 months and a serum PSA level of 9.50 ng/mL, 16.9 white blood cells/high power field in urine and 1.7 epithelial cells /high power field in urine. a, b T2- and T1-weighted imaging show a mass with high T2 signal intensity and low T1 signal intensity (☆) in the PZ compressing the rectum. c, d The interior of the mass shows a very high signal intensity on DWI at a b-value of 800 s/mm2 and a very low signal intensity on the ADC maps (☆). e DCE imaging shows enhancement of the rim and separations in the middle (arrow)
Fig. 6
Fig. 6
Genitourinary tuberculosis in a 26-year-old man with a right scrotal skin ulceration accompanied by pus discharge and a strongly positive tuberculin skin test. a Computed tomography image shows an enhanced nodule in the right epididymis (arrowhead) with testicular hydrocele (arrow). b T2WI shows prostate atrophy and multiple extremely hypointense nodules inside the tissue (arrowheads). c T2WI shows slightly inhomogeneous signal intensity of the prostate. d DWI at a b-value of 800 s/mm2 shows slight hypointensity of the nodules (arrowheads)
Fig. 7
Fig. 7
Intraductal carcinoma of the prostate in an 80-year-old man, with an elevated serum PSA level for 2 years, which was 24.46 ng/mL at the most recent measurement. a, b DWI at a b-value of 1400 s/mm2 and ADC maps show a lobulated mass with restricted diffusion in the prostate (☆). c Axial T2-weighted imaging shows isointensity with an ill-defined edge of the mass (☆). d, e Axial DCE MRI at 60 s (d) and 80 s (e) after contrast injection shows no prominent enhancement of the mass (☆). Note the hemorrhagic area in the prostate gland (arrow)
Fig. 8
Fig. 8
Mixed ductal and acinar adenocarcinoma in an 87-year-old man with dysuria for 12 months and a serum PSA level of 30.24 ng/mL. a–c Axial T2-, axial T1-, and coronal fat-suppressed T2-weighted imaging show a multilocular cyst mass occupying the prostate, periprostatic fat and bilateral seminal vesicles (black arrow on c), with heterogeneous signal intensity in cysts and multifocal solid areas (arrowheads on a), and a cyst with a thick wall and a mural nodule (arrows on a, b). d, e DWI at a b-value of 1000 s/mm2 and ADC maps show inhomogenously restricted diffusion of the solid areas (arrowheads) and the thick wall (arrows). f DCE imaging shows heterogeneous enhancement of the mass
Fig. 9
Fig. 9
Local recurrence of urothelial carcinoma of the prostate in a 63-year-old man 1 year after completing chemotherapy. a–c Coronal fat-suppressed T2- (a) and axial T2WI (b, c) show an inhomogeneously isointense mass primarily located in the left lobe of the prostate and left seminal vesicle, invading a corner of the bladder (arrow on c). d, e DWI at a b-value of 1400 s/mm2 and ADC maps show restricted diffusion in the periphery of the mass
Fig. 10
Fig. 10
Prostatic stromal sarcoma in a 49-year-old man with a mildly elevated serum PSA level of 7.5 ng/mL. a–c Axial fat-suppressed T1WI, ADC maps and T2WI show a mass containing solid and necrotic components (☆). The high signal intensity area on axial fat-suppressed T1WI (a) and the low signal intensity area on ADC maps (b) both suggest a hemorrhagic change (arrowhead). c Coronal fat-suppressed T2WI shows an incomplete capsule around the mass and the right seminal vesicle compressed by the mass (arrowhead). b, d ADC maps and coronal fat-suppressed T2WI show enlarged pelvic lymph nodes (arrow)
Fig. 11
Fig. 11
Prostatic stromal sarcoma in a 41-year-old man with a normal serum PSA level of 0.784 ng/mL. a Axial T2WI shows an oval mass occupying the prostate with heterogeneous hyperintensity, an incomplete hypointense capsule and compressing the bladder (arrowhead). b, c Axial DWI and ADC maps show cystic areas occupying the majority of the mass (☆), but containing focal solid components with remarkably restricted diffusion (arrow). d Axial fat-suppressed T1WI shows the mass containing a slightly high signal intensity, which suggested a hemorrhagic change (arrow). (e–f) Axial DCE imaging (e) shows that the mass had diffuse but no enhancement of the cystic components (f, curve 2) accompanied by a gradual moderate enhancement restricted to the solid components (f, curve 1)
Fig. 12
Fig. 12
Prostate stromal tumor of uncertain malignant potential in a 39-year-old man with a normal serum PSA level of 1.780 ng/mL. a Axial T2WI shows a well-circumscribed nodule with heterogeneous signal and an incomplete capsule (arrowheads) located in the left PZ of the prostate and compressing the extra-prostatic tissue. b DWI shows hypointensity, indicating no restricted diffusion of the nodule. c–f Axial DCE imaging at 30 s (c), 60 s (d), 120 s (e) and 180 s (f) after contrast injection shows the early and gradual enhancement of the nodule
Fig. 13
Fig. 13
Prostate stromal tumor of uncertain malignant potential in a 33-year-old man with a normal serum PSA level of 1.080 ng/mL. a Axial T2WI shows a 2.7-cm nodule with heterogeneous signal in the TZ of the prostate surrounded by a capsule-like hypointense rim (arrowhead). b, c DWI and ADC maps show remarkably restricted diffusion of most of the nodule (☆). d–f Axial DCE imaging at 30 s (d), 60 s (e) and 120 s (f) after contrast injection shows early and gradual enhancement of the nodule containing non-enhanced areas inside the tissue (arrow)
Fig. 14
Fig. 14
Synovial sarcoma of the prostate in a 26-year-old man, with a serum prostate-specific antigen level of 1.14 ng/mL. a, b T1-and T2-weighted imaging show a heterogeneous signal mass compressing the prostatic urethra and the left lobe of the prostate, with an incomplete, low T2 signal intensity pseudocapsule (arrowheads on b) and irregular areas of hemorrhagic and necrotic changes (☆). c DWI at a b-value of 1200 s/mm2 shows a high signal intensity of the solid area and low signal intensity of the cystic area of the mass (☆). d Coronal fat-suppressed T2WI shows the mass compressing the prostatic urethra and the left lobe of the prostate (arrowheads), compressing and invading the right seminal vesicle (arrow). e DCE imaging shows heterogeneous enhancement of the lobulated mass invading seminal vesicles (white arrow). Note the residual tissue of the left seminal vesicle (black arrow)
Fig. 15
Fig. 15
Malignant solitary fibrous tumor originating from the prostatic urethra in a 62-year-old male with a slightly elevated serum PSA level (4.770 ng/mL) and a Foley catheter to relieve urinary retention (white arrow). a T2WI shows a heterogeneously hyperintense nodule (1.8 cm in size) with an obscured hypointense capsule (arrowhead) behind and adjacent to the prostatic urethra in the prostate. b, c DWI at a b-value of 1400 s/mm2 and ADC maps show that the nodule exhibits mildly and inhomogeneously restricted diffusion. d DCE imaging shows continuously mild and heterogeneous enhancement of the nodule. e, f Coronal fat-suppressed T2WI and DWI at a b-value of 1400 s/mm2 show the nodule protruding into the bladder (black arrow)
Fig. 16
Fig. 16
Secondary diffuse large B cell lymphoma involving the prostate in a 66-year-old male with a normal serum prostate-specific antigen level (0.795 ng/mL) and tear-like pain in the lower abdomen for 1 month. a, b T2WI shows a homogeneously isointense mass in the prostate with extraprostatic extension and invasion of the seminal vesicles. c, d DWI at a b-value of 1400 s/mm2 and ADC maps show that the mass exhibits observably restricted diffusion. e DCE imaging shows moderate enhancement of the mass. f DWI at a b-value of 800 s/mm2 shows slightly enlarged pelvic lymph nodes
Fig. 17
Fig. 17
Prostatic cystadenoma in a 36-year-old man. a, b Axial T2- and coronal fat-suppressed T2WI show a multilocular cystic mass with inhomogeneously high signal intensity from the left lobe of prostate, compressing the tissue of the prostate and rectum (arrowheads on a). c Axial T1WI shows inhomogeneous hyperintensity of the cysts suggesting hemorrhage or proteinaceous fluid

References

    1. Gupta RT, Spilseth B, Froemming AT. How and why a generation of radiologists must be trained to accurately interpret prostate mpMRI. Abdom Radiol (NY) 2016;41:803–804. doi: 10.1007/s00261-016-0745-4. - DOI - PubMed
    1. Oberlin DT, Casalino DD, Miller FH, Meeks JJ. Dramatic increase in the utilization of multiparametric magnetic resonance imaging for detection and management of prostate cancer. Abdom Radiol (NY) 2017;42:1255–1258. doi: 10.1007/s00261-016-0975-5. - DOI - PubMed
    1. Turkbey B, Rosenkrantz AB, Haider MA, et al. Prostate Imaging Reporting and Data System Version 2.1: 2019 Update of Prostate Imaging Reporting and Data System Version 2. Eur Urol. 2019;76:340–351. doi: 10.1016/j.eururo.2019.02.033. - DOI - PubMed
    1. Woo S, Suh CH, Kim SY, Cho JY, Kim SH. Diagnostic performance of prostate imaging reporting and data system version 2 for detection of prostate cancer: a systematic review and diagnostic meta-analysis. Eur Urol. 2017;72:177–188. doi: 10.1016/j.eururo.2017.01.042. - DOI - PubMed
    1. Chu LC, Ross HM, Lotan TL, Macura KJ. Prostatic stromal neoplasms: differential diagnosis of cystic and solid prostatic and periprostatic masses. AJR Am J Roentgenol. 2013;200:W571–W580. doi: 10.2214/AJR.12.9741. - DOI - PubMed