

Long-lived macrophage reprogramming drives spike protein-mediated inflammasome activation in COVID-19
- PMID: 34133077
- PMCID: PMC8350892
- DOI: 10.15252/emmm.202114150
Long-lived macrophage reprogramming drives spike protein-mediated inflammasome activation in COVID-19
Abstract
Innate immunity triggers responsible for viral control or hyperinflammation in COVID-19 are largely unknown. Here we show that the SARS-CoV-2 spike protein (S-protein) primes inflammasome formation and release of mature interleukin-1β (IL-1β) in macrophages derived from COVID-19 patients but not in macrophages from healthy SARS-CoV-2 naïve individuals. Furthermore, longitudinal analyses reveal robust S-protein-driven inflammasome activation in macrophages isolated from convalescent COVID-19 patients, which correlates with distinct epigenetic and gene expression signatures suggesting innate immune memory after recovery from COVID-19. Importantly, we show that S-protein-driven IL-1β secretion from patient-derived macrophages requires non-specific monocyte pre-activation in vivo to trigger NLRP3-inflammasome signaling. Our findings reveal that SARS-CoV-2 infection causes profound and long-lived reprogramming of macrophages resulting in augmented immunogenicity of the SARS-CoV-2 S-protein, a major vaccine antigen and potent driver of adaptive and innate immune signaling.
Keywords: NLRP3; SARS-CoV-2; inflammasome; innate immunity; macrophage.
© 2021 The Authors. Published under the terms of the CC BY 4.0 license.
Conflict of interest statement
The authors declare that they have no conflict of interest.
Figures

SDS–PAGE of the recombinant SARS‐CoV‐2 spike protein (S‐protein).
SARS‐CoV‐2 spike binding assay of IgGs isolated from COVID‐19 patients (n = 3; red circles) or SARS‐CoV‐2 naïve individuals (SC‐naïve) (n = 2; blue circles).
Experimental scheme: After PBMCs isolation, CD14+ cells were enriched by positive selection. Subsequently, 5 × 10⁴ CD14+ cells/well were seeded and incubated in the presence of M‐CSF for 5 days. Differentiated macrophages were stimulated with/without recombinant SARS‐CoV‐2 spike protein or lipopolysaccharide (LPS) for 4 h. To activate IL‐1β secretion nigericin or ATP was added for 2 h. Finally, IL‐1β secretion was quantified by ELISA.
Quantification of IL‐1β concentration (pg/ml) in the supernatant of primary macrophage cultures from COVID‐19 patients (n = 44; red bars) or SC‐naïve individuals (n = 24; blue bars) stimulated with LPS or S‐protein (0.1 µg/ml). To activate IL‐1β secretion, nigericin was added for 2 h.
TNF‐α (pg/ml) secreted from macrophages derived from SC‐naïve and COVID‐19 patients as described above. Cells were stimulated with LPS (SC‐naïve/COVID‐19 n = 4), LPS with nigericin (SC‐naïve n = 4; COVID‐19 n = 6), S‐protein (SC‐naïve n = 5; COVID‐19 n = 4), S‐protein with nigericin (SC‐naïve n = 3; COVID‐19 n = 4) or left unstimulated (SC‐naïve n = 3; COVID‐19 n = 4). Significances shown in the figure are always in comparison with the unstimulated control.

IL‐1β (pg/ml) secreted from macrophages derived from SC‐naïve (n = 6, blue) and COVID‐19 patients (n = 9, red), which were stimulated with 10 µg/ml S‐Protein and Nigericin. Student’s t‐test with Welsh corrections was used to calculate statistical differences as indicated.
Quantification of IL‐1β concentration (pg/ml) in the supernatants of primary macrophage cultures from COVID‐19 patients (n = 8; red bars) or healthy individuals (n = 4; blue bars) stimulated with nigericin (2 h, 5 µM) without any other prior stimulation.
Primary macrophages from COVID‐19 patients (red bars) were stimulated with (n = 11) or without S‐protein (0.1 µg/ml) (n = 18) or LPS (5 µg/ml) (n = 18) for 4 h. Subsequently, ATP (5 mM; 2 h) was used as signal 2 to induce IL‐1β secretion. As control macrophages of healthy individuals were used (n = 6; blue bars). For statistical analysis, two‐way ANOVA with Tukey post hoc test was used.
Chemical inhibition of IL‐1β (pg/ml) incubating macrophages from COVID‐19 patients (red) for 2 h with DMSO (n = 44), MMC950 (n = 31), or VX‐765 (n = 8), followed by 4 h incubation with LPS and additional 2 h with nigericin. For statistical analysis, one‐way ANOVA with Tukey post hoc test was used.
Results of three independent Western blot analyses (Healthy n = 3; COVID‐19 n = 3) as described in Fig 2C. Graph shows relative NLRP3 expression correlated to the β‐actin control. ImageJ Software was used to quantify protein band density.
Quantification of total IL‐1β concentration (pg/ml) from cell lysates derived from healthy individuals (blue; n = 3) and COVID‐19 patients (red; n = 8) using ELISA. Macrophages were stimulated with LPS (5 µg/ml) or S‐protein (0.1 µg/ml) or left unstimulated (control). For statistical analysis, two‐way ANOVA with Tukey post hoc test was used.
Quantification of the relative expression of pro‐IL‐1β compared to β‐actin in macrophages of SC‐naïve (blue; n = 3) and COVID‐19 patients (red; n = 3) by western blot. Macrophages were stimulated with LPS (5 µg/ml) or S‐protein (0.1 µg/ml) or left unstimulated (control).
Detection of NEK7 in total cell lysates from healthy/SC‐naïve (upper panel) and COVID‐19 (lower panel) macrophages. Macrophages were stimulated with LPS or S‐protein (4 h) followed by 2 h of nigericin treatment. Control cells were left unstimulated and β‐actin was used as loading control. Representative example of three individual experiments.
Quantification of the relative expression of NEK7 compared to β‐actin in macrophages of SC‐naïve (blue; n = 3) and COVID‐19 patients (red; n = 3) by Western blot.
Percentage of dead differentiated macrophages (% dead cells) from COVID‐19 patients (n = 6, red) determined with cytometry via 7‐AAD staining. Cells were stimulated with LPS or S‐protein for 4 h and consequently for 2 h with nigericin. One‐way ANOVA statistical text to calculate significances as indicated.
IL‐1β (pg/ml) secreted from COVID‐19 patient‐derived (n = 8; red bars) and SARS‐CoV‐2 naive (n = 5; blue bars) macrophages which were stimulated with full‐length S‐protein or S2‐domain (all 0.1 µg/ml). Nigericin was used in both cases as signal 2. For statistical analysis, two‐way ANOVA with Tukey post hoc test was used.
Primary macrophages from COVID‐19 patients (n = 8; red bars) or healthy individuals (n = 5; blue bars) were stimulated with ORF8 (0.1 µg/ml) for 4 h. Subsequently, nigericin (5 µM; 2 h) was used to induce IL‐1β secretion.

Chemical inhibition of IL‐1β (pg/ml) secretion after pre‐incubation of macrophages from COVID‐19 patients (red) for 2 h with DMSO (n = 21), MMC950 (n = 21), or VX‐765 (n = 8), followed by 4 h incubation with S‐protein and additional 2 h with nigericin. For statistical analysis, one‐way ANOVA with Tukey post hoc test was used.
Western blot analysis of total cell lysates of macrophages from a SARS‐CoV‐2 naïve individual (SC‐naïve) (top) and COVID‐19‐infected individual (bottom). Macrophages were stimulated with LPS or S‐protein (4 h) followed by 2 h of nigericin treatment. Control cells were left unstimulated. Antibodies against NLRP3 (110 kDa) and β‐actin (loading control) were used for detection. Representative example of three individual experiments.
Representative confocal microscope pictures of macrophages from SC‐naïve (top) and COVID‐19 patients (bottom). Nuclei are stained with DAPI (blue) and ASC speck are labeled by immunofluorescence staining (green). Macrophages were stimulated with LPS (left) and S‐Protein (right) for 4 h followed by stimulation with nigericin in both cases. Pictures were taken with a 60× objective using the same microscope settings.
Quantification of ASC speck from SC‐naïve (n = 3, blue) and COVID‐19 patients (n = 8, red) derived macrophages. Percentage of ASC specks was calculated per DAPI stained nuclei. For statistical analysis, two‐way ANOVA with Tukey post hoc test was used.
IL‐1β gene expression of macrophages from COVID‐19 patients (n = 5; red bars) or SC‐naïve individuals (n = 3 (S‐protein) n = 4 (control); blue bars) stimulated with/without S‐Protein were determined by qRT–PCR. Data are normalized to β‐actin. Statistical significance was analyzed using the Kolmogorov–Smirnov test.
Western blot analysis of total cell lysates of macrophages from SARS‐CoV‐2 naïve individuals (SC‐naïve) (top) and COVID‐19‐infected individuals (bottom). Macrophages were stimulated with LPS or S‐protein (1 h). Control cells were left unstimulated. Antibodies against pro‐IL‐1β (31 kDa) and β‐actin (loading control) were used for detection. Representative example of three experiments performed with individual patients and SARS‐CoV‐2 naïve controls.
Western blot analysis comparing macrophage precipitated supernatants from a SC‐naïve (top) and a COVID‐19‐positive patient (bottom). Macrophages were treated with DMSO or MCC950 (2 h) and further stimulated with LPS or S‐protein (4 h) followed by 2 h of nigericin treatment. Antibodies binding cleaved IL‐1β (17 kDa) were used for detection. Representative example of three individual experiments.
Western blot analysis of total cell lysates of macrophages from a SARS‐CoV‐2 naïve individuals (SC‐naïve) (top) and COVID‐19‐infected individual (bottom). Macrophages were stimulated with LPS or S‐protein (4 h) followed by 2 h of nigericin treatment. Control cells were left unstimulated. Antibodies targeting cleaved GSDMD (110 kDa) and β‐actin (loading control) were used for detection. Representative example of three individual experiments.
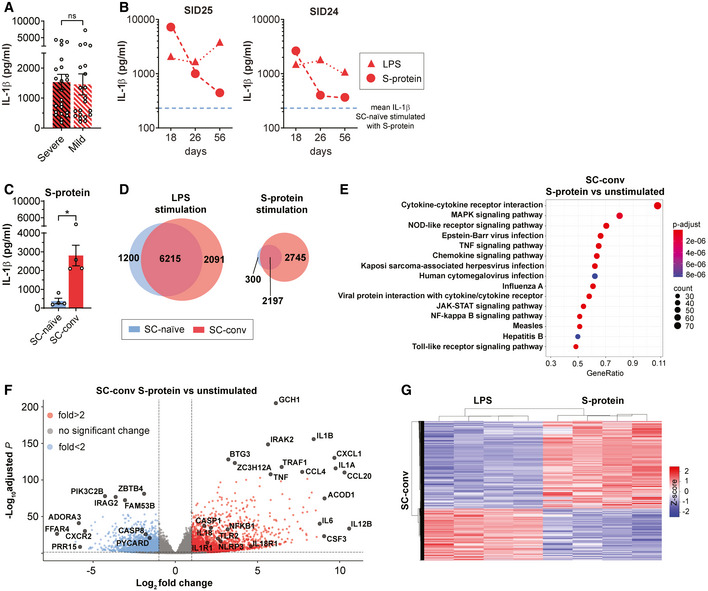
Subgroup analysis of IL‐1β secretion of macrophages after stimulation with S‐protein and nigericin from COVID‐19 patients with severe (red/black; n = 23) or mild (white/red; n = 21) disease. Student’s t‐test with Welsh corrections was used to calculate statistical differences. Graph shows mean ± SEM.
CD14+ cells of two convalescent individuals were isolated sequentially at d18, d26, and d56 after confirmation of SARS CoV2 infection by PCR. Following M‐CSF differentiation, macrophages were stimulated with LPS (red triangle) or S‐Protein (red circles) and IL‐1β concentration (pg/ml) was quantified upon incubation with nigericin. Blue dashed line indicates mean IL‐1β level of SC‐naïve individuals stimulated with S‐protein and nigericin.
Quantification of IL‐1β concentration (pg/ml) in the supernatant of primary macrophage cultures from convalescent COVID‐19 patients (SC‐conv) (n = 4; red bars) or SARS‐CoV‐2 naïve individuals (SC‐naïve) (n = 4; blue bars) stimulated with S‐protein (1 µg/ml) and nigericin. Students t‐test with Welsh corrections was used to calculate statistical differences as indicated. Graph shows mean ± SEM. *P < 0.05.
Venn diagram showing number of differentially expressed genes (DEGs) in healthy/naïve (SC‐naïve; blue) and convalescent COVID‐19 patient‐derived macrophages (SC‐conv; red) upon stimulation with LPS (left) or S‐Protein (right). Circle sizes of the Venn diagram correspond to the number of genes.
KEGG‐gene enrichment analysis, based on RNA‐Seq data, showing activated signaling pathways in S‐protein stimulated macrophages compared to unstimulated in convalescent COVID‐19 patient‐derived macrophages (SC‐conv). Padj values are indicated (color code), and size of the circles represents number of DEGs (count). P‐values are calculated using Wald test and P‐adjusted values using the FDR/Benjamini–Hochberg approach.
Volcano plot showing DEGs in S‐protein stimulated macrophages from convalescent COVID‐19 patients (SC‐conv) compared to unstimulated cells. Negative log10 adjusted P‐values are plotted against the log2‐fold change. Select genes are labeled. P‐values are calculated using Wald test and P‐adjusted values using the FDR/Benjamini–Hochberg approach.
Heat map indicating DEG patterns comparing LPS or S‐protein stimulation of SC‐conv macrophages. Z‐score is indicated in a color score.

Principal component analysis (PCA) of macrophage RNA‐Seq data indicating clustering of healthy (SC‐naïve; blue) versus COVID‐19 (SC‐conv; red) groups when stimulated with S‐protein, LPS, or without stimulation.
Heat map indicating differential gene expression patterns comparing SC‐conv macrophages stimulated with S‐protein or left unstimulated. Z‐score is indicated in a color score.
Gene‐concept network based on RNA‐Seq data, showing upregulated signaling pathways in S‐protein stimulated macrophages compared to unstimulated macrophages in COVID‐19 patient‐derived macrophages (SC‐conv).

Mean fluorescence intensity (MFI) comparing surface TLR2 expression on healthy/naïve (SC‐naïve; blue; n = 7) and COVID‐19 patient (SC‐conv; red; n = 10) derived macrophages. Students t‐test with Welsh corrections was used to calculate statistical differences as indicated.
IL‐1β concentration (pg/ml) in supernatants of COVID‐19 patient‐derived macrophages pre‐treated with DMSO (n = 44), KINK‐1 (n = 11), and MMG‐11 (n = 18) and subsequent stimulation with S‐protein and nigericin. For statistical analysis, one‐way ANOVA was used.
IL‐1β concentration (pg/ml) in supernatants of COVID‐19 patient‐derived macrophages pre‐treated with DMSO (n = 44), KINK‐1 (n = 11), and MMG‐11 (n = 19) and subsequent stimulation with LPS and nigericin. For statistical analysis, one‐way ANOVA was used.
IL‐1β concentration (pg/ml) in supernatants from macrophages of SC naïve (blue; n = 7) and COVID‐19 patients (red; n = 11). Macrophages were pre‐treated with DMSO (SC‐naïve n = 7; COVID‐19 n = 11), KINK‐1 (SC‐naïve n = 6; COVID‐19 n = 7), and MMG‐11 (SC‐naïve n = 4; COVID‐19 n = 4) for 2 h and then stimulated with zymosan (4 h) and nigericin (2 h) as indicated. For statistical analysis, two‐way ANOVA with Tukey post hoc test was used.
IL‐1β concentration (pg/ml) in supernatants from COVID‐19 patients which were stimulated for 2 h with a blocking anti‐TLR2 monoclonal antibody in different concentrations as indicated. Subsequently, macrophages were stimulated with LPS (1 ng/ml: n = 6; 10 and 100 ng/ml: n = 7) and S‐Protein (1 ng/ml: n = 12; 10 and 100 ng/ml: n = 13) for 4 h and both groups for 2 h with nigericin. For statistical analysis, one‐way ANOVA was used.
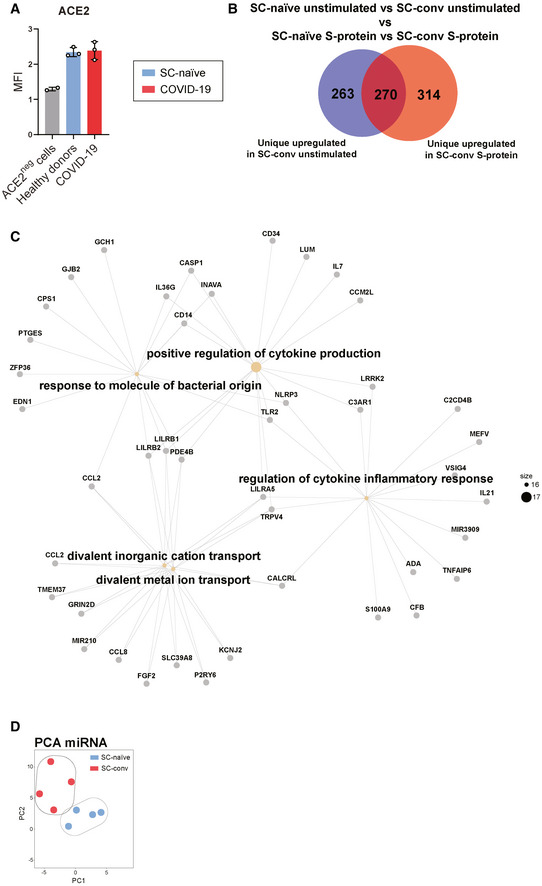
Mean fluorescence intensity (MFI) of ACE2 expression on macrophages from healthy donors (blue; n = 3), COVID‐19 (red; n = 3) detected by flow cytometry and compared to ACE2‐negative cell line (n = 2).
Venn diagram showing numbers of uniquely expressed genes in SC‐conv macrophages stimulated with S‐protein (red) compared to unstimulated macrophages (blue), deducted from DEGs found in SC‐naïve macrophages stimulated with S‐protein or left unstimulated. Size of the Venn diagram corresponded to the number of genes.
Gene‐concept network analysis, showing upregulated pathways in SC‐conv versus SC‐naïve macrophages stimulated with S‐protein.
Principal component analysis (PCA) from miRNA data indicating clustering from healthy (SC‐naïve; blue) versus COVID‐19 (SC‐conv; red) macrophages without any stimulation. Each dot represents one individual (n = 4 for both experimental groups).
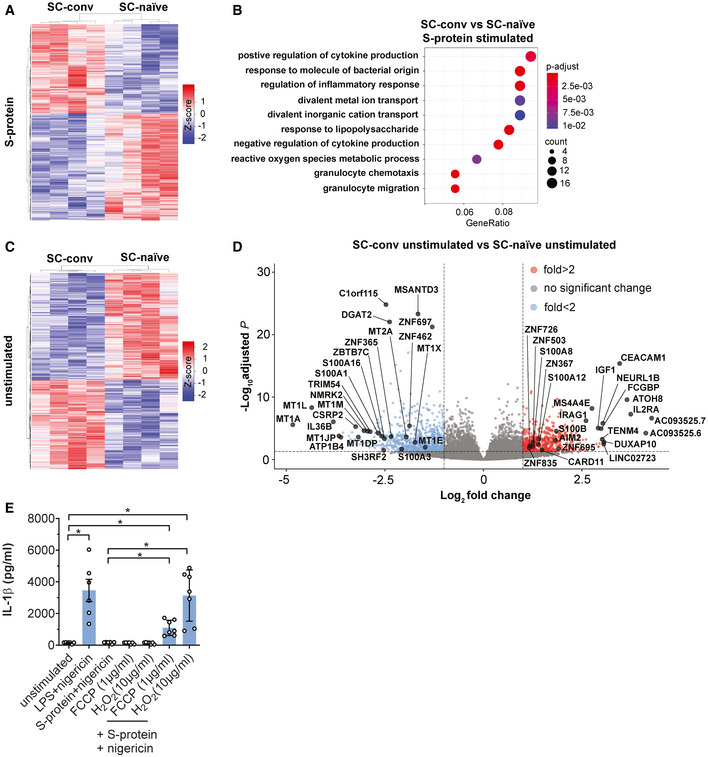
Heat map indicating DEG patterns comparing SC‐conv and SC‐naïve macrophages stimulated with the S‐protein. Z‐score is indicated in a color score.
BP enrichment analysis, based on RNA‐Seq data, showing activated signaling pathways upon S‐protein stimulation in SC‐conv macrophages compared to SC‐naïve macrophages. Padj values are indicated (color code) and circle size corresponds to the number of DEGs contributing to the pathways (count).
Heat map indicating DEG patterns comparing SC‐conv and SC‐naïve macrophages without any stimulation. Z‐score is indicated in a color score.
Volcano plot showing DEGs in unstimulated COVID‐19 patient‐derived macrophages (SC‐conv) compared to macrophages from SARS‐CoV‐2 naïve individuals (SC‐naïve). Negative log10 Padj values are plotted against the log2‐fold change. Selected genes of interest are labeled.
IL‐1β concentration (pg/ml) in supernatants of SC‐naïve individuals (n = 7) which were pre‐treated for 24 h with FCCP (1 µg/ml) and H2O2 (10 µg/ml). Macrophages were then incubated with LPS or S‐Protein (4 h) and nigericin (2 h) as indicated in the figure. Control cells were left unstimulated or stimulated with LPS or S‐protein without pre‐treatment with FCSP or H2O2 (n = 6). For statistical analysis, Brown–Forsythe and Welsh ANOVA test was used.

Volcano plot showing differentially expressed miRNAs from unstimulated COVID‐19 patient‐derived macrophages (SC‐conv) compared to those from naïve individuals (SC‐naïve). Negative log10 adjusted P‐values are plotted against the log2‐fold change. Genes of interest are indicated. For miRNA analyses, data with a Padj value of smaller 0.05 and log2‐fold change of ≤ −0.85 (blue) and ≥ 0.85 (red) were included.
Average profile plot showing distribution of histone modifications identified in CUT&RUN experiments displayed as normalized read counts per million around known transcription start site (TSS) of known genes. Color code for H3K4me3 (SARS‐CoV‐2 naïve/green; COVID‐19/red) and for H3K27ac (SARS‐CoV‐2 naïve/yellow; COVID‐19/purple).
GO biological process analysis performed on differentially enriched loci of H3K27ac peaks (enhancer) showing associated pathways from SC‐conv monocytes compared to SC‐naïve monocytes.
KEGG enrichment analysis performed on differentially enriched loci of H3K27ac peaks (enhancer) showing involved pathways from SC‐conv monocytes compared to SC‐naïve monocytes. Adjusted P‐values are indicated (color code) and size of the circles corresponds to the number of detected genes associated with each pathway (count).
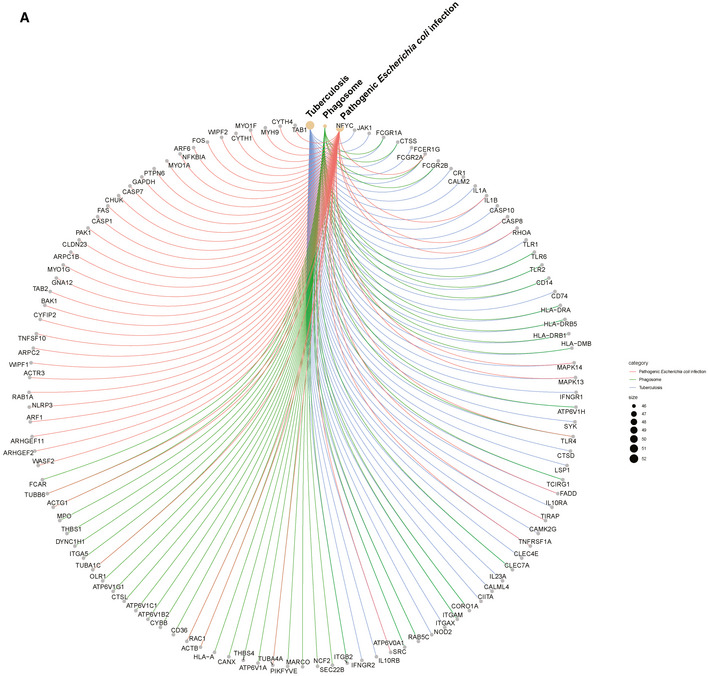
CNET plot (derived from analysis shown in D) illustrating genes involved in tuberculosis and phagosome KEGG pathways.
Representative gene loci (TLR2 (top) and S100A7A/8/9/12 (bottom) H3K27ac peaks) comparing SC‐naïve (blue) and SC‐conv (red) monocytes. Red peaks reach higher values than blue peaks (representative examples of four samples for each condition).
Quantification of IL‐1β concentrations (pg/ml) in the supernatant of primary macrophage cultures from patients with active/untreated tuberculosis (n = 6; red/black bars) or healthy/SARS‐CoV‐2 naïve individuals (n = 3; blue bars) or the same patients after 6 months of anti‐tuberculous treatment; n = 6; white/red bars) stimulated with LPS or S‐protein (0.1 µg/ml) for 4 h and subsequent incubation with nigericin for 2 h. For statistical analysis, two‐way ANOVA with Tukey post hoc test was used.


References
-
- Arts RJW, Moorlag SJCFM, Novakovic B, Li Y, Wang S‐Y, Oosting M, Kumar V, Xavier RJ, Wijmenga C, Joosten LAB et al (2018) BCG vaccination protects against experimental viral infection in humans through the induction of cytokines associated with trained immunity. Cell Host Microbe 23: 89–100.e5 - PubMed
-
- Broz P, Dixit VM (2016) Inflammasomes: mechanism of assembly, regulation and signalling. Nat Rev Immunol 16: 407–420 - PubMed
Publication types
MeSH terms
Substances
Grants and funding
LinkOut - more resources
Full Text Sources
Other Literature Sources
Medical
Molecular Biology Databases
Miscellaneous
