. 2021 Jun 16;17(6):e1009115.
doi: 10.1371/journal.pcbi.1009115. eCollection 2021 Jun.

A computational grid-to-place-cell transformation model indicates a synaptic driver of place cell impairment in early-stage Alzheimer's Disease

Affiliations

A computational grid-to-place-cell transformation model indicates a synaptic driver of place cell impairment in early-stage Alzheimer's Disease

Natalie Ness et al. PLoS Comput Biol. .

Abstract

Alzheimer's Disease (AD) is characterized by progressive neurodegeneration and cognitive impairment. Synaptic dysfunction is an established early symptom, which correlates strongly with cognitive decline, and is hypothesised to mediate the diverse neuronal network abnormalities observed in AD. However, how synaptic dysfunction contributes to network pathology and cognitive impairment in AD remains elusive. Here, we present a grid-cell-to-place-cell transformation model of long-term CA1 place cell dynamics to interrogate the effect of synaptic loss on network function and environmental representation. Synapse loss modelled after experimental observations in the APP/PS1 mouse model was found to induce firing rate alterations and place cell abnormalities that have previously been observed in AD mouse models, including enlarged place fields and lower across-session stability of place fields. Our results support the hypothesis that synaptic dysfunction underlies cognitive deficits, and demonstrate how impaired environmental representation may arise in the early stages of AD. We further propose that dysfunction of excitatory and inhibitory inputs to CA1 pyramidal cells may cause distinct impairments in place cell function, namely reduced stability and place map resolution.


Conflict of interest statement

The authors have declared that no competing interests exist.

Figures

Fig 1
Fig 1. Simulation with long-term stability of place fields without novel place field formation.
(A) Place field maps of cells with significant place fields on day 5, for days 5 to 40, indexed according to centroid position along the track on day 5. (B) Proportion of active cells and place cells over 365 days. Simulations were carried out with Hebbian learning. The results of a single run of the simulation of model 1 are shown.
Fig 2
Fig 2. Stable place cell density and properties in the scaled model.
(A) Schematic of new CA1 connectivity in model 3. (B) Proportion of total and new place cells over 365 days. (C) Probability of recurrence for active cells and place cells across sessions 5 to 35 days apart. Error bars in (B) and (C) show standard deviation across two runs of the simulation. (D) Representative probability density function of place field width. Inset: Mean place field width over 365 days, excluding widths > 50 cm. Error bars show pooled standard error of the mean across all place fields in 2 runs of the simulation. Simulations were carried out with BCM learning.
Fig 3
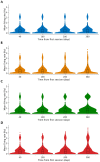
Fig 3. Each model exhibits characteristic changes in firing rate.
Swarm plots showing mean firing rates of CA1 pyramidal cells from day 40 to day 360 in the wildtype (A), the grid-to-pyramidal-cell synapse loss model (B), the interneuron-to-pyramidal-cell synapse loss model (C) and the double synapse loss model (D). Boxplots show median and interquartile range. The results of a single run of each simulation are shown. Histograms of the same data are shown in S2 Fig.
Fig 4
Fig 4. Place cell proportion and place map stability decreased as excitatory synapses were lost.
(A) Proportion of place cells over 365 days in the grid-to-pyramidal-cell (GC-PC) synapse loss and wildtype (WT) model. Error bars show standard deviation across two runs of the simulation. (B) Mean synaptic weight over 365 days. Error bars show pooled standard error of all synaptic weights over two runs of the simulation. Inset: Range of weights in the GC-PC loss model (orange) and the wildtype (blue). (C-E) Probability of recurrence for place cells and active cells across sessions 20 to 60 days apart from day 20 (C), day 200 (D) and day 300 (E). Error bars show standard deviation across two runs of the simulation.
Fig 5
Fig 5. Place cell proportion and mean place field width increased over time when inhibitory synapses were lost.
(A) Proportion of place cells over 365 days in the interneuron-to-pyramidal cell (IN-PC) synapse loss and wildtype (WT) model. (B) Mean place field width over 365 days, excluding widths > 50 cm. The means of 2 runs of the simulation are shown in (A) and (B), Error bars show pooled standard error of the mean. Representative probability density functions of place field widths on day 20 (C) and 360 (D).
Fig 6
Fig 6. The proportion of highly active cells increases and firing rates are less stable in the synapse loss model.
Sankey diagrams showing the proportion of cells classified by mean firing rate and flow between categories across sessions 20 days apart for the wildtype (A) and the synapse loss model (B) starting on day 260. Cells were classified as silent (mean firing rate = 0 Hz; top node in dark blue), rarely active (0 − 0.5 Hz; second node from the top in light blue), intermediately active (0.5 − 2 Hz; second node from the bottom in light pink) and highly active (> 2 Hz; bottom node in red). The height of each node represents the proportion of cells with the given activity level out of all cells on the day specified above the nodes. The height of the links between nodes represents the proportion of cells that were part of the original node on the specified day and were part of the connected node 20 days later. For example, the top left dark blue link represents the proportion of cells that were silent on day 260 and day 280. Links are shaded in the same colour as the node they originate from.
Fig 7
Fig 7. Place cell properties diverge from the wildtype in the double synapse loss model.
(A) Proportion of total (dark lines) and new (pale lines) place cells over 365 days in the double synapse loss and wildtype (WT) model. Error bars show standard deviation across two runs of the simulation. (B) Representative probability density function of place field widths on day 360. Inset: Mean field width over 365 days, excluding widths > 50 cm. Error bars show pooled standard error of all place fields across two runs of the simulation. (C-E) Probability of recurrence for active cells and place cells across sessions 20 to 60 days apart from day 20 (C), day 200 (D) and day 300 (E). Error bars show standard deviation across two runs of the simulation.

Similar articles

Cited by

References

    1. Erkkinen MG, Kim MO, Geschwind MD. Clinical neurology and epidemiology of the major neurodegenerative diseases. Cold Spring Harbor Perspectives in Biology. 2018. doi: 10.1101/cshperspect.a033118 - DOI - PMC - PubMed
    1. Prvulovic D, Van De Ven V, Sack AT, Maurer K, Linden DEJ. Functional activation imaging in aging and dementia. Psychiatry Research—Neuroimaging. 2005. doi: 10.1016/j.pscychresns.2005.06.006 - DOI - PubMed
    1. Mrdjen D, Fox EJ, Bukhari SA, Montine KS, Bendall SC, Montine TJ. The basis of cellular and regional vulnerability in Alzheimer’s disease. Acta Neuropathologica. 2019. doi: 10.1007/s00401-019-02054-4 - DOI - PMC - PubMed
    1. Chabrier MA, Cheng D, Castello NA, Green KN, LaFerla FM. Synergistic effects of amyloid-beta and wild-type human tau on dendritic spine loss in a floxed double transgenic model of Alzheimer’s disease. Neurobiology of Disease. 2014;64:107–117. 10.1016/j.nbd.2014.01.007 - DOI - PMC - PubMed
    1. Chen MK, Mecca AP, Naganawa M, Finnema SJ, Toyonaga T, Lin SF, et al.. Assessing Synaptic Density in Alzheimer Disease with Synaptic Vesicle Glycoprotein 2A Positron Emission Tomographic Imaging. JAMA Neurology. 2018. doi: 10.1001/jamaneurol.2018.1836 - DOI - PMC - PubMed

Publication types

MeSH terms

LinkOut - more resources