

Comparison of HBV RNA and Hepatitis B Core Related Antigen With Conventional HBV Markers Among Untreated Adults With Chronic Hepatitis B in North America
- PMID: 34133774
- PMCID: PMC8895675
- DOI: 10.1002/hep.32018
Comparison of HBV RNA and Hepatitis B Core Related Antigen With Conventional HBV Markers Among Untreated Adults With Chronic Hepatitis B in North America
Abstract
Background and aims: The clinical utility of two biomarkers, hepatitis B virus (HBV) RNA and hepatitis B core-related antigen (HBcrAg), as compared to conventional markers of HBV replication and disease activity, is unclear.
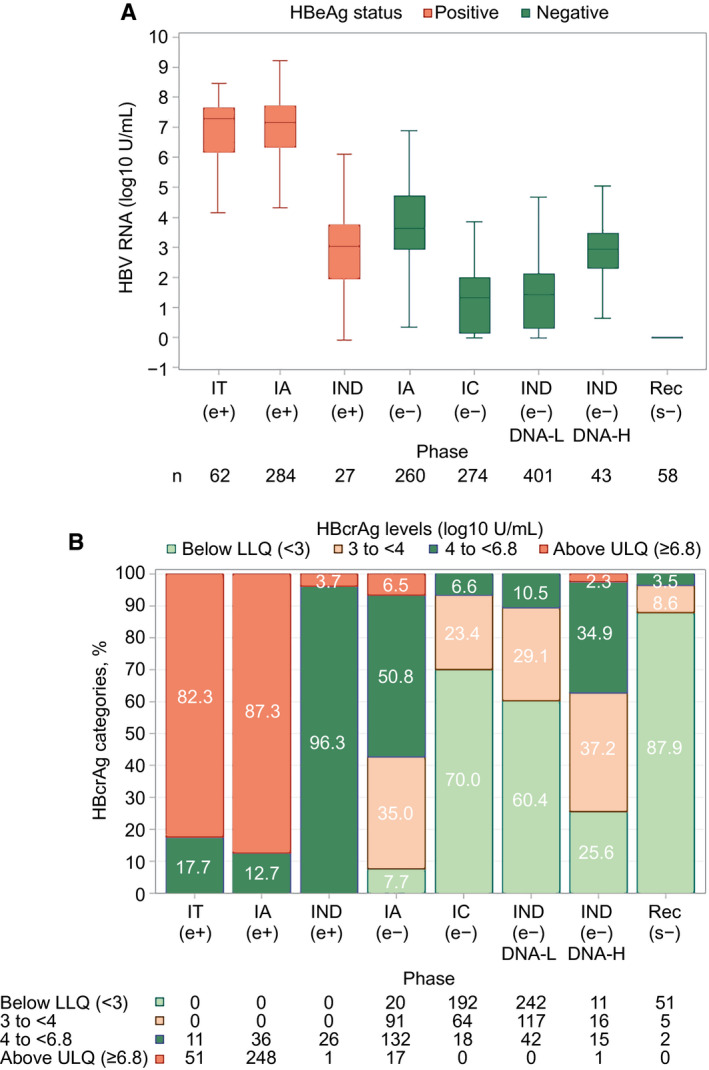
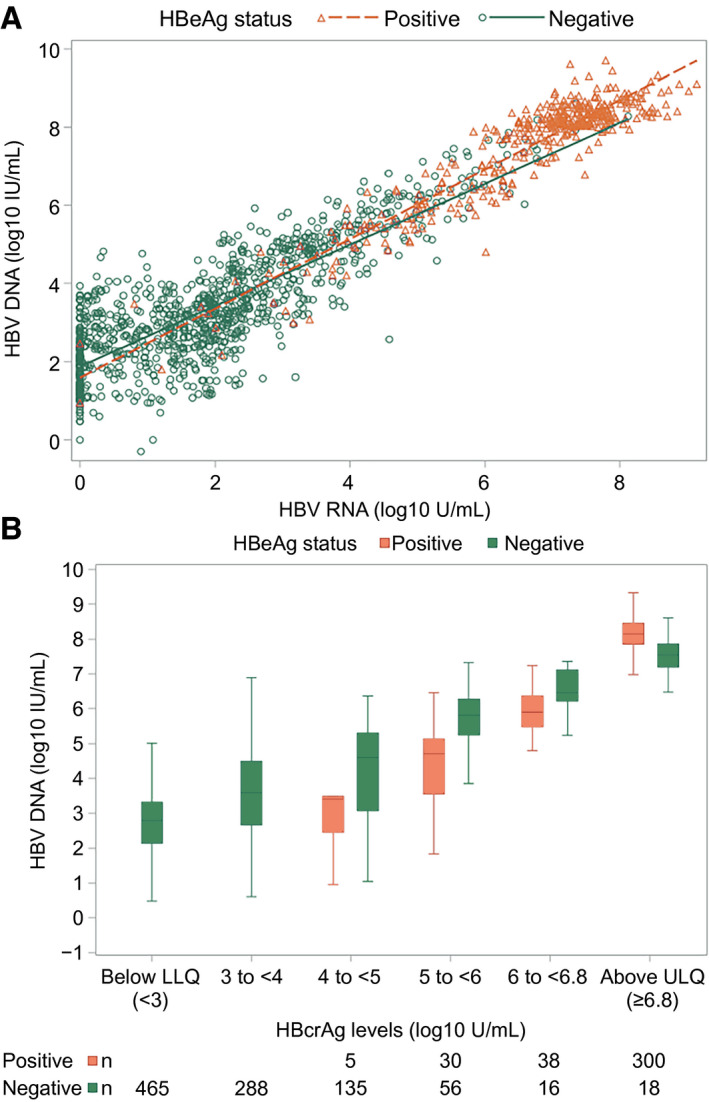
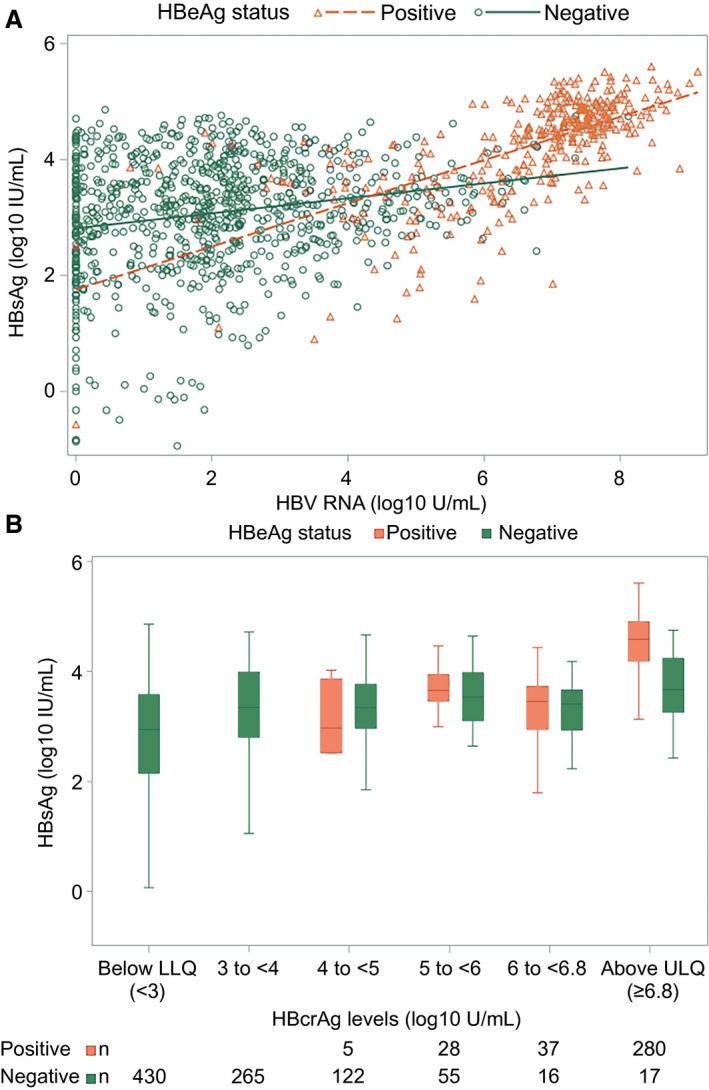
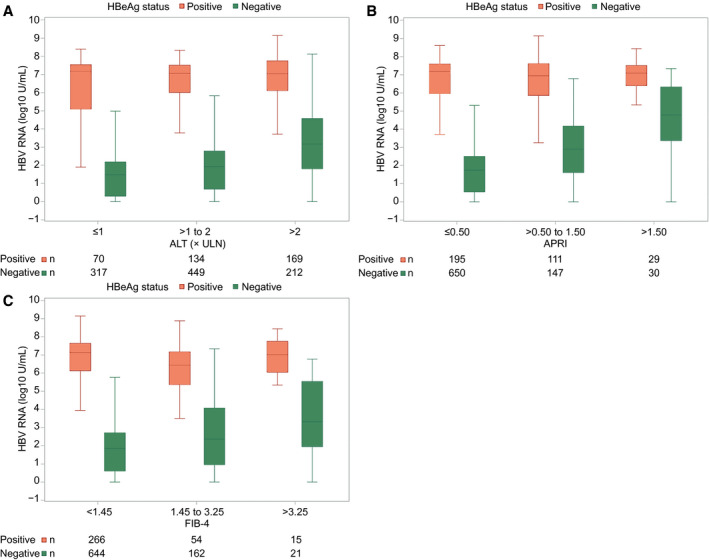
Approach and results: Untreated participants in the North American Hepatitis B Research Network Adult Cohort Study were categorized by chronic hepatitis B (CHB) phases based on HBsAg and HBeAg status and HBV DNA and alanine aminotransferase (ALT) levels. HBV RNA and HBcrAg were measured (Abbott HBV pgRNA Research Assay and Fujirebio Lumipulse Immunoassay, respectively), and cross-sectional associations with conventional CHB markers were tested. Among 1,409 participants across all CHB phases, median HBV DNA was 3.8 log10 IU/mL and ALT was 34 U/L. HBV RNA was quantifiable in 99% of HBeAg+ and 58% of HBeAg- participants; HBcrAg was quantifiable in 20% of HBeAg+ (above linear range in the other 80%) and 51% of HBeAg- participants. Both markers differed across CHB phases (P < 0.001), with higher levels in the HBeAg+ and HBeAg- immune active phases. HBV RNA and HBcrAg correlated moderately strongly with HBV DNA in both HBeAg+ and HBeAg- phases (HBV RNA: e+ ρ = 0.84; e- ρ = 0.78; HBcrAg: e+ ρ = 0.66; e- ρ = 0.56; P for all, <0.001), but with HBsAg levels among HBeAg+ phases only (HBV RNA: e+ ρ = 0.71; P < 0.001; e- ρ = 0.18; P = 0.56; HBcrAg: e+ ρ = 0.51; P < 0.001; e- ρ = 0.27; P < 0.001). Associations of higher HBV RNA and HBcrAg levels with higher ALT, APRI, and Fibrosis-4 levels were consistent in HBeAg- , but not HBeAg+ , phases.
Conclusions: Despite clear relationships between HBV RNA and HBcrAg levels and CHB phases, these markers have limited additional value in differentiating CHB phases because of their strong association with HBV DNA and, to a lesser extent, with clinical disease indicators.
© 2021 The Authors. Hepatology published by Wiley Periodicals LLC on behalf of American Association for the Study of Liver Diseases. This article has been contributed to by US Government employees and their work is in the public domain in the USA.
Figures
Comment in
-
Letter to the editor: New kid in the playground: HBcrAg and risk of HCC.Hepatology. 2022 Mar;75(3):760-761. doi: 10.1002/hep.32250. Epub 2022 Jan 9. Hepatology. 2022. PMID: 34800036 No abstract available.
-
Reply.Hepatology. 2022 Mar;75(3):761-763. doi: 10.1002/hep.32251. Epub 2021 Dec 21. Hepatology. 2022. PMID: 34800047 No abstract available.
-
Reply.Hepatology. 2022 Mar;75(3):764-765. doi: 10.1002/hep.32253. Epub 2021 Dec 18. Hepatology. 2022. PMID: 34800052 No abstract available.
References
-
- Wong DH, Seto WK, Cheung KS, Chong CK, Huang FY, Fung J, et al. Hepatitis B virus core‐related antigen as a surrogate marker for covalently closed circular DNA. Liver Int 2017;37:995‐1001. - PubMed
Publication types
MeSH terms
Substances
Grants and funding
- UL1 TR001111/TR/NCATS NIH HHS/United States
- U54 RR019192/RR/NCRR NIH HHS/United States
- U01 DK082923/DK/NIDDK NIH HHS/United States
- UL1 TR000058/TR/NCATS NIH HHS/United States
- M01 RR000400/RR/NCRR NIH HHS/United States
- U01 DK082867/DK/NIDDK NIH HHS/United States
- U01 DK082874/DK/NIDDK NIH HHS/United States
- UL1 RR024986/RR/NCRR NIH HHS/United States
- U01 DK082919/DK/NIDDK NIH HHS/United States
- U01 DK082927/DK/NIDDK NIH HHS/United States
- U01 DK082872/DK/NIDDK NIH HHS/United States
- U01 DK082943/DK/NIDDK NIH HHS/United States
- K24 AA022523/AA/NIAAA NIH HHS/United States
- P30 DK050306/DK/NIDDK NIH HHS/United States
- M01 RR000040/RR/NCRR NIH HHS/United States
- U01 DK082871/DK/NIDDK NIH HHS/United States
- U01 DK082944/DK/NIDDK NIH HHS/United States
- U01 DK082864/DK/NIDDK NIH HHS/United States
- U01 DK082843/DK/NIDDK NIH HHS/United States
- U01 DK082863/DK/NIDDK NIH HHS/United States
- UL1 TR000004/TR/NCATS NIH HHS/United States
- U01 DK082866/DK/NIDDK NIH HHS/United States
