. 2021 Jun 15;35(11):109239.
doi: 10.1016/j.celrep.2021.109239.

Head-mounted microendoscopic calcium imaging in dorsal premotor cortex of behaving rhesus macaque

Affiliations

Head-mounted microendoscopic calcium imaging in dorsal premotor cortex of behaving rhesus macaque

Anil Bollimunta et al. Cell Rep. .

Abstract

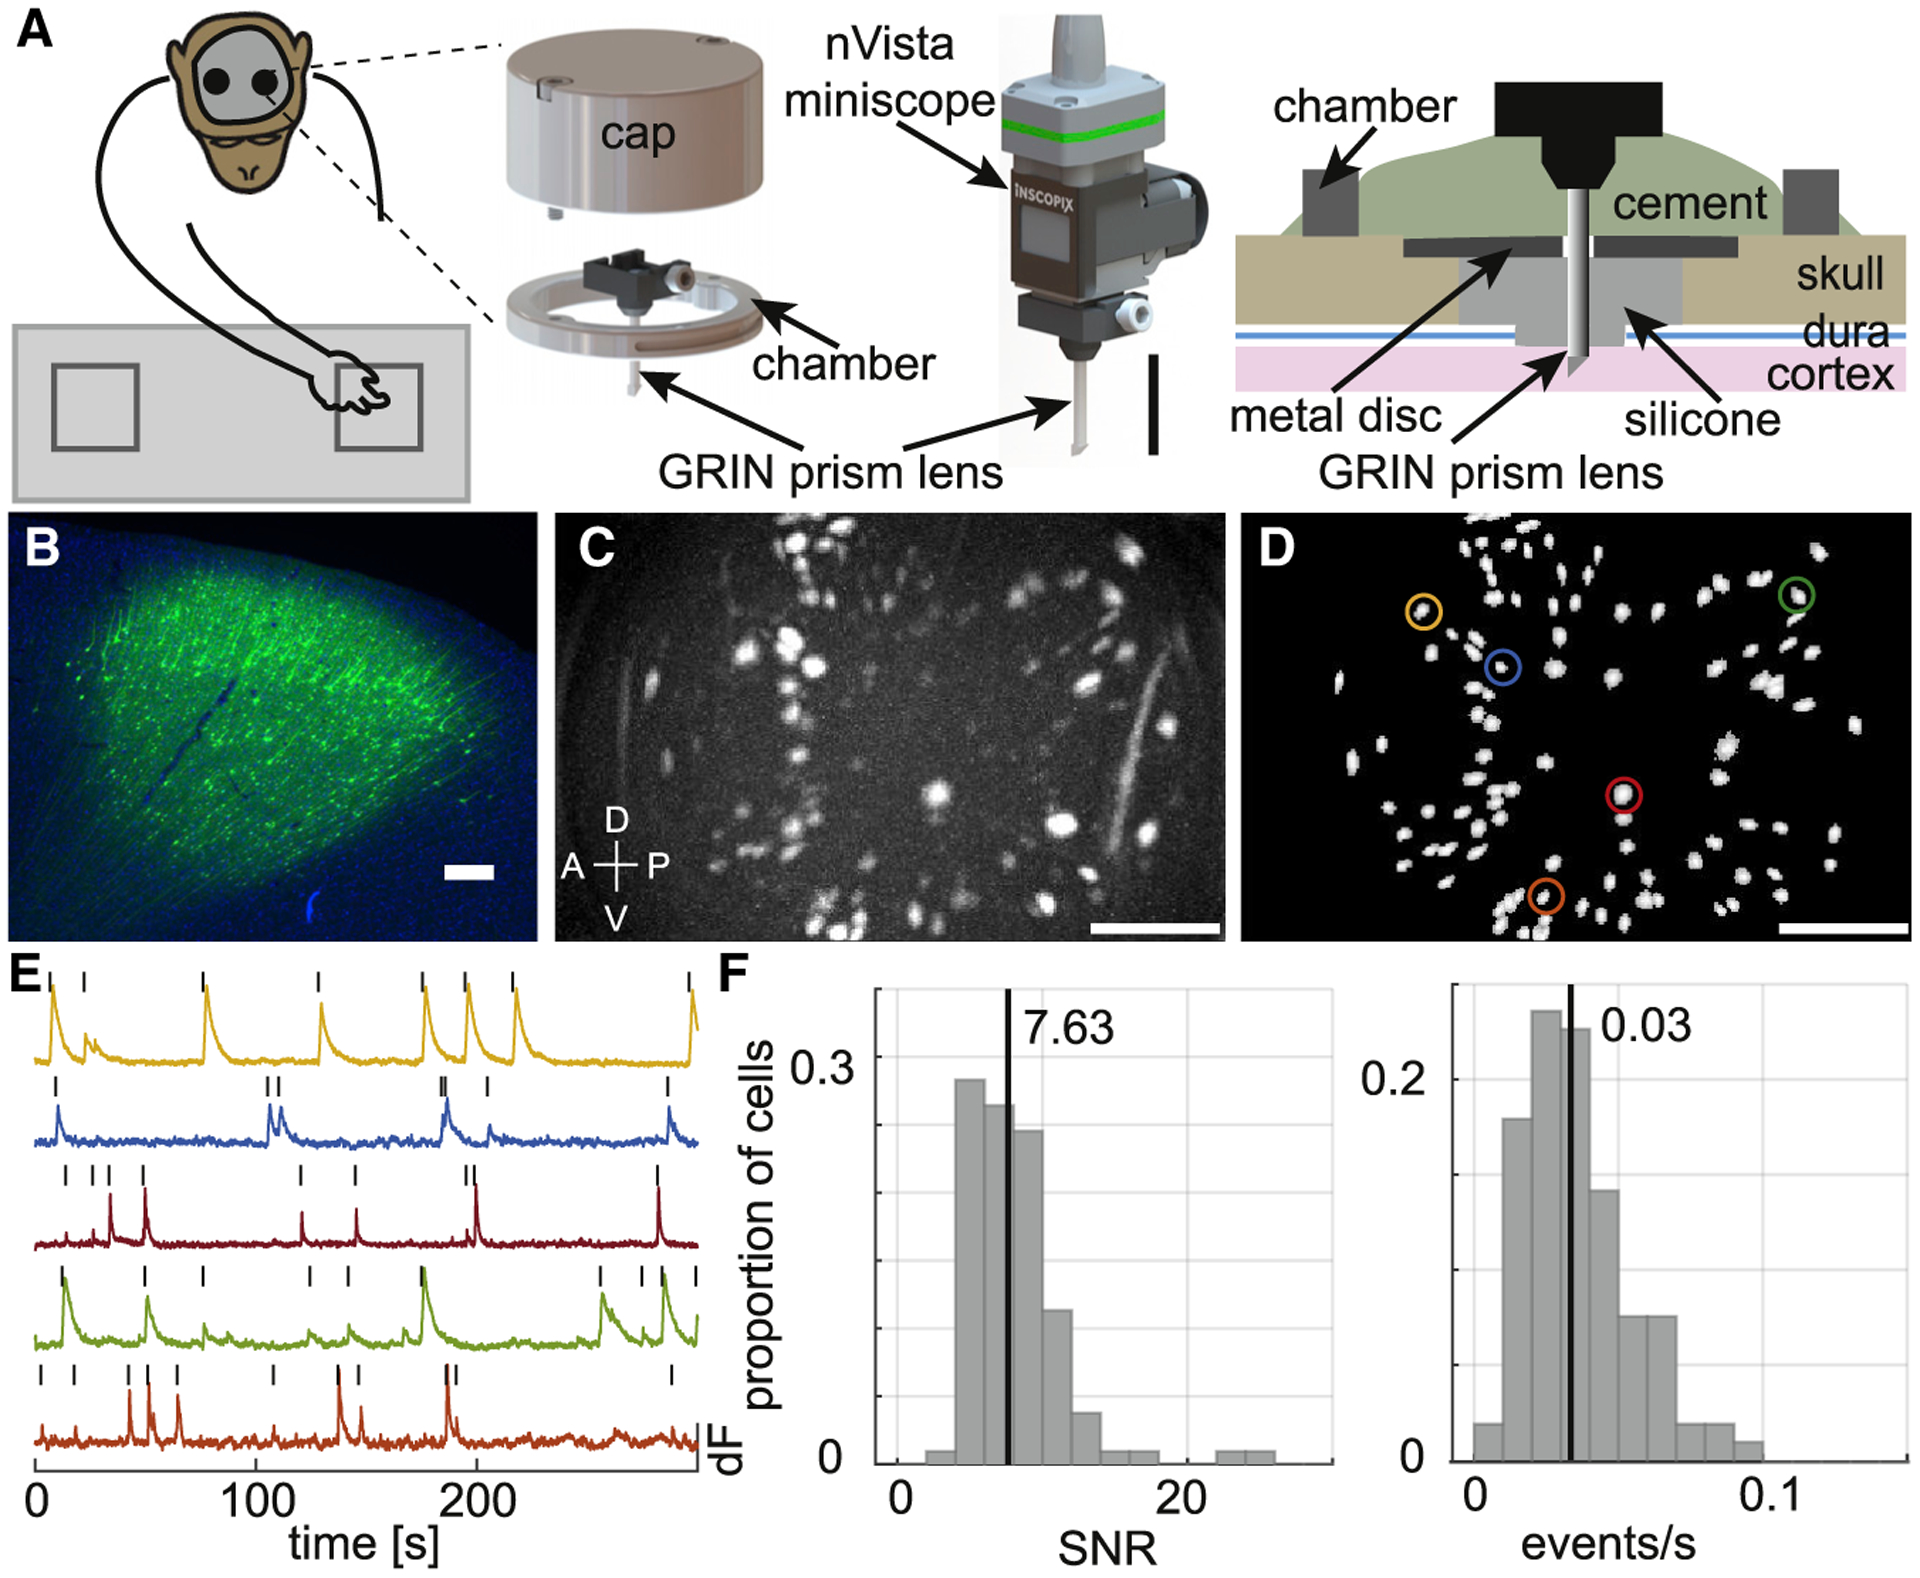
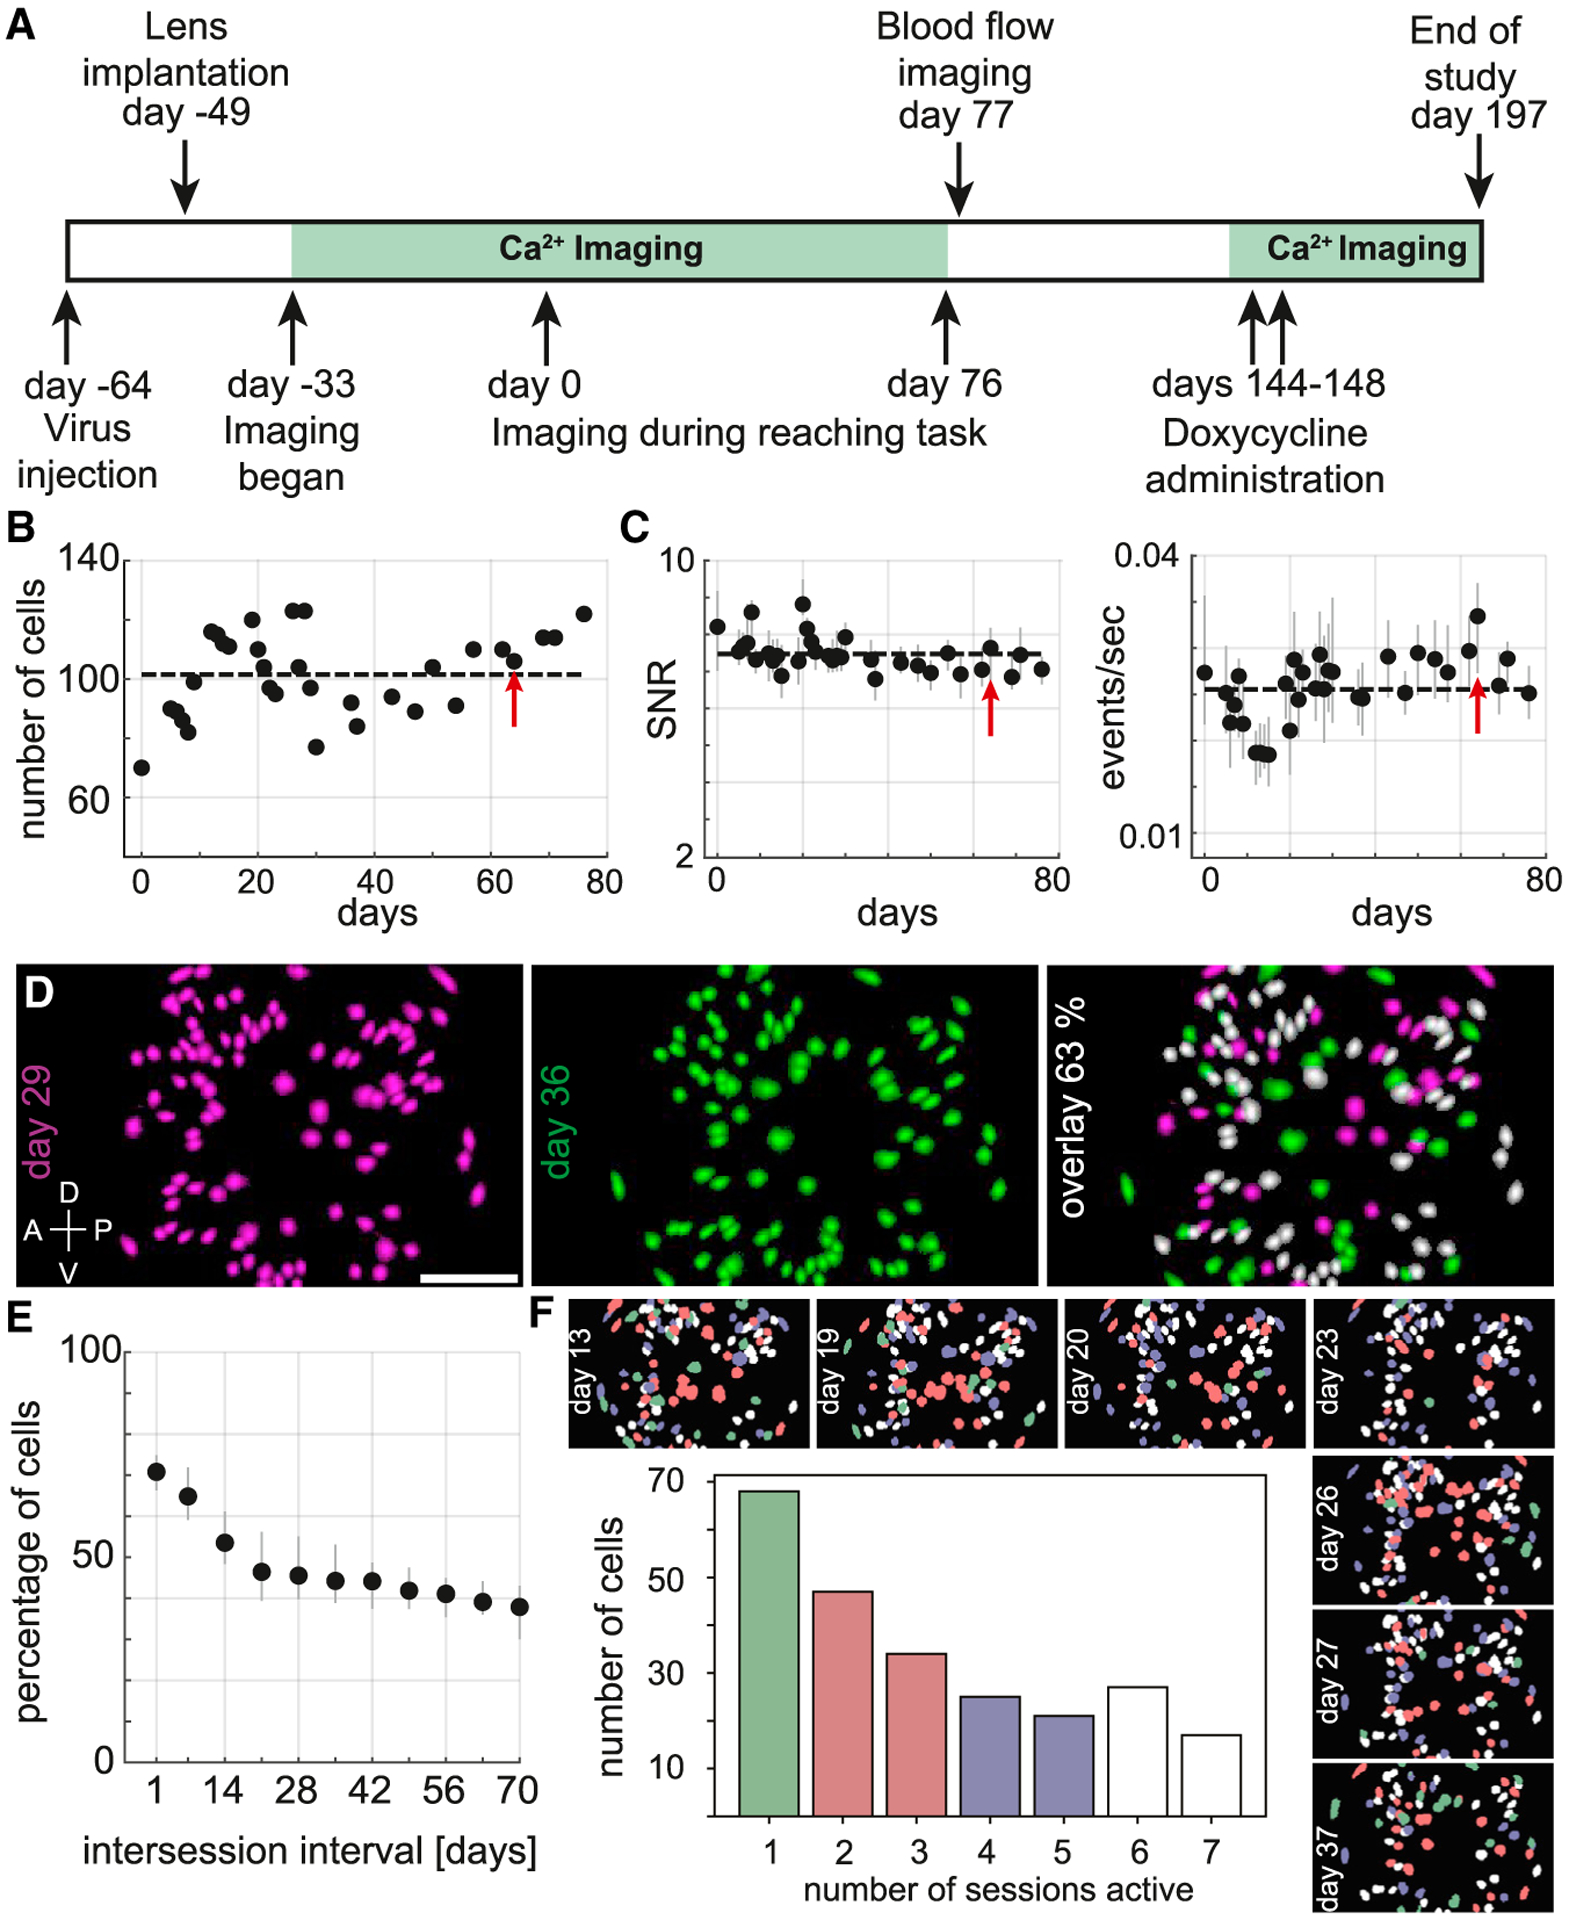
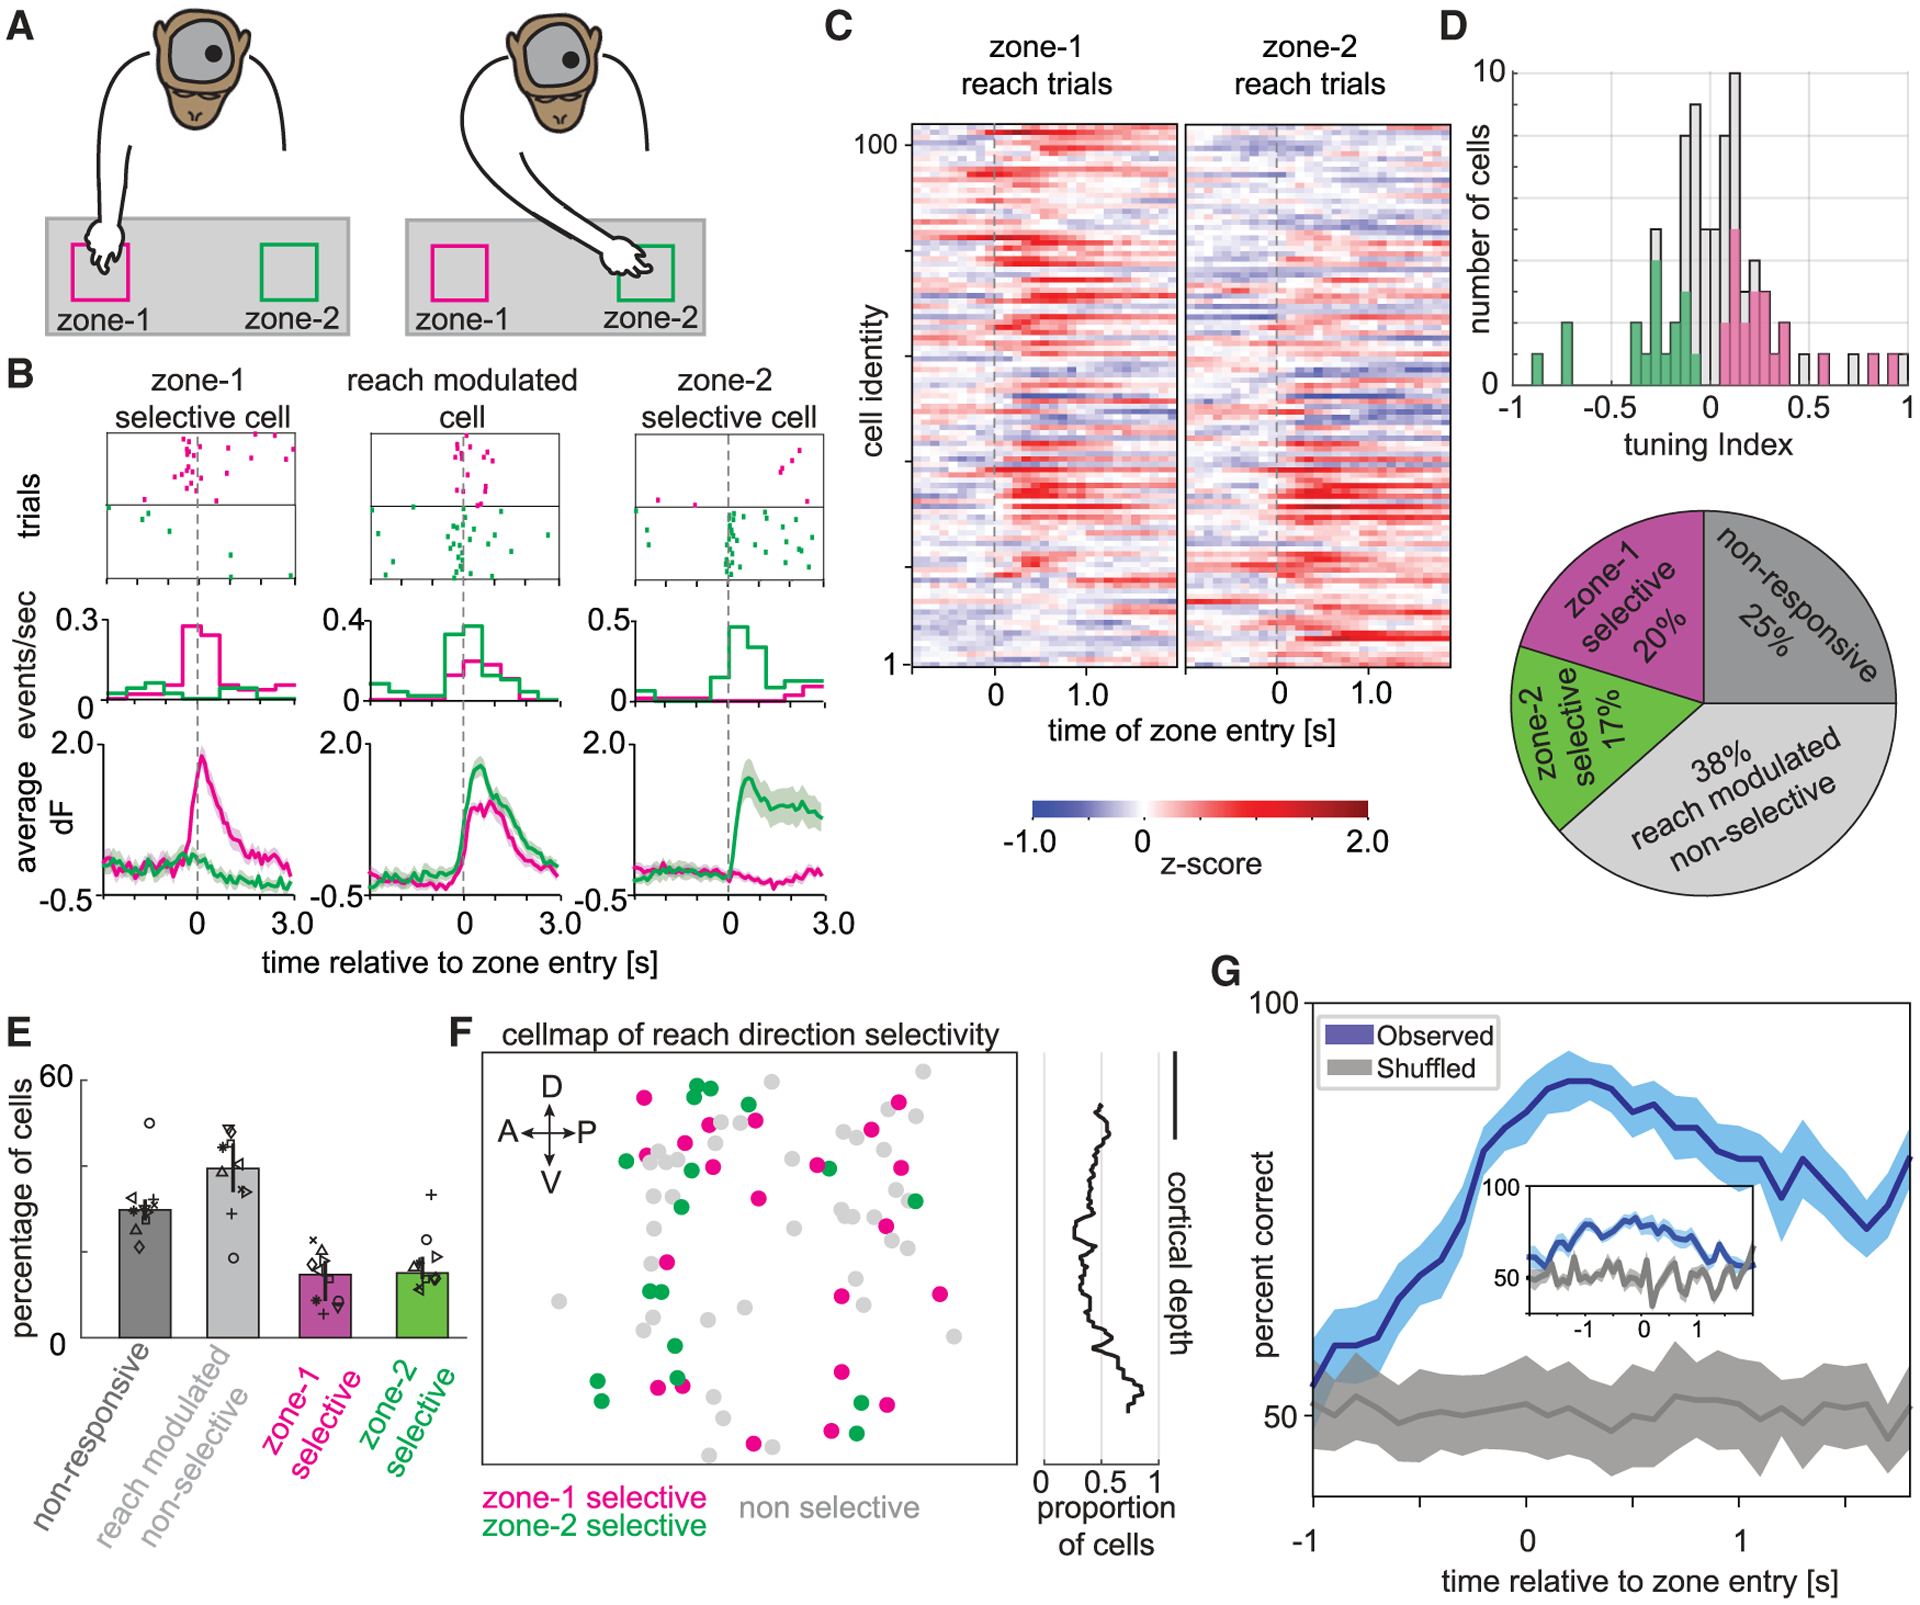
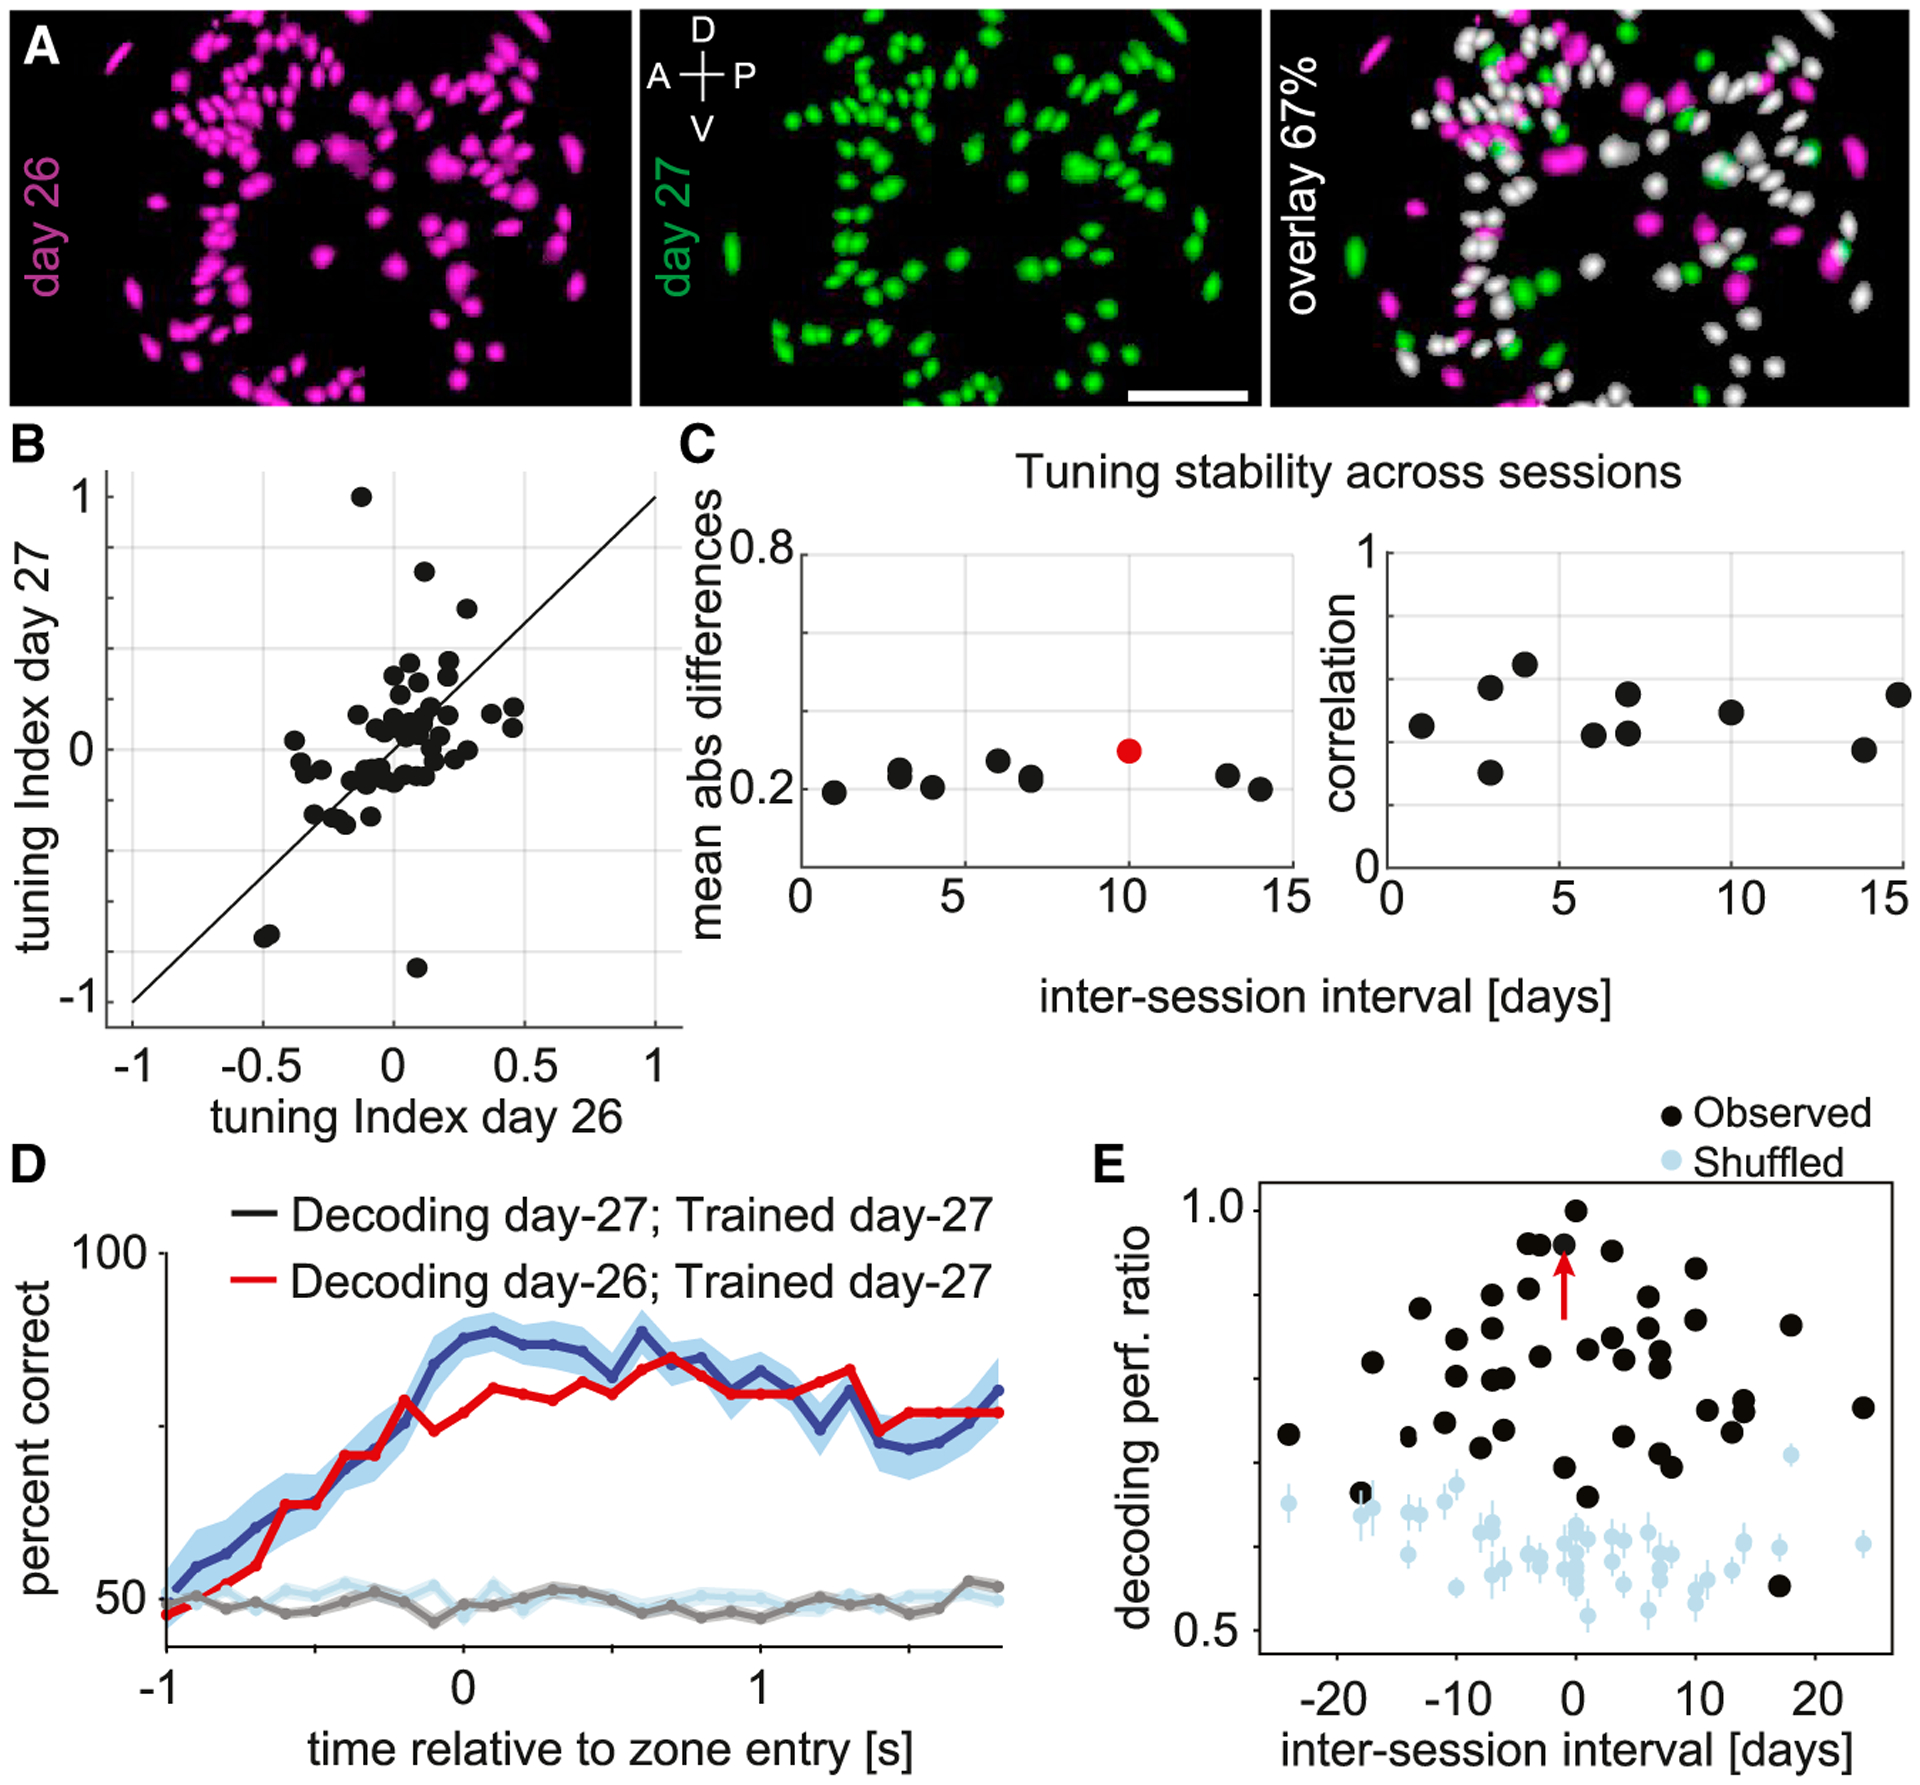
Microendoscopic calcium imaging with one-photon miniature microscopes enables unprecedented readout of neural circuit dynamics during active behavior in rodents. In this study, we describe successful application of this technology in the rhesus macaque, demonstrating plug-and-play, head-mounted recordings of cellular-resolution calcium dynamics from large populations of neurons simultaneously in bilateral dorsal premotor cortices during performance of a naturalistic motor reach task. Imaging is stable over several months, allowing us to longitudinally track individual neurons and monitor their relationship to motor behavior over time. We observe neuronal calcium dynamics selective for reach direction, which we could use to decode the animal's trial-by-trial motor behavior. This work establishes head-mounted microendoscopic calcium imaging in macaques as a powerful approach for studying the neural circuit mechanisms underlying complex and clinically relevant behaviors, and it promises to greatly advance our understanding of human brain function, as well as its dysfunction in neurological disease.

Keywords: GCaMP; GRIN lens; arm reach; calcium imaging; decoding behavior; longitudinal tracking; macaque; microendoscopy; miniscope; premotor cortex.


Conflict of interest statement

Declaration of interests A.B., P.S.X., and J.J.N. are paid employees of Inscopix, Inc. The remaining authors declare no competing interests.

Figures

Figure 1.
Figure 1.. Cellular resolution imaging in macaque dorsal premotor cortex (PMd)
(A) Left: Schematic of the macaque performing the reach to reward task with two nVista miniscopes mounted on the head to image from the bilateral PMd. Middle: Zoomed-in schematic of the implant hardware, including the GRIN prism lens integrated with the miniscope baseplate and the cranial chamber and cap, and the nVista miniscope docked on the baseplate for imaging. Scale bar, 10 mm. Right: Schematic depicting how the chamber and lens probe were positioned and secured with respect to the cortex and skull. (B) Post-mortem native GCaMP expression (green) and DAPI-stained cell nuclei (blue) in the cortex 8 weeks following injections of the AAV Tet-Off virus system in a separate animal (animal 1). Scale bar, 250 μm. (C) Maximum projection image of in vivo GCaMP fluorescence over the course of a single example session. The bright-colored regions in the image indicate cells that exhibited active calcium dynamics during the recording. Scale bar, 250 μm. Dorsal (D), ventral (V), anterior (A), and posterior (P) denote orientation in the premotor cortex. (D) Map of cells extracted using CNMFe from the same example session. Colored circles indicate example cell calcium activity traces in (E). Scale bar, 250 μm. (E) Calcium activity (dF, peak normalized) traces of example cells highlighted in (D). The black tick marks above the traces indicate detected calcium events. (F) Distribution of median calcium event SNR (left) and median calcium event rate (right) for the entire population of cells recorded in the example session. The vertical lines indicate the median SNR (7.63) and event rate (0.03) values. See also Figures S1–S3 and Videos S1, S2, S3, and S4.
Figure 2.
Figure 2.. Calcium imaging stability and longitudinal tracking of neurons
(A) Schematic of the experimental timeline. (B) Number of cells that were imaged for each session across approximately 2.5 months (days 0–76 on experimental timeline in A). The dashed line indicates the mean value. The red arrow indicates the example session in Figure 1. (C) Calcium event SNR (left) and rates (right) (median and IQR) for each session across 76 days. The dashed line indicates the mean value. The red arrow indicates the example session. (D) Left: CNMFe-extracted cell map from an imaging session conducted on day 29 (magenta). Middle: Cell map from day 36 (green). Right: Overlay of cell maps from the two sessions spaced 7 days apart. 63% of the cells from day 29, colored in white, were present and active on both days. Dorsal (D), ventral (V), anterior (A), and posterior (P) denote orientation in the premotor cortex. Scale bar, 250 μm. (E) Percentage of cells (median, IQR) in common between two sessions as a function of the inter-session interval (days). (F) Longitudinal tracking of cells through multiple sessions. Top and right side: Cell maps from seven different sessions spanning approximately 3 weeks with individual cells color-coded according to the number of sessions in which they were present and active (colors as indicated in bar plot). Center: Number of cells as a function of the number of sessions (non-consecutive) found to be present and active. See also Figures S3–S5.
Figure 3.
Figure 3.. Direction selective calcium dynamics and decoding of motor reach behavior
(A) Schematic of the macaque performing the reach to reward task with an nVista miniscope mounted on the head to image from the left hemisphere PMd. In these sessions, the macaque reached with the right arm (contralateral to the imaged hemisphere) to one of two zones, either zone 1 (magenta) or zone 2 (green). (B) Three example cells from the left hemisphere PMd exhibiting zone 1 selectivity (left), zone 2 selectivity (right), or nonselective modulation to either reach location (middle) in a single example session. Top: Raster plots of calcium event times across multiple trials aligned to the time of reach entry (dashed vertical line) into zone 1 (magenta) or zone 2 (green). Middle: Peri-stimulus time histogram (PSTH) of calcium events as a function of time relative to reach entry into zone 1 (magenta) or zone 2 (green). Bottom: Calcium trace activity (mean, SEM) as a function of reach entry into zone 1 (magenta) or zone 2 (green). (C) Heatmap depicting Z-scored trial-averaged calcium trace activity for each cell in the population (rows) on either zone 1 (left) or zone 2 (right) reach trials and aligned to the time of zone entry (dashed vertical line). The cells have been sorted based on their selectivity. Tuning index +1 (top) to −1 (bottom). (D) Top: Distribution of reach direction selectivity (tuning index) for the entire population of cells recorded in the example session. Magenta- and green-colored bars indicate cells that had significant (p < 0.05; see STAR Methods) reach direction selectivity to zone 1 (positive tuning indices) or zone 2 (negative tuning indices), respectively. Bottom: Pie chart depicting the percentage of cells in the example session that were classified as zone 1 selective (magenta), zone 2 selective (green), reach-modulated but nonselective (light gray), or nonresponsive (dark gray). (E) Bar plot depicting the median number of cells across sessions that are non-responsive (dark gray), task-modulated but not reach direction selective (light gray), selective to zone 1 (magenta), and selective to zone 2 (green). Error bars are IQR. (F) Left: Cell map depicting the spatial distribution of reach direction selectivity. Cells selective for zone 1 (magenta), zone 2 (green), or reach-modulated but nonselective (light gray) are indicated. Dorsal (D), ventral (V), anterior (A), and posterior (P) orientations in the left hemisphere PMd are indicated with arrows. Right: Proportion of reach-modulated cells that were significantly selective to either reach direction as a function of cortical depth. Scale bar, 200 μm. (G) Observed accuracy of decoding the animal’s reach direction on individual trials (mean, SEM) utilizing a model trained with calcium trace activity in 400-ms time bins (and 100-ms steps) around the time of reach entry into zones 1 and 2 (blue). Chance level decoding accuracy estimated by shuffling the reach direction across trials (gray). Inset: Decoding accuracy utilizing a model trained with calcium events instead of calcium traces. See also Figures S6 and S7 and Video S5.
Figure 4.
Figure 4.. Longitudinally tracking the relationship between neurons and motor reach behavior
(A) Left: CNMFe-extracted cell map from an imaging session conducted on day 26 (magenta). Middle: Cell map from day 27 (green). Right: Overlay of cell maps from the two sessions spaced 1 day apart. 67% of the cells from day 26, shown in white, were present and active on both days. Scale bar, 250 μm. Dorsal (D), ventral (V), anterior (A), and posterior (P) denote orientation in the premotor cortex. (B) Reach direction selectivity (tuning index) on day 26 versus day 27 for cells exhibiting significant (p < 0.05; see STAR Methods) reach direction selectivity to zone 1 (positive tuning indices) or zone 2 (negative tuning indices) and imaged longitudinally across both sessions. (C) Stability of reach direction selectivity across pairs of sessions. Left: Mean absolute differences in tuning index for cells imaged longitudinally across pairs of sessions as a function of the inter-session interval (days). Sessions exhibiting significant differences are indicated (red; Wilcoxon signed-rank test, p < 0.05). Right: Correlation between tuning indices for cells imaged longitudinally across pairs of sessions as a function of the inter-session interval (days). All correlations were found to be significant (p < 0.05). (D) Observed accuracy of decoding the animal’s reach direction on individual trials (mean, SEM) utilizing a model trained and tested on the same session (blue; day 27) or trained and tested on sessions 1 day apart (red; days 26 and 27). Chance level (across session) decoding accuracy estimated by shuffling the reach direction across trials (cyan) or by shuffling cell identity labels (gray). (E) Peak observed (black) and shuffled (cyan) decoding accuracy (mean, SEM) as a function of the inter-session interval (days). All values are expressed as a ratio normalized by the peak observed decoding accuracy for within-session training and testing. The red arrow points to the session pair in (D). See Table S1 for decoding performance values for all session pairs.
Figure 5.
Figure 5.. Multisite calcium imaging in bilateral dorsal premotor cortices with multiple head-mounted miniscopes
(A) Schematic of the macaque performing the reach to reward task with two nVista miniscopes mounted on the head to image bilaterally from left and right hemisphere PMds. In these sessions, the macaque reached with either the right arm to zone 1 (magenta) or the left arm to zone 2 (green). (B) Three example cells each from the left and right hemisphere PMds exhibiting right arm reach selectivity (left), left arm reach selectivity (right), or nonselective modulation to either arm reach (middle) in a single example session. Top: Raster plots of calcium event times across multiple trials aligned to the time of reach entry (dashed vertical line) using right arm into zone 1 (magenta) or left arm into zone 2 (green). Middle: PSTH of calcium events as a function of time relative to reach entry using right arm into zone 1 (magenta) or left arm into zone 2 (green). Bottom: Calcium trace activity (mean, SEM) as a function of reach entry using right arm into zone 1 (magenta) or left arm into zone 2 (green). (C) Heatmap depicting Z-scored trial-averaged calcium trace activity for each cell in the population (rows) on either right arm, zone 1 (left) or left arm, zone 2 (right) reach trials and aligned to the time of zone entry (dashed vertical line). The cells have first been grouped based on the hemisphere in which they reside (right hemisphere toward top [purple margin shading], left hemisphere toward bottom [brown margin shading]) and then within that group they have been sorted top to bottom based on their selectivity (tuning index) to right arm, zone 1 or left arm, zone 2 reaches, respectively. The white arrowheads indicate the cells shown in (B). (D) Observed accuracy of decoding the animal’s reach arm on individual trials (mean, SEM) utilizing a model trained with calcium trace activity from bilateral PMd in 400-ms time bins (and 100-ms steps) around the time of right and left arm reach entry into zones 1 and 2, respectively (blue). Chance level decoding accuracy estimated by shuffling the reach arm across trials (gray). (E) Peak observed (blue) and shuffled (gray) decoding accuracy (mean, SEM) across sessions utilizing a model trained with calcium trace activity from bilateral PMd. See also Video S6.

Comment in

Similar articles

Cited by

References

    1. Arieli A, Grinvald A, and Slovin H (2002). Dural substitute for long-term imaging of cortical activity in behaving monkeys and its clinical implications. J. Neurosci. Methods 114, 119–133. - PubMed
    1. Barretto RPJ, Ko TH, Jung JC, Wang TJ, Capps G, Waters AC, Ziv Y, Attardo A, Recht L, and Schnitzer MJ (2011). Time-lapse imaging of disease progression in deep brain areas using fluorescence microendoscopy. Nat. Med 17, 223–228. - PMC - PubMed
    1. Capitanio JP, and Emborg ME (2008). Contributions of non-human primates to neuroscience research. Lancet 371, 1126–1135. - PubMed
    1. Chen LM, Heider B, Williams GV, Healy FL, Ramsden BM, and Roe AW (2002). A chamber and artificial dura method for long-term optical imaging in the monkey. J. Neurosci. Methods 113, 41–49. - PubMed
    1. Chen JL, Andermann ML, Keck T, Xu N-L, and Ziv Y (2013a). Imaging neuronal populations in behaving rodents: Paradigms for studying neural circuits underlying behavior in the mammalian cortex. J. Neurosci 33, 17631–17640. - PMC - PubMed

Publication types