. 2021 Jun 15;35(11):109242.
doi: 10.1016/j.celrep.2021.109242.

Neuronal figure-ground responses in primate primary auditory cortex

Affiliations

Neuronal figure-ground responses in primate primary auditory cortex

Felix Schneider et al. Cell Rep. .

Abstract

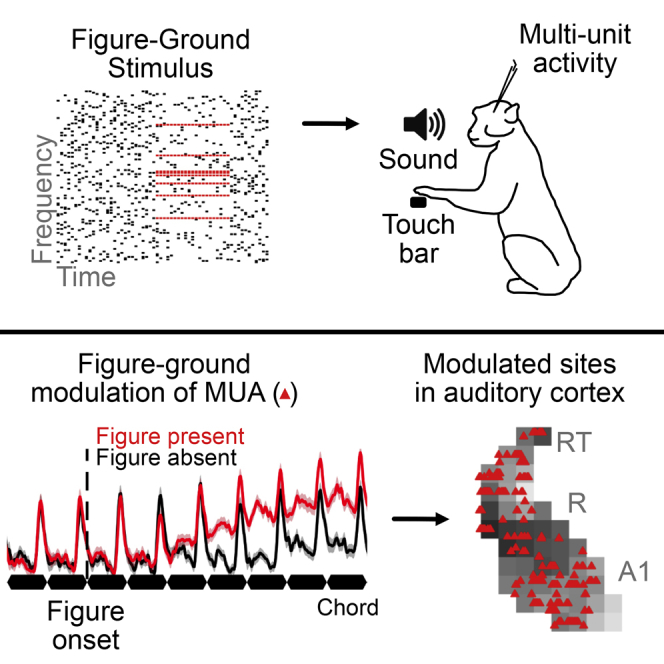
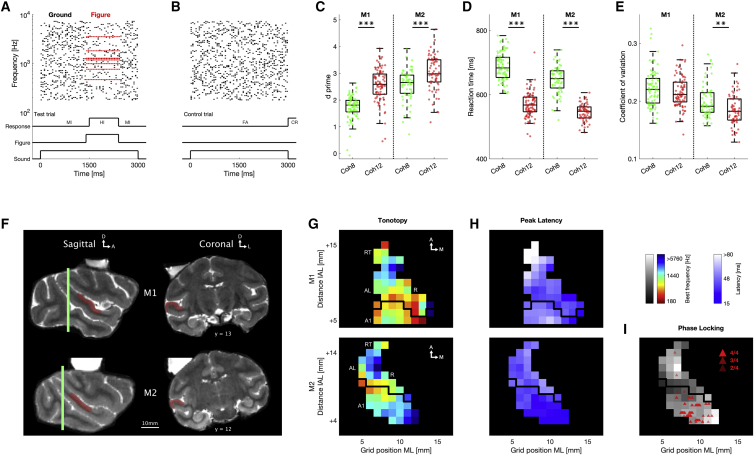
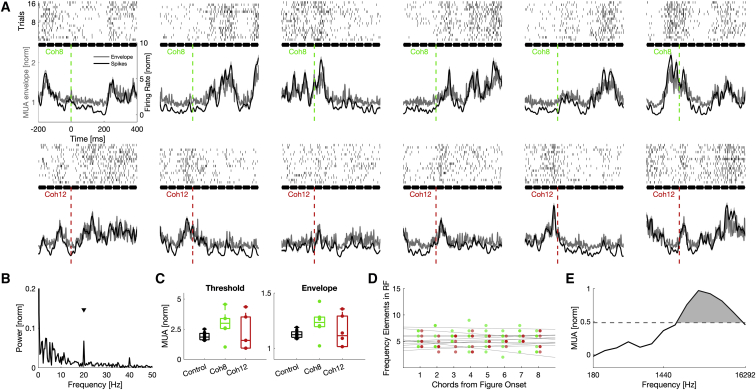
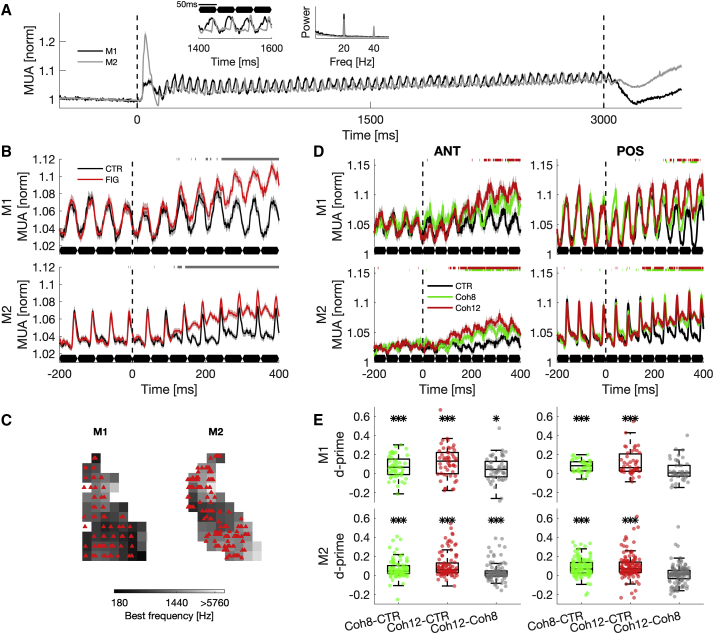
Figure-ground segregation, the brain's ability to group related features into stable perceptual entities, is crucial for auditory perception in noisy environments. The neuronal mechanisms for this process are poorly understood in the auditory system. Here, we report figure-ground modulation of multi-unit activity (MUA) in the primary and non-primary auditory cortex of rhesus macaques. Across both regions, MUA increases upon presentation of auditory figures, which consist of coherent chord sequences. We show increased activity even in the absence of any perceptual decision, suggesting that neural mechanisms for perceptual grouping are, to some extent, independent of behavioral demands. Furthermore, we demonstrate differences in figure encoding between more anterior and more posterior regions; perceptual saliency is represented in anterior cortical fields only. Our results suggest an encoding of auditory figures from the earliest cortical stages by a rate code.

Keywords: A1; auditory cortex; auditory figure; auditory figure-ground segregation; auditory object; non-human primate; perceptual organization; rhesus macaque; scene analysis; stochastic figure-ground stimulus.


Conflict of interest statement

Declaration of interests The authors declare no competing interests.

Figures

None
Graphical abstract
Figure 1
Figure 1
Summary of experimental paradigm, behavioral performance, and recording field (A) Schematic spectrogram of an example SFG stimulus. Figure elements are shown in red, and random ground elements in black. Line plots below indicate the 900-ms-long behavioral response window for the displayed stimulus as well as the behavioral outcome for touch bar release inside (HI, hit) and outside (MI, miss) of this time window. (B) Example control stimulus without figure. The trial was correctly performed, if no touch bar release occurred until sound presentation finished (CR, correct rejection). Otherwise, the trial was counted as false alarm (FA). (C–E) Behavioral detection performance of monkey 1 (M1; left, sessions: n = 87) and monkey 2 (M2; right, sessions: n = 67) for coherence levels of 8 (Coh8; green) and 12 (Coh12; red) elements, respectively. Only sessions with more than 200 trials were included. (C) Average d-prime values. (D) Mean reaction time. (E) Response variability measured by the coefficient of variation (standard deviation divided by mean). Stars indicate significance (two-sided Wilcoxon rank-sum test): ∗∗p < 0.01, ∗∗∗p < 0.001. (F) Structural T2 MRI of both subjects. Green vertical lines indicate location of interaural line. Distance of coronal sections from interaural line (mm) is indicated below slice. Recording chamber is filled with saline for visibility. Both recording chambers have a medial tilt (M1: 10 deg, M2: 15 deg) to allow easier access to the lateral auditory cortex. Auditory cortex is highlighted in red. A 10-mm scale bar is shown below. (G) Best frequency maps for M1 (top) and M2 (bottom). Color code indicates average best frequency across the surface of the superior temporal gyrus. Only sites with significant pure tone tuning are shown. Recording coordinates with unmodulated frequency response are not included. Y coordinates show distance to the interaural line (IAL). X coordinates show the grid position. Maps are smoothed with a 2 × 2-mm Gaussian kernel. The black line indicates the division boundary between anterior and posterior recording field based on low-frequency gradient reversal. Labels illustrate the estimated areal membership. (H) Latency map for M1 (top) and M2 (bottom). Color code illustrates average peak latency for each grid position. (I) Location of channels that exhibit significant LFP phase locking (red triangles) overlaid on M2's best frequency map. Strength of phase locking (no. of click train frequencies that elicit phase locking response) is indicated by transparency of triangle. See also Figures S1 and S2.
Figure 2
Figure 2
Figure-onset-aligned responses of an example site (A) Thresholded multi-unit spiking activity (black) and the multi-unit activity envelope (gray) in response to individual SFG stimuli are shown. Twelve different test stimuli were presented, of which 50% contained figures with Coh8 (green, top row). The remaining test stimuli contained figures with Coh12 (red, bottom row). Different plots correspond to individual figure-onset-aligned responses to different SFG stimuli. Figure onset is indicated by a dashed line at time zero. Raster plots are shown on top. Each row corresponds to a trial and each point within a trial to a single spike. Responses are baseline normalized, averaged over all trials. Single chords of the SFG stimulus are indicated in black. The standard error of the mean is illustrated as a shaded area. (B) Fast Fourier transform (FFT) of averaged MUA to SFG control stimuli for this recording site, which was normalized to the maximum power. The 20-Hz peak (black arrow) indicates rhythmic responses to each presented chord. (C) Mean MUA amplitude for stimuli of each coherence condition averaged in time window 201 to 400 ms after figure onset. Due to the small sample size (n = 6 for figure stimuli, n = 8 for control stimuli), no statistical test is shown. (D) Quantification of frequency elements that fall into the frequency-response area (see E) of the recording site for the first eight chords after figure onset shown for each stimulus. Color-coded points show stimulus-wise data. Gray lines demonstrate stimulus-wise linear regression of elements in RF. (E) Pure tone tuning curve of the example site averaged across sound intensities and then normalized to maximum response. Dashed line indicates half maximum. “Responsive” area indicated in gray.
Figure 3
Figure 3
Average population responses of modulated sites to SFG stimuli (A) Average MUA in response to control stimuli for both M1 (black) and M2 (gray). Inset shows zoomed response to four chords (relative to sound onset) and the FFT of the average response, which was normalized to the maximum power. (B) Figure-onset-aligned population time course of modulated recording sites for M1 (top) and M2 (bottom) to auditory figures (red) and control condition with no coherent elements (black). Shaded regions represent the standard error of the mean. Figure onset is indicated as a dashed line. SFG chords are outlined in black below. Significantly different responses for figure versus control conditions are depicted in gray above (two-sided Wilcoxon rank-sum test, p < 0.05, FDR corrected). (C) Spatial maps of the recording field indicate the location of individual figure-responsive sites (red triangles). In contrast to the underlying map, these coordinates are corrected for recording angle and depth to better visualize the spread of modulated recording sites. This can result in locations outside the visible map. (D) Figure-onset aligned population time course of modulated sites for anterior (ANT, left) and posterior (POS, right) recording field for each subject (M1: top, M2: below). Average MUA to Coh12 (red), Coh8 (green), and no coherent elements (CTR, black) is shown. Similar conventions as (B). (E) Color-coded boxplots show neuronal d-prime for each subject (M1: top, M2: below), based on averaged, baseline-normalized MUA between chords 5 to 8 (201 to 400 ms) after figure onset. p values are FDR corrected. Stars indicate significance (two-sided Wilcoxon rank-sum test): p < 0.05, ∗∗p < 0.01, ∗∗∗p < 0.001. See also Figure S3.
Figure 4
Figure 4
Summary of cortical response modulation Data of both subjects were pooled. Averages of onset-aligned (a-d, 201 to 400ms past figure onset) and response-aligned MUA (e-h, -300 to -100ms prior to touch bar release) were used for calculation of area under receiver operating characteristic (AUROC). Histograms show distributions of modulated (p < 0.01, red) and unresponsive recording sites (black). Below: Modulated units overlaid on tonotopic map. Color coding corresponds to effect size. (A and E) Figure-ground modulation. (B and F) Modulation based on figure coherence. (C and G) Modulation based on behavioral detection of temporally coherent elements. Only recordings with at least 20 miss trials were included. (D and H) Modulation based on temporal coherence without detection. Arrows indicate median of distribution. Data were tested against 0.5 with a two-sided Wilcoxon rank-sum test. All p values are FDR corrected. Color-coded stars indicate significance: p < 0.05, ∗∗p < 0.01, ∗∗∗p < 0.001. See also Figures S4 and S5.

References

    1. Atiani S., Elhilali M., David S.V., Fritz J.B., Shamma S.A. Task difficulty and performance induce diverse adaptive patterns in gain and shape of primary auditory cortical receptive fields. Neuron. 2009;61:467–480. - PMC - PubMed
    1. Atiani S., David S.V., Elgueda D., Locastro M., Radtke-Schuller S., Shamma S.A., Fritz J.B. Emergent selectivity for task-relevant stimuli in higher-order auditory cortex. Neuron. 2014;82:486–499. - PMC - PubMed
    1. Bagur S., Averseng M., Elgueda D., David S., Fritz J., Yin P., Shamma S., Boubenec Y., Ostojic S. Go/No-Go task engagement enhances population representation of target stimuli in primary auditory cortex. Nat. Commun. 2018;9:2529. - PMC - PubMed
    1. Barascud N., Pearce M.T., Griffiths T.D., Friston K.J., Chait M. Brain responses in humans reveal ideal observer-like sensitivity to complex acoustic patterns. Proc. Natl. Acad. Sci. USA. 2016;113:E616–E625. - PMC - PubMed
    1. Baumann S., Petkov C.I., Griffiths T.D. A unified framework for the organization of the primate auditory cortex. Front. Syst. Neurosci. 2013;7:11. - PMC - PubMed

Publication types

LinkOut - more resources