. 2021 Jul 21;109(14):2275-2291.e8.
doi: 10.1016/j.neuron.2021.05.020. Epub 2021 Jun 15.

C9orf72 deficiency promotes microglial-mediated synaptic loss in aging and amyloid accumulation

Affiliations

C9orf72 deficiency promotes microglial-mediated synaptic loss in aging and amyloid accumulation

Deepti Lall et al. Neuron. .

Abstract

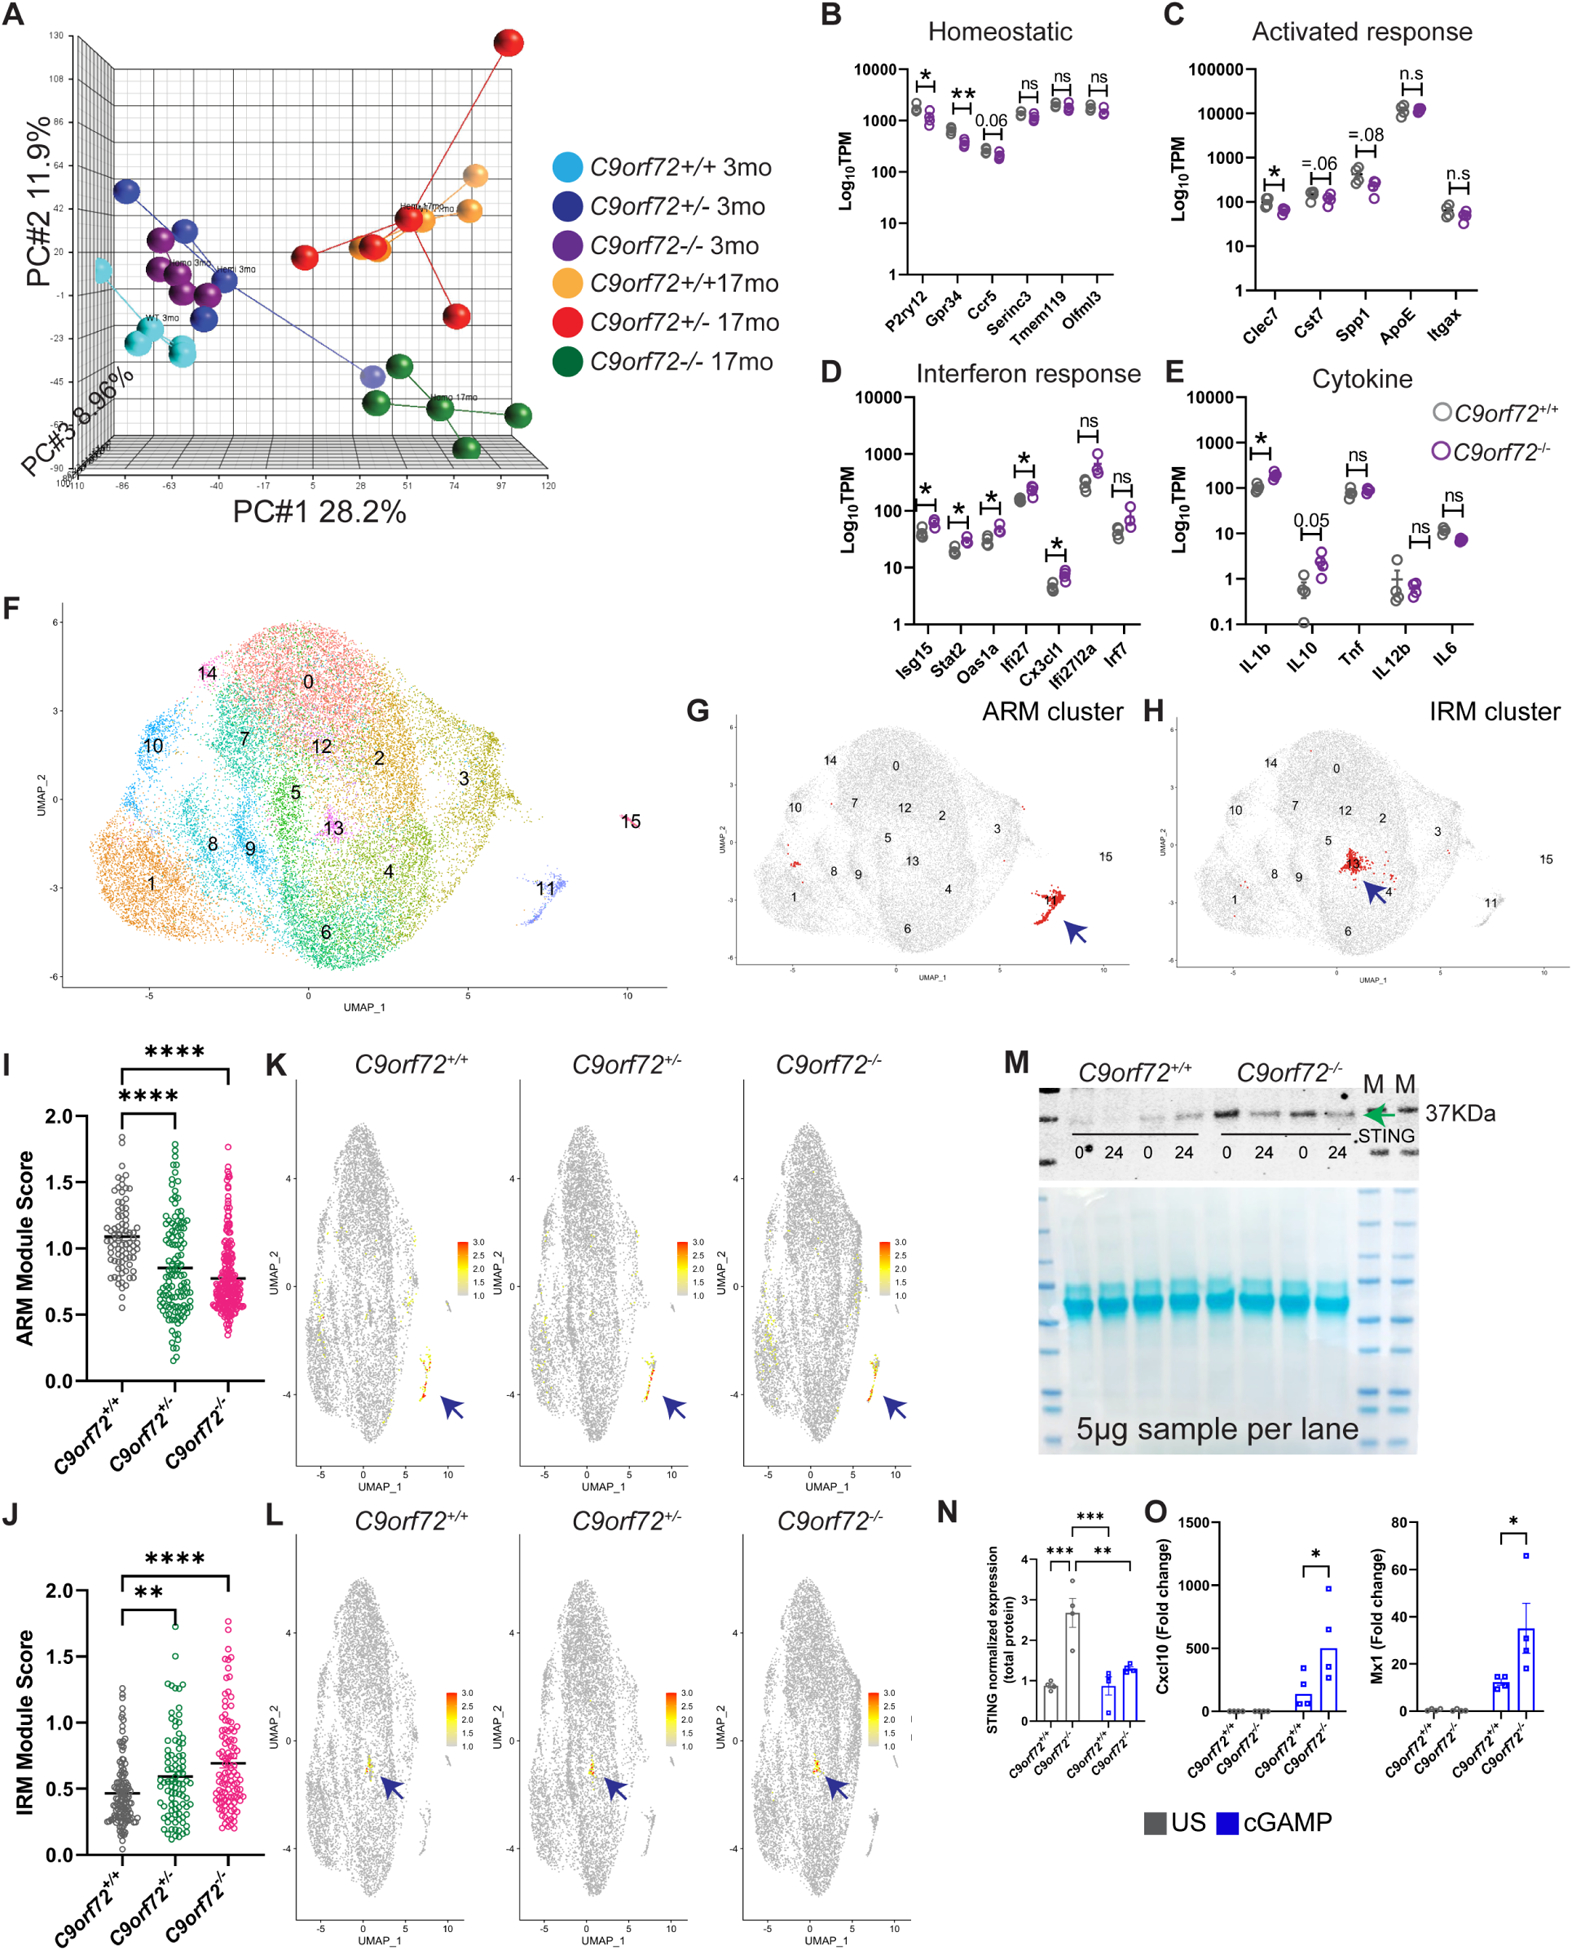
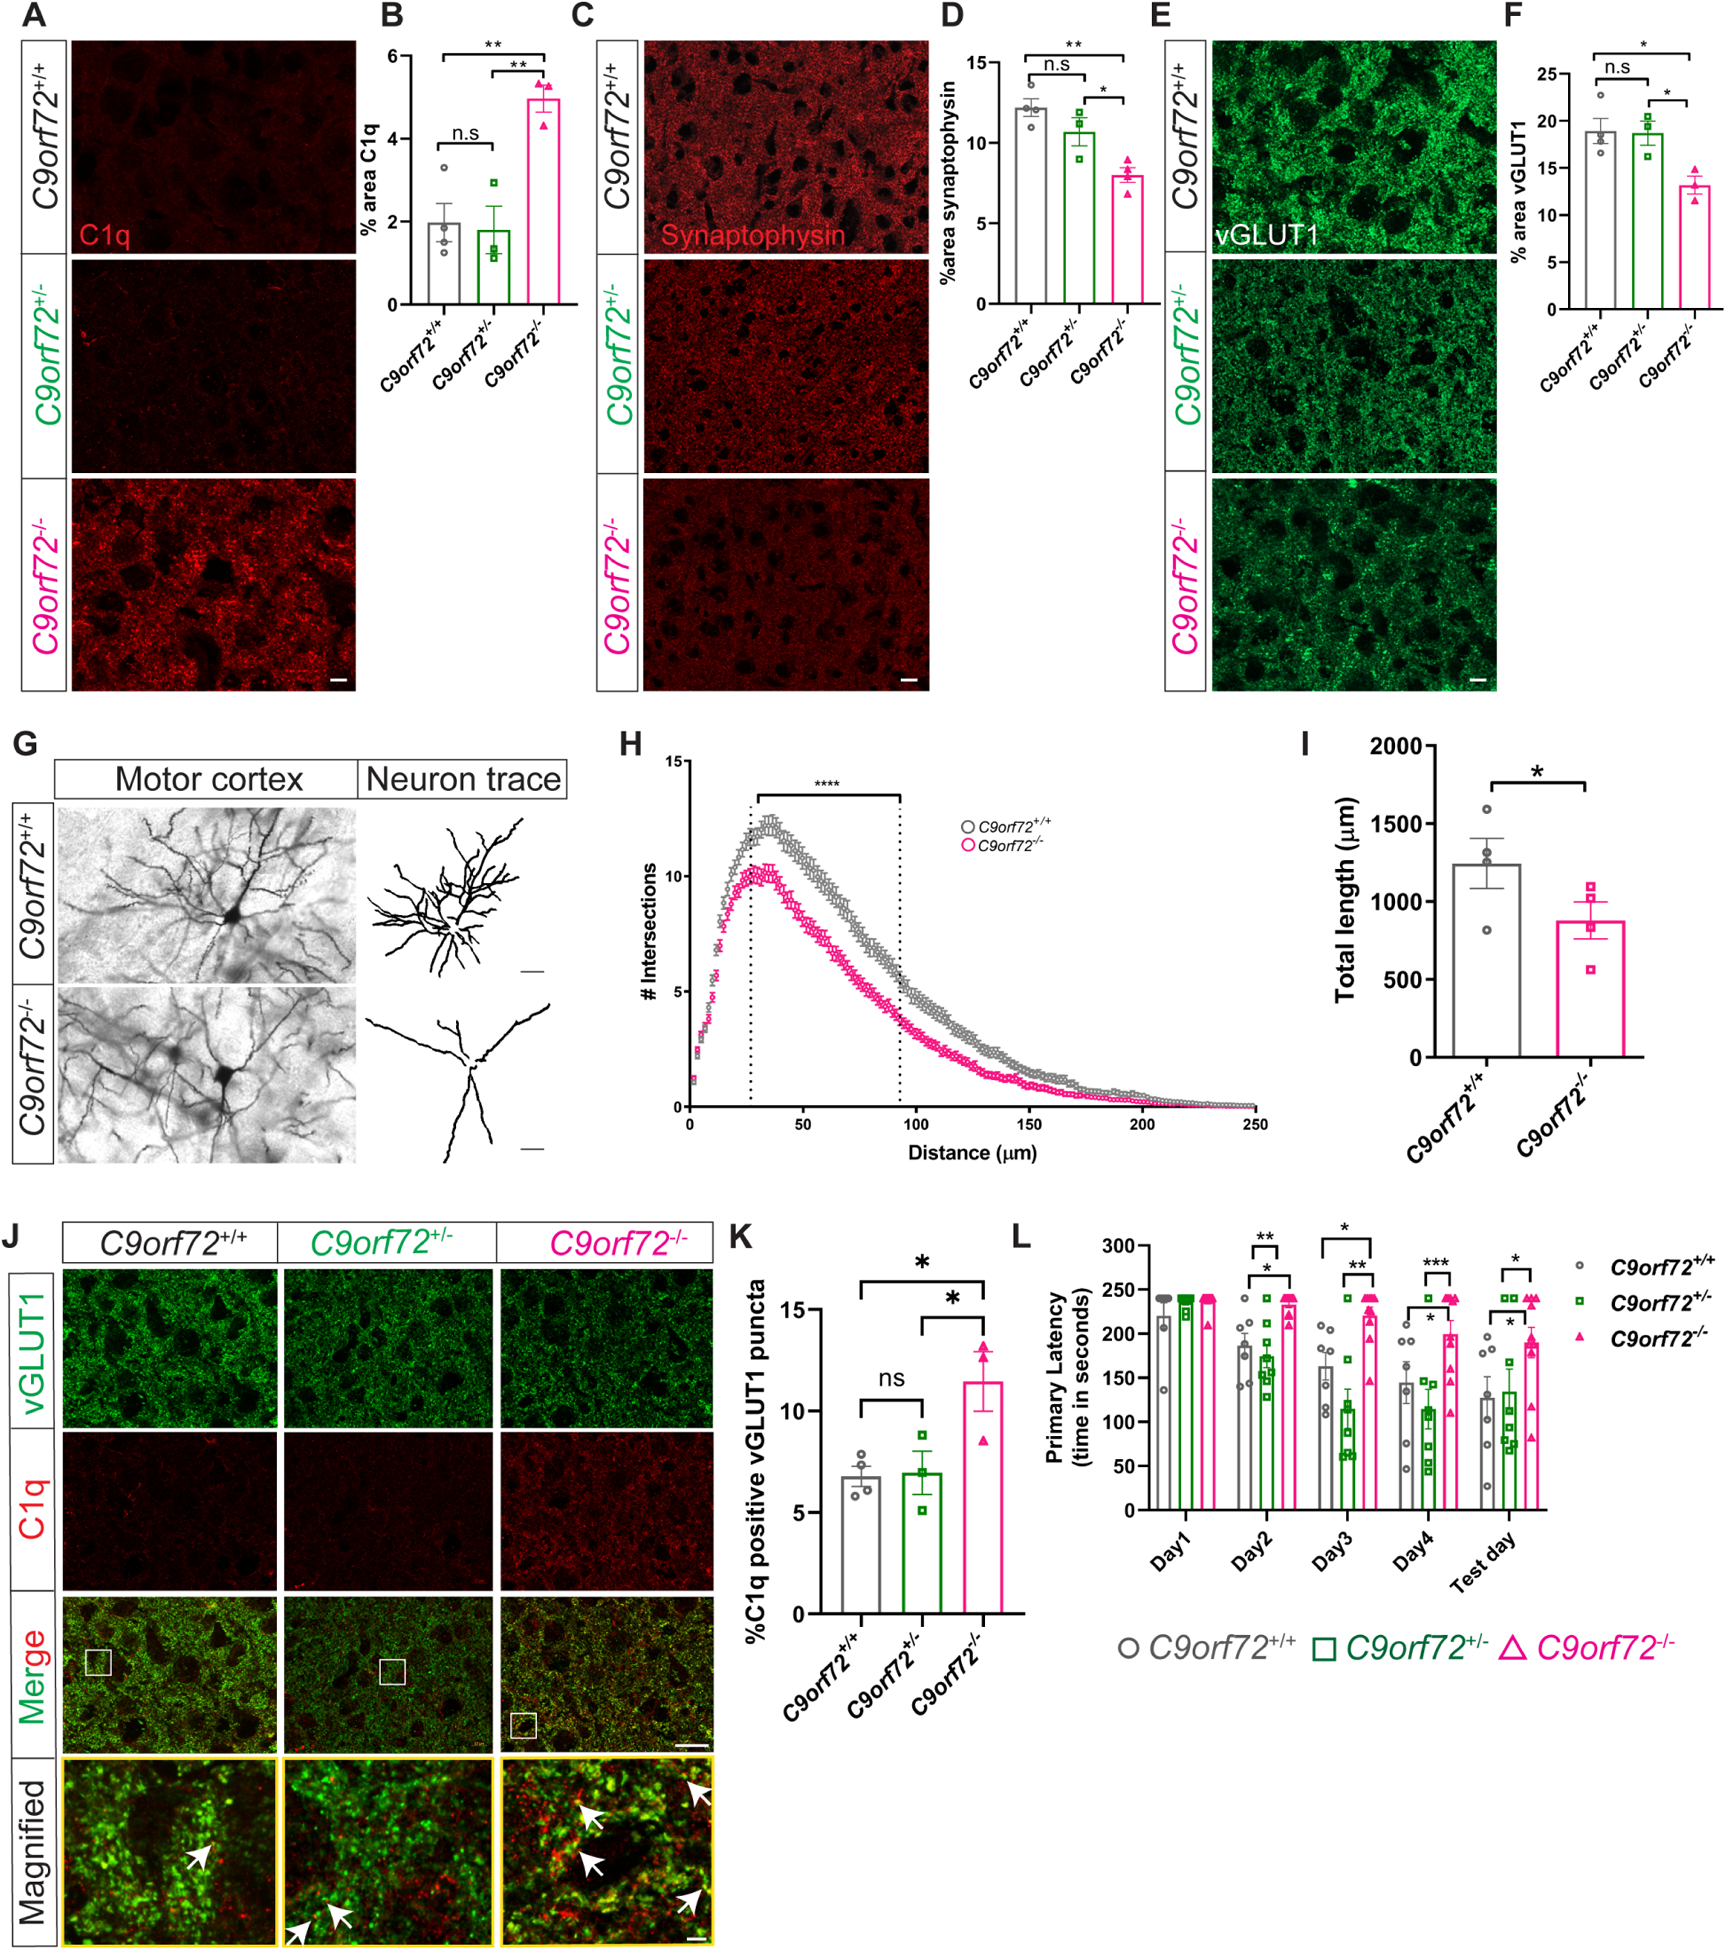
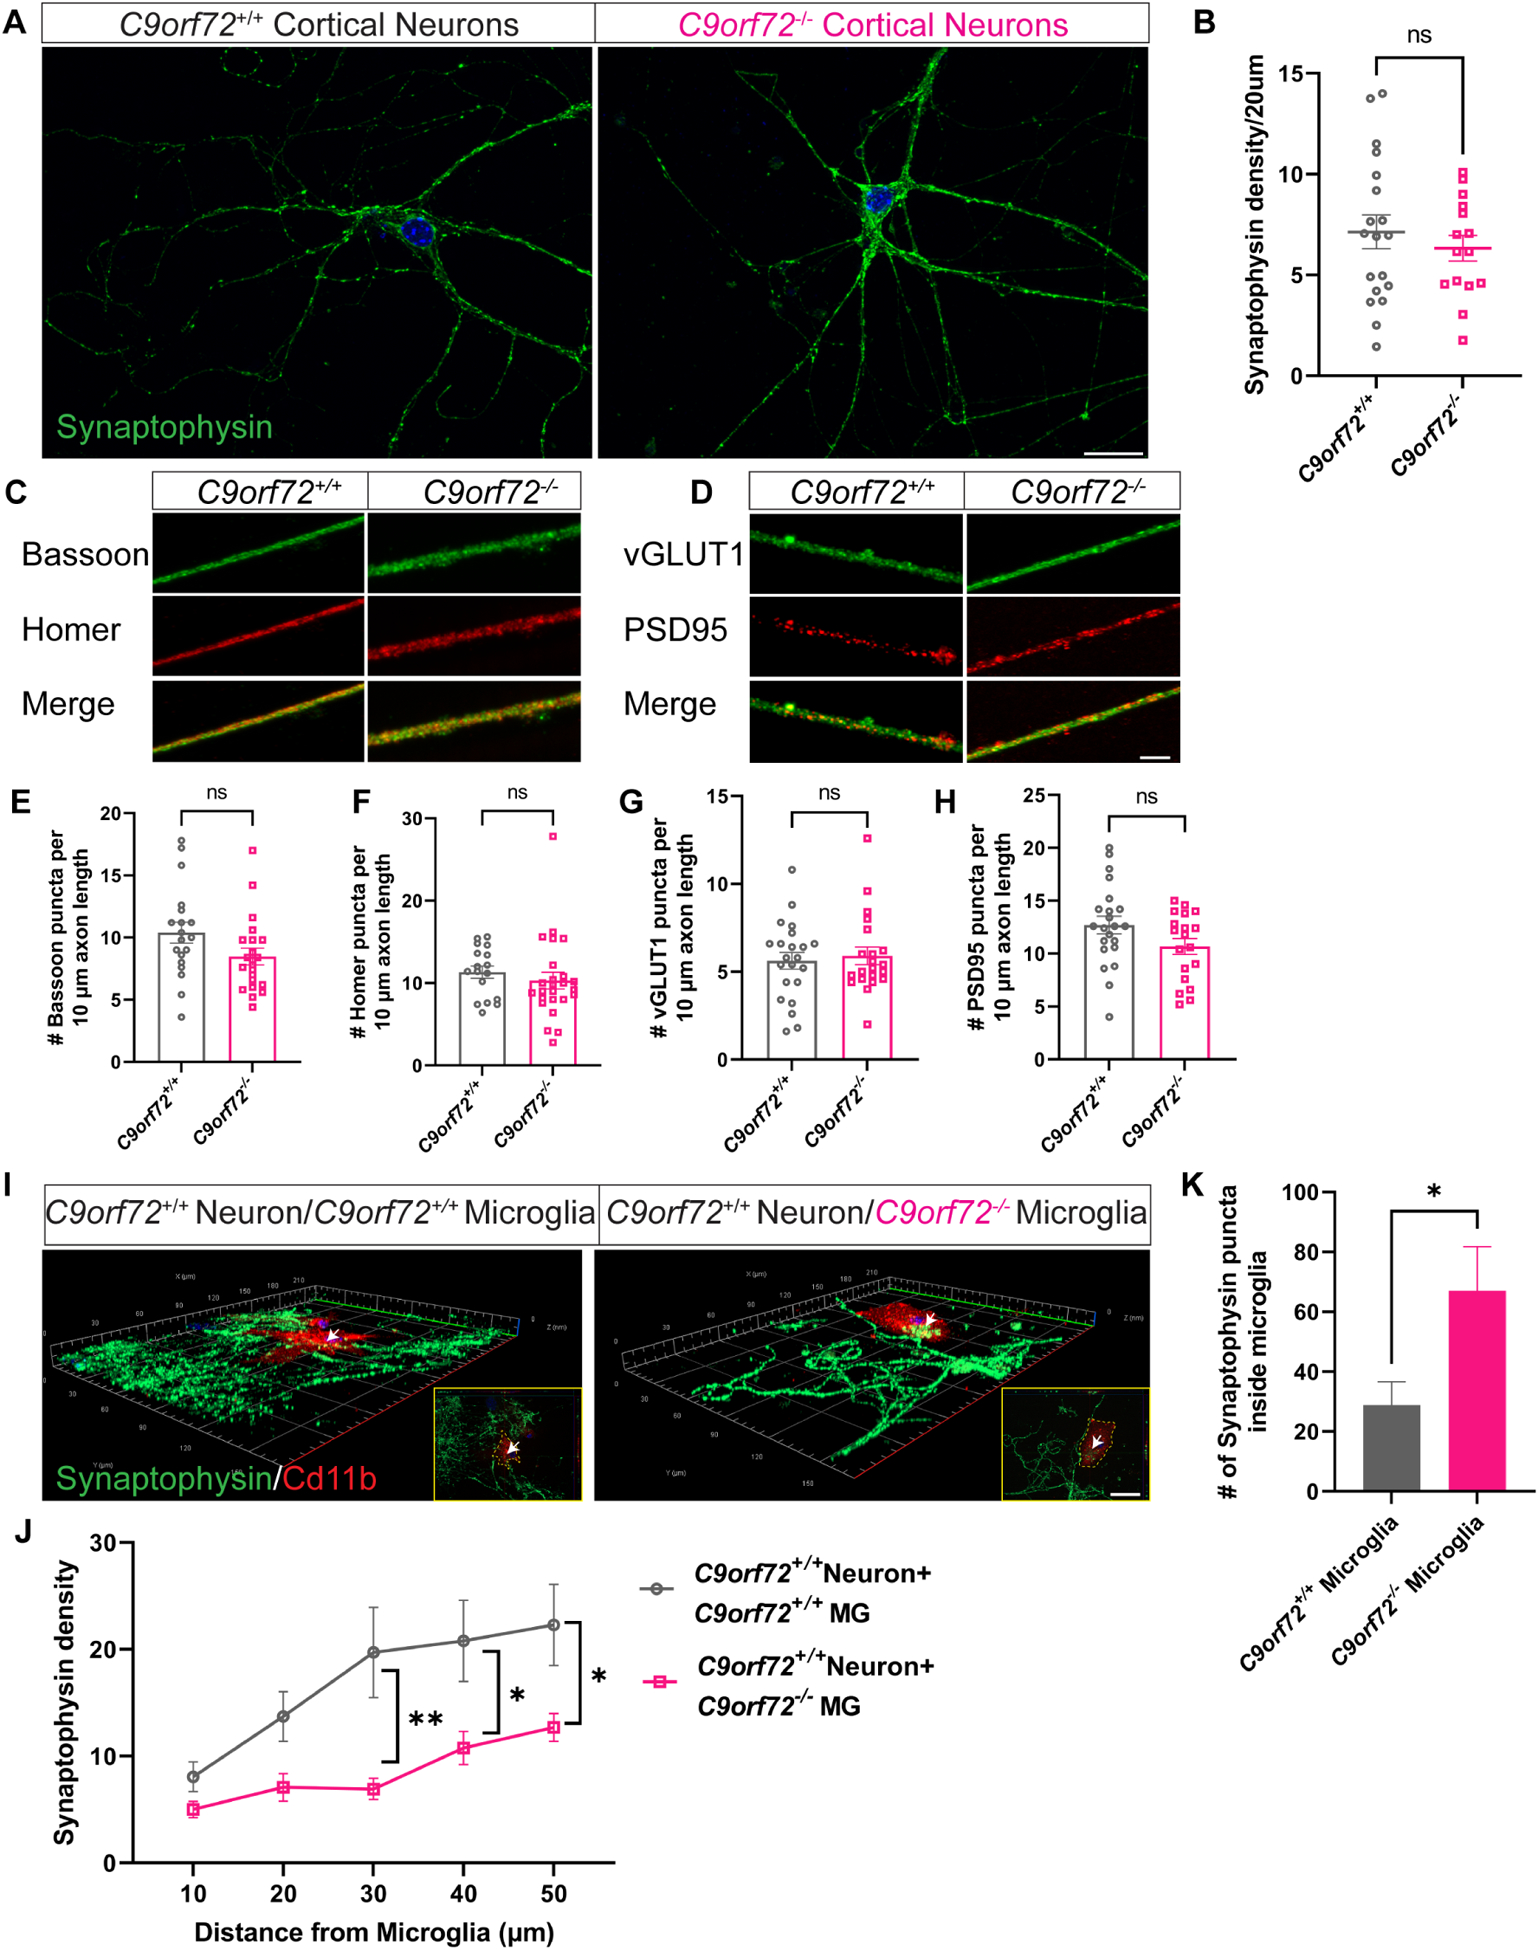
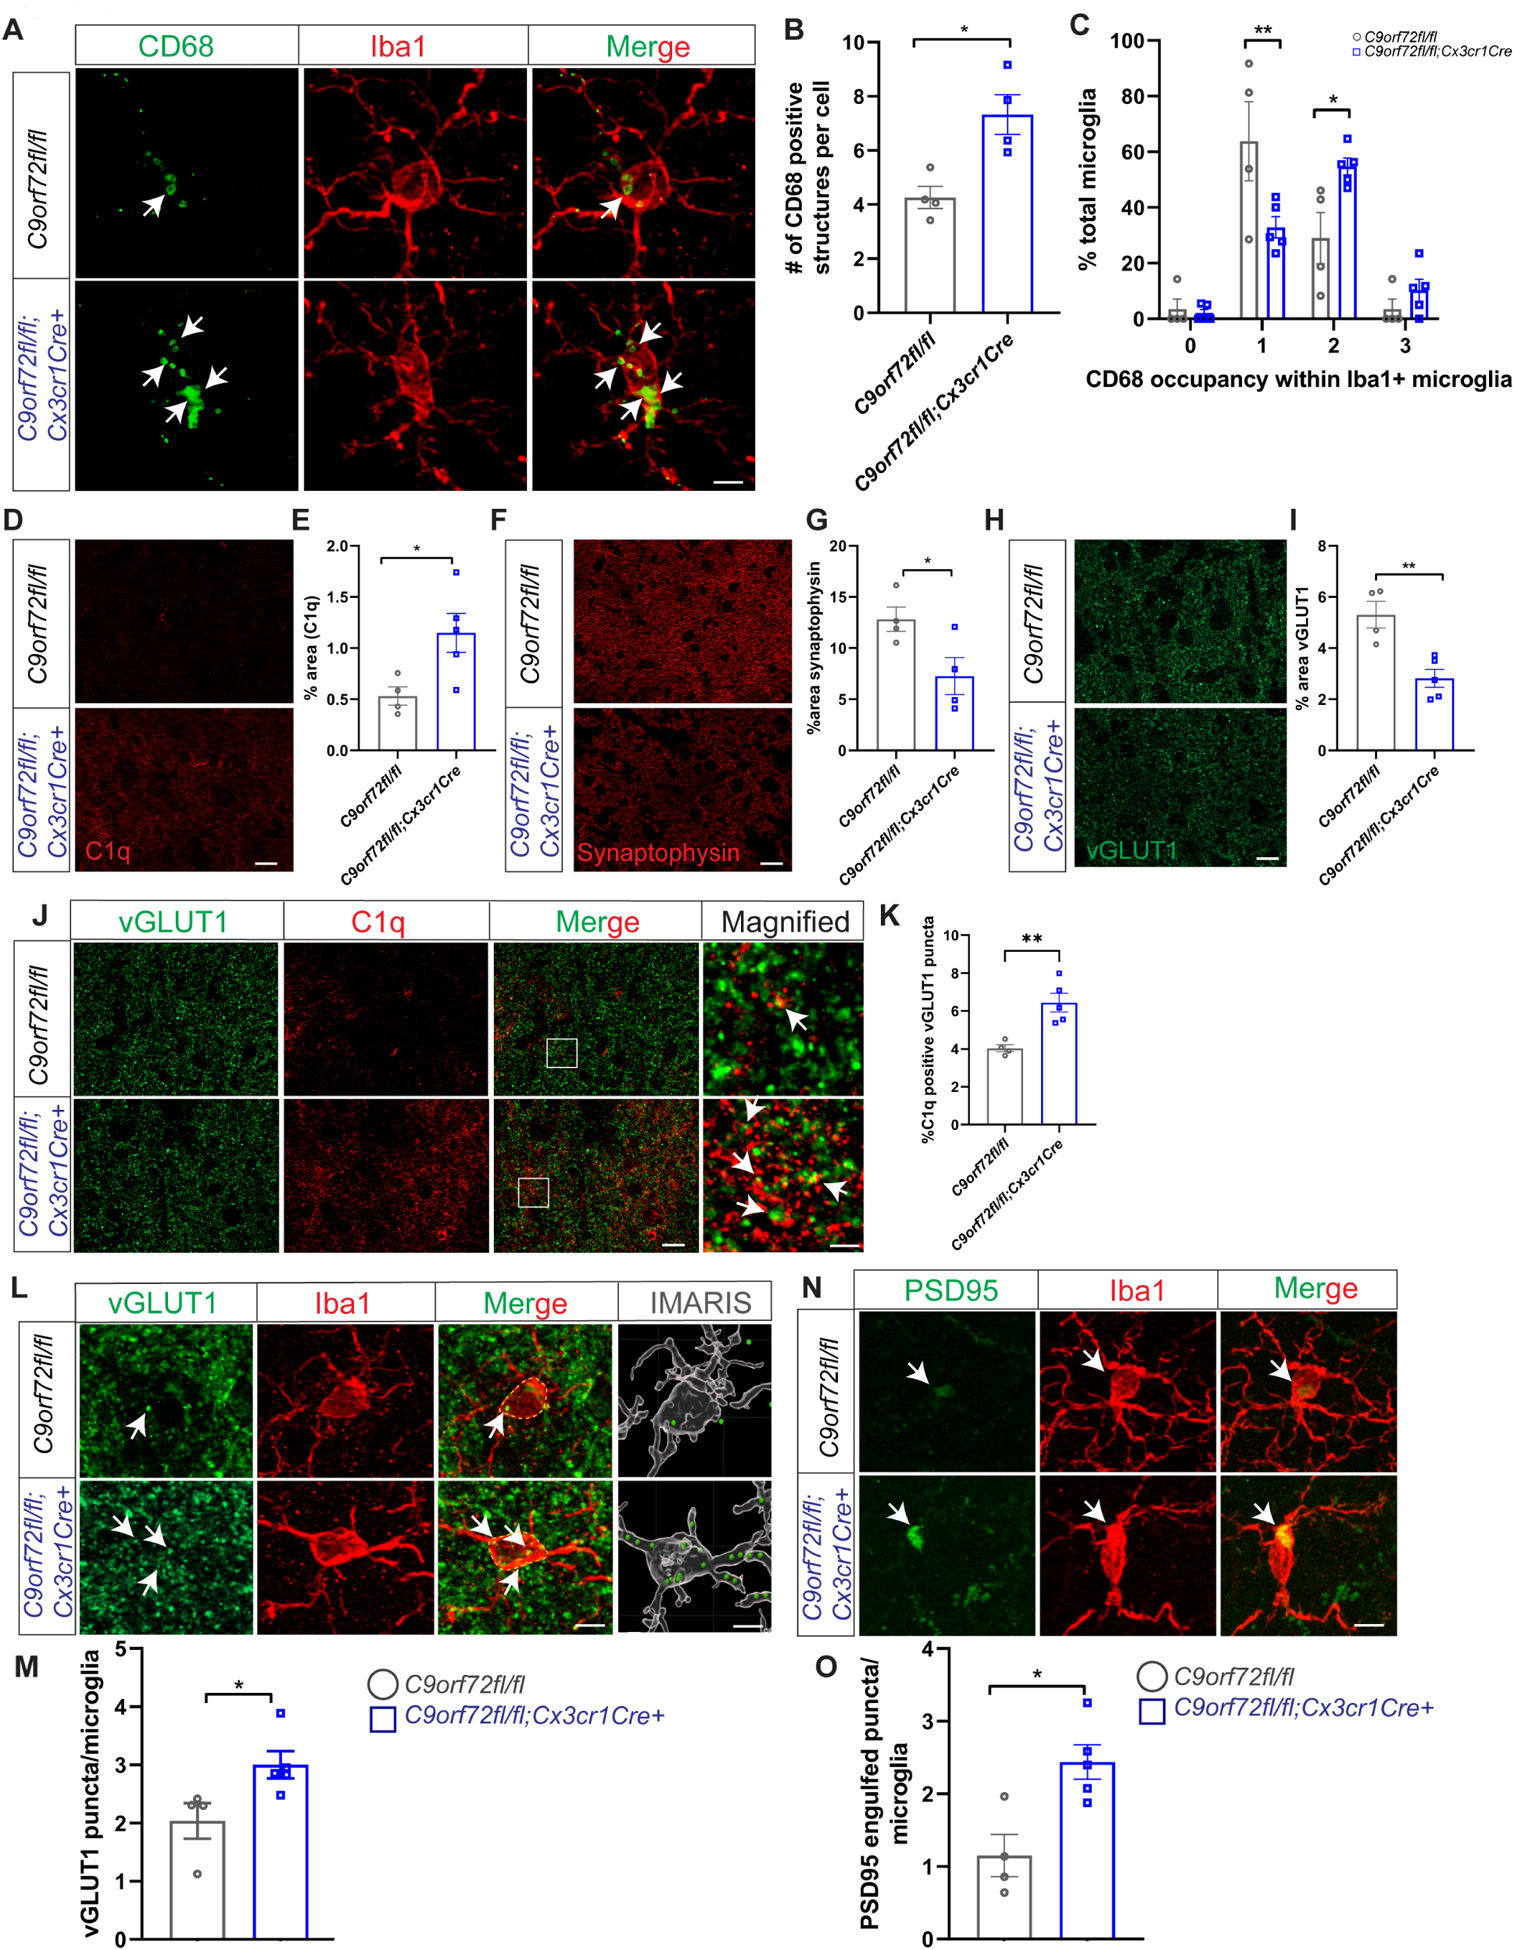
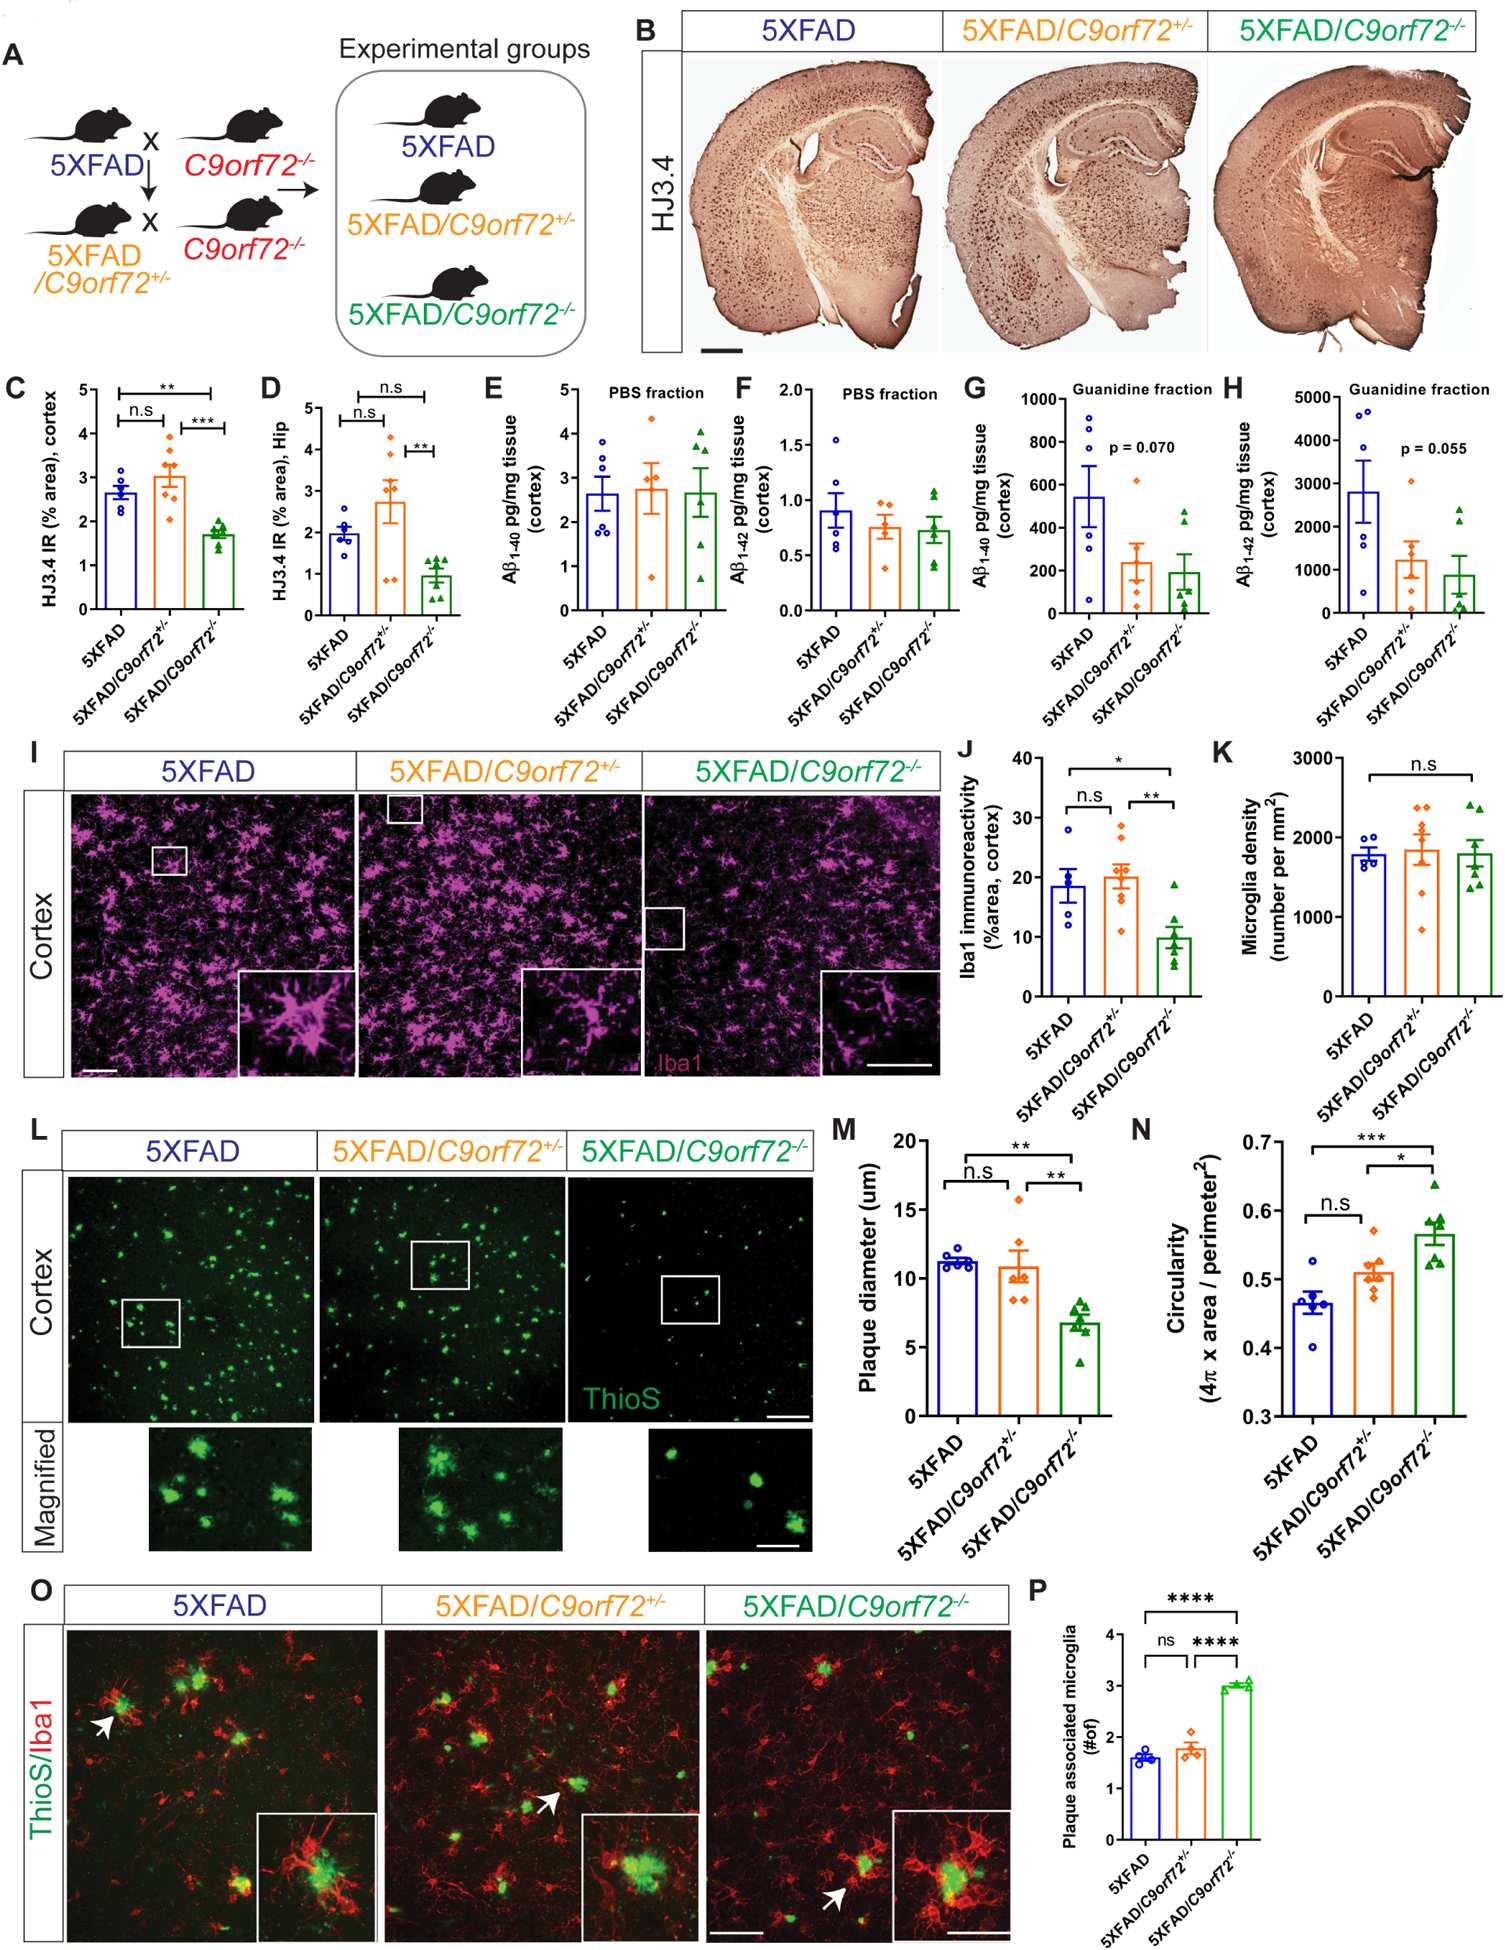
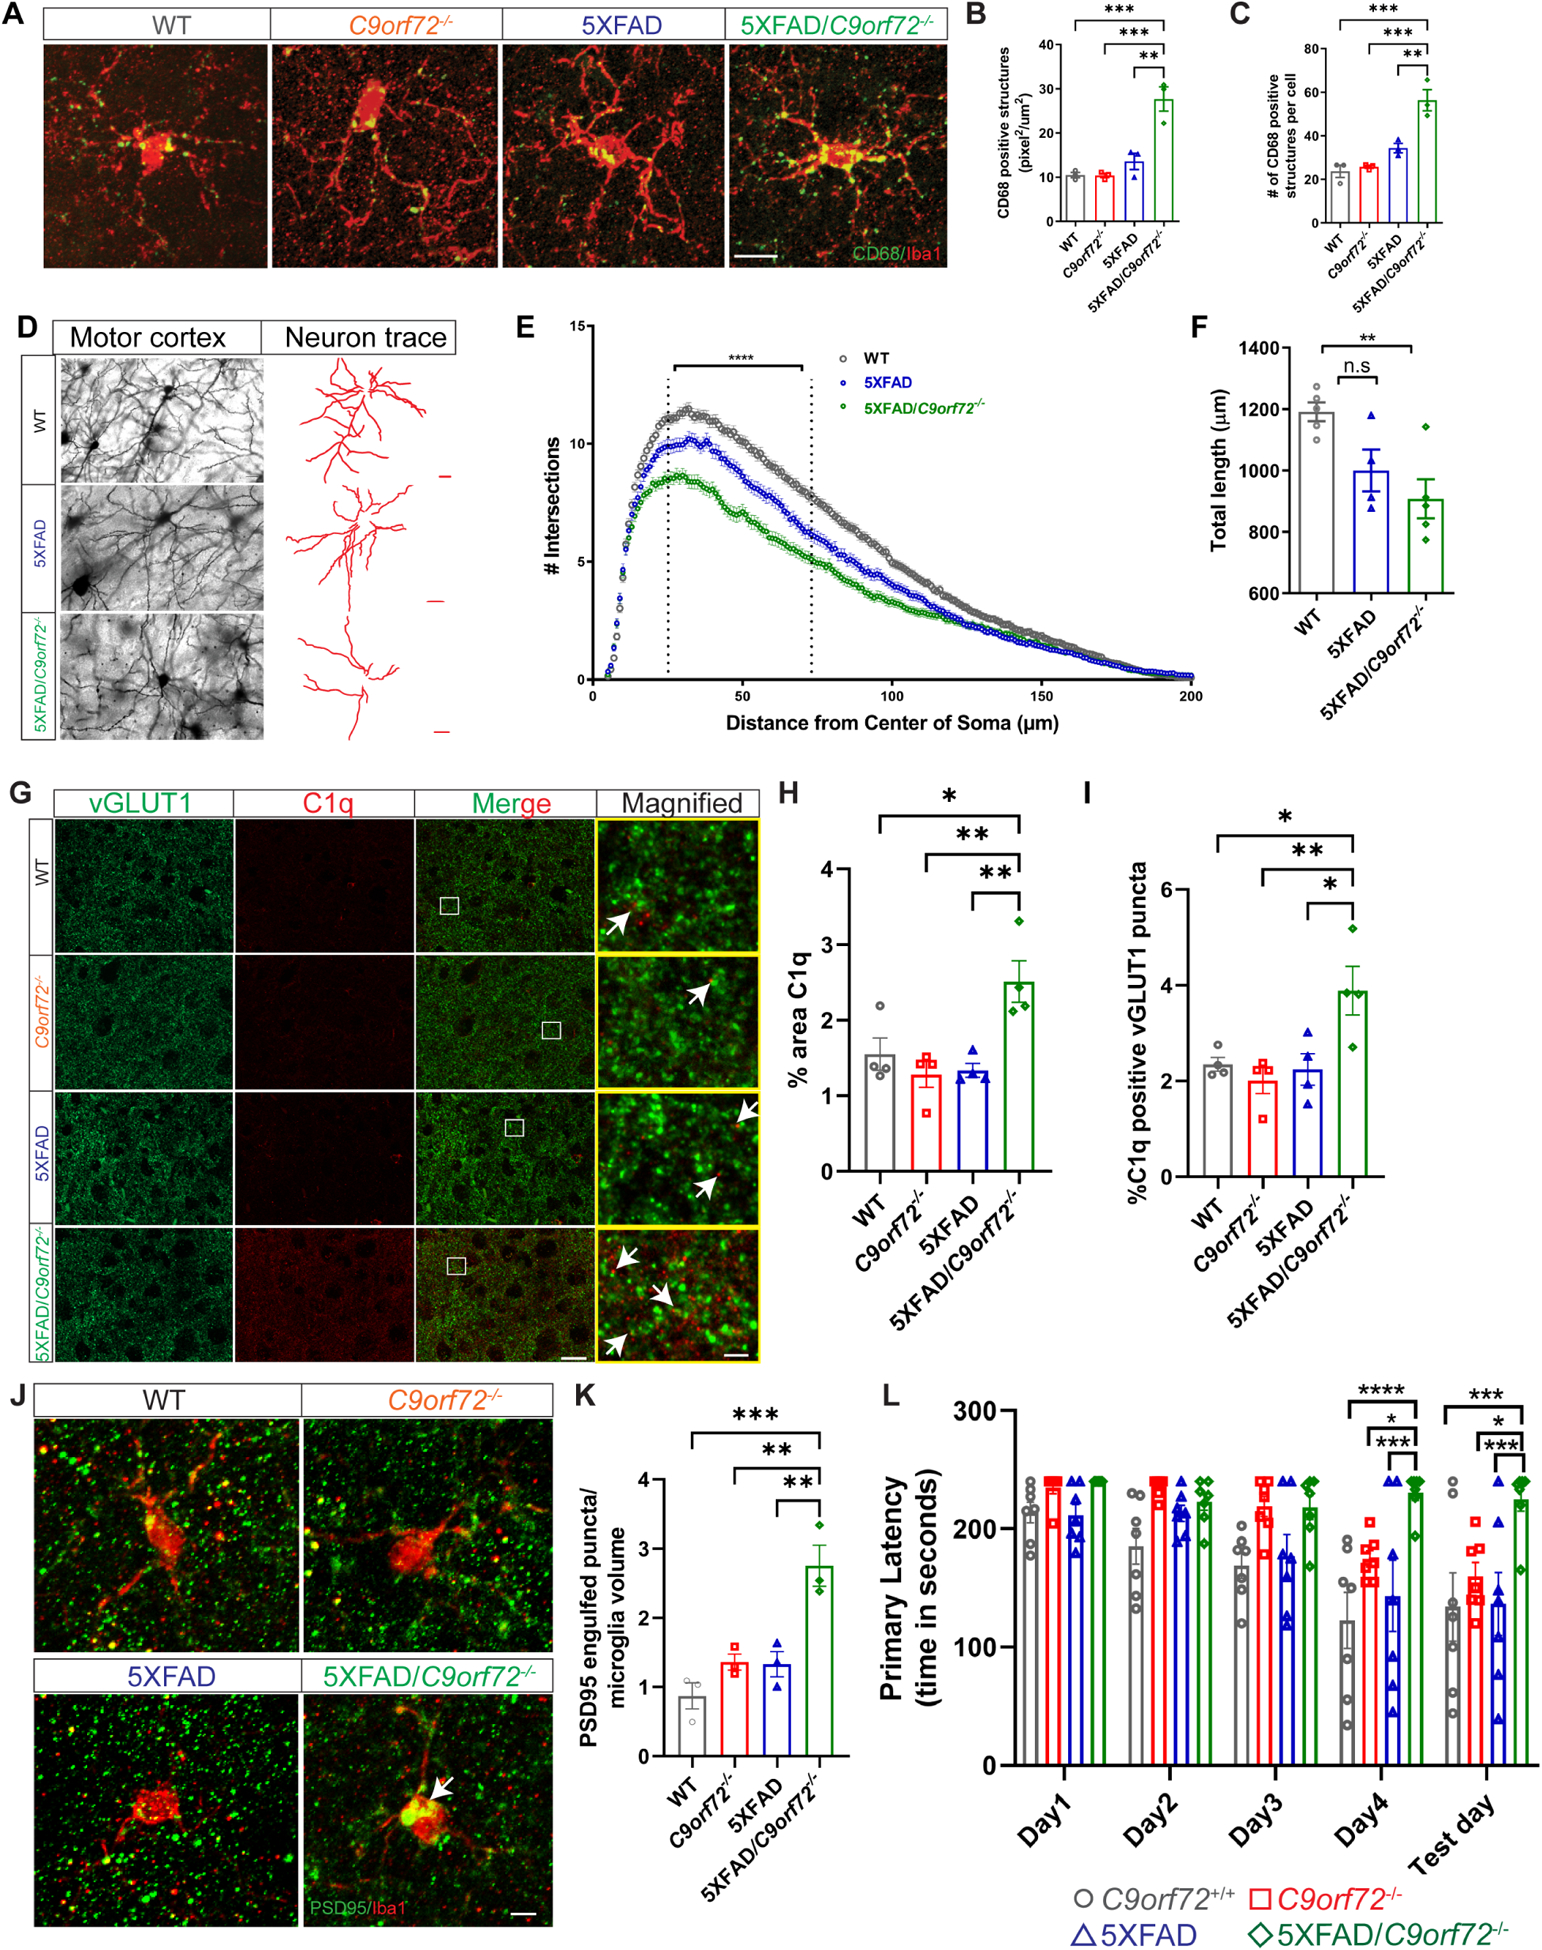
C9orf72 repeat expansions cause inherited amyotrophic lateral sclerosis (ALS)/frontotemporal dementia (FTD) and result in both loss of C9orf72 protein expression and production of potentially toxic RNA and dipeptide repeat proteins. In addition to ALS/FTD, C9orf72 repeat expansions have been reported in a broad array of neurodegenerative syndromes, including Alzheimer's disease. Here we show that C9orf72 deficiency promotes a change in the homeostatic signature in microglia and a transition to an inflammatory state characterized by an enhanced type I IFN signature. Furthermore, C9orf72-depleted microglia trigger age-dependent neuronal defects, in particular enhanced cortical synaptic pruning, leading to altered learning and memory behaviors in mice. Interestingly, C9orf72-deficient microglia promote enhanced synapse loss and neuronal deficits in a mouse model of amyloid accumulation while paradoxically improving plaque clearance. These findings suggest that altered microglial function due to decreased C9orf72 expression directly contributes to neurodegeneration in repeat expansion carriers independent of gain-of-function toxicities.

Keywords: Alzheimer’s disease; C9orf72; amyotrophic lateral sclerosis; frontotemporal dementia; microglia; neurodegeneration.


Conflict of interest statement

Declaration of interests R.H.B. is employed by Roche Pharmaceuticals. D.M.H. is listed as an inventor on a patent licensed by Washington University to C2N Diagnostics on the therapeutic use of anti-tau antibodies. D.M.H. co-founded and is on the scientific advisory board of C2N Diagnostics, LLC. C2N Diagnostics, LLC, has licensed certain anti-tau antibodies to AbbVie for therapeutic development. D.M.H. is on the scientific advisory board of Denali and consults for Genentech, Merck, and Cajal Neurosciences. D.M.H. and J.D.U. are listed as inventors on a provisional patent from Washington University on TREM2 antibodies. R.S. is on the scientific advisory board of Spinogenix Inc.

Figures

Figure 1:
Figure 1:. Altered microglia transcriptome profile in C9orf72−/− mice.
(A) PCA analysis of RNAseq from acutely isolated microglia from 3 and 17-month-old C9orf72+/+, C9orf72+/− and C9orf72−/− mice, n=4 per genotype. (B-E) 17-month TPM graphs of (B) homeostatic, (C) activated response microglia, (D) interferon response microglia, and (E) cytokine genes. (F) scRNAseq analysis showing UMAP of 26,275 microglial cells from all genotypes at 12 months, n=3 per genotype. (G) UMAP plot of ARM cluster. (H) UMAP plot of IRM cluster. (I) ARM module score in C9orf72+/+, C9orf72+/− and C9orf72−/− mice. (J) IRM module score in C9orf72+/+, C9orf72+/− and C9orf72−/− mice. (K) UMAP plot colored for expression for ARM module score separated by genotypes. (L) UMAP plot colored for expression for IRM module score separated by genotypes. (M) Western blot analysis of microglia stimulated with cGAMP (10 μg/ml) for 0 and 24hr showing increased levels of STING in C9orf72−/− vs C9orf72+/+animals (images representative of two experiments with four biological replicates). Arrow indicates band specific for STING. (N) Quantification of western blot. (O) qRT–PCR analysis of CXCL10 and Mx1 production by microglia isolated from C9orf72+/+ and C9orf72−/− mouse brains (n = 4 each) after stimulation with cGAMP (10 μg/ml) for 24hr. Data shown as mean ± SEM. Each dot represents one sample. Two-way ANOVA with Tukey’s multiple comparison test, **p<0.005, ***p<0.0005. For panels B-E, mean ±SEM, Unpaired t test with Welch correction, two-tailed, n=4 per genotype, **p=.0012, *p<0.05. Some genes are shown with exact p-value =.05. ns – not significant. For panels I &J only positively log fold change genes were used for analysis. See also Figure S1 & S2, Table S2.
Figure 2:
Figure 2:. Synaptic and behavioral defects in aged C9orf72−/− mice.
(A) Representative images of C1q immunoreactivity in the motor cortex of C9orf72+/+, C9orf72+/−, and C9orf72−/− mice at 12 months and (B) quantification. mean ±SEM, One-way ANOVA with Tukey’s multiple comparison test, n=3–4 per genotype, **p<0.005. (C) Motor cortex from 12-month-old C9orf72+/+, C9orf72+/−, and C9orf72−/− mice immunostained with synaptophysin and (D) quantification, mean ±SEM, One-way ANOVA with Tukey’s multiple comparison test, n=3–4 per genotype, *p<0.05, **p<0.005. (E) Representative confocal images of vGLUT1 immunoreactivity from 12-month-old C9orf72+/+, C9orf72+/−, and C9orf72−/− mice and (F) quantification. mean ±SEM, One-way ANOVA with Tukey’s multiple comparison test, n=3–4 per genotype, *p<0.05. Scale bars: 10μm. (G) Neuronal morphology tracings from motor cortex of Golgi stained 12-month C9orf72+/+ and C9orf72−/− mice brains; n=4 per genotype. Scale bars: 20μm. (H) Sholl analysis of dendritic arborization, Ordinary Two-way ANOVA, ****p<0.0001. (I) Total length of the neurites in the indicated genotypes, mean ±SEM, Unpaired t-test, two-tailed, n=4 per genotype, *p<0.05. (J) Representative images of vGLUT1 (green) and C1q (red) proteins in the motor cortex of 12-month C9orf72+/+, C9orf72+/−, and C9orf72−/− mice. Rectangular box indicates magnified region. White arrows indicate vGLUT1 positive puncta either co-localized or next to C1q immunoreactive puncta. Scale bars: 10μm, 5μm. (K) Quantification of C1q positive vGLUT1 puncta, mean ±SEM, One-way ANOVA with Tukey’s multiple comparison test, n=3–4 per genotype, *p<0.05. (L) Barnes maze analysis of primary latency from 12-month-old C9orf72+/+ (n=7), C9orf72+/− (n=8), and C9orf72−/− (n=10) mice. Two-way repeated measure ANOVA with Tukey’s multiple comparison test, time x genotype F(8, 88)=2.075, p=0.0467, time effect: F(3.127, 68.79)=16.14, p<0.0001, genotype effect: F(2, 22)=13.30, p=0.0002, *p<0.05, ***p<0.0005, ****p<0.0001. See also Figure S3.
Figure 3.
Figure 3.. Increased synaptic pruning and phagocytosis by C9orf72−/− microglia.
(A) Confocal images showing synaptophysin expression in C9orf72+/+ and C9orf72−/− cortical neuron cultures at 14 days in vitro. Scale bars: 20μm and (B) quantification, mean ±SEM, Unpaired t-test with Welch’s correction. (C) Representative confocal images of presynaptic (Bassoon and vGLUT1) and (D) postsynaptic (Homer and PSD95) markers in neuronal cultures from C9orf72+/+ and C9orf72−/− mice. Scale bars: 10μm. (E-H) Quantification of pre- and post-synaptic marker densities. (I) Representative 3D confocal images of synaptophysin density around C9orf72+/+ and C9orf72−/− Cd11b+ microglia. Inset shows synaptophysin+ puncta inside Cd11b microglia. Scale bars: 20μm. (J) Quantification of synaptophysin density, Two-way ANOVA with Sidak’s multiple comparison test, mean ±SEM, *p<0.05, **p<0.005. (K) Number of synaptophysin puncta inside microglia, mean ±SEM, n=10 cells per genotype, Unpaired t-test, *p<0.05. White arrows indicate synaptophysin puncta inside microglia and is zoomed in white box.
Figure 4:
Figure 4:. Enhanced synaptic pruning in microglia specific C9orf72 knockout mice.
(A) Iba1 and CD68 co-stain in motor cortex of 12-month C9orf72fl/fl and C9orf72-fl/fl:Cx3cr1Cre+ mice showing CD68+ lysosomal accumulations (white arrows). Scale bars: 5μm. (B) & (C) Quantification of cells with CD68+ lysosomal accumulations. For panel B, mean ±SEM, Unpaired t-test with Welch correction, two-tailed, n=4 per genotype, *p<0.05. For panel C, mean ±SEM, Two-way ANOVA with Sidak’s multiple comparison test, n=4–5 per genotype per age. **p < 0.005, *p < 0.05. (D) Representative images of C1q immunoreactivity in the motor cortex of 12-month-old C9orf72fl/fl and C9orf72fl/fl:Cx3cr1Cre+ mice and (E) quantification, mean ±SEM, Unpaired t test with Welch’s correction, two-tailed, n=4–5 per genotype, *p<0.05. (F) Motor cortex from 12-month-old C9orf72fl/fl and C9orf72-fl/fl:Cx3cr1Cre+ mice immunostained with synaptophysin and (G) quantification, mean ±SEM, Unpaired t-test with Welsh correction, two-tailed, n=4–5 per genotype, *p<0.05. Scale bars: 10μm. (H) Representative confocal images of vGLUT1 immunoreactivity in 12-month-old C9orf72fl/fl and C9orf72-fl/fl:Cx3cr1Cre+ mice and (I) quantification, mean ±SEM, Unpaired t test with Welch’s correction, two-tailed, n=4–5 per genotype, **p<0.005. (J) Representative images of vGLUT1 (green) and C1q (red) proteins in the motor cortex of 12-month C9orf72fl/fl and C9orf72-fl/fl:Cx3cr1Cre+ mice. Scale bars: 10μm Rectangular box indicates magnified region. Scale bars: 5μm. White arrows indicate vGLUT1 positive puncta either co-localized or next to C1q immunoreactive puncta and (K) quantification, mean ±SEM, Unpaired t test with Welch’s correction, two-tailed, n=4–5 per genotype, **p<0.005. (L) Confocal and IMARIS reconstruction images showing vGLUT1+ puncta within Iba+ microglia in motor cortex of 12-month C9orf72fl/fl and C9orf72-fl/fl:Cx3cr1Cre+ (white arrows), scale bars 5μm, 1μm and (M) quantification, mean ±SEM, Unpaired t-test with Welsh correction, two-tailed, n=4–5 per genotype, *p< 0.05. (N) Confocal images showing PSD95+ structures within Iba+ microglia in motor cortex of 12-month C9orf72fl/fl and C9orf72-fl/fl:Cx3cr1Cre+ (white arrows) and (O) quantification, mean ±SEM, Unpaired t-test, two-tailed, n=4–5 per genotype, *p< 0.05. Scale bars: 5μm.
Figure 5:
Figure 5:. Decreased C9orf72 gene dosage alters amyloid plaque burden and microglial plaque engagement.
(A) Schematic of breeding strategy for experimental groups. (B) Immunostaining for Aβ with mHJ3.4 antibody in 6-month-old 5XFAD, 5XFAD/C9orf72+/−, and 5XFAD/C9orf72−/− animals. Scale bars: 100μm. (C) & (D) Quantification of Aβ immunoreactivity in the cortex and hippocampus respectively, mean ±SEM, One-way ANOVA with Tukey’s multiple comparison test, **p<0.005, ***p<0.0005. (E-H) Soluble and insoluble Aβ1–40 and Aβ1–42 levels in hippocampus of 2-month-old 5XFAD, 5XFAD/C9orf72+/−, and 5XFAD/C9orf72−/− mice as detected by ELISA. (I) Representative confocal maximum intensity projections images of Iba+ microglia in the cortex of 5XFAD, 5XFAD/C9orf72+/−, and 5XFAD/C9orf72−/− animals at 6 months. Scale bars: 100 μm, inset 25μm. (J) Quantification of Iba+ immunoreactivity and (K) microglial density in cortex, n=5–7 per genotype, mean ±SEM, One-way ANOVA with Tukey’s multiple comparison test, *p<0.05, **p<0.005. (L) Representative images of plaque morphology in 6-month-old 5XFAD, 5XFAD/C9orf72+/−, and 5XFAD/C9orf72−/− mice. Scale bars: 100 μm, inset 25μm. (M) Average plaque size and (N) circularity in indicated genotypes, n=6 mice per group, mean ±SEM, One-way ANOVA with Tukey’s multiple comparison test, *p<0.05, **p<0.005, ***p<0.0005. (O) Images showing interaction between microglia (Iba1+, red) and plaques (ThioS, green) in cortex of 6-month-old 5XFAD, 5XFAD/C9orf72+/−, and 5XFAD/C9orf72−/− mice. Scale bars: 50 μm, inset 20μm. (P) Quantification of plaque-associated microglia (Iba1+). n=4 animals per genotype, mean ±SEM, One-way ANOVA with Tukey’s multiple comparison test, ****p<0.0001. See also Figure S4, Figure S5.
Figure 6:
Figure 6:. Enhanced microglial lysosome accumulation, neuronal and synaptic defects in 5XFAD:C9orf72−/− mice.
(A) Confocal images of CD68+/Iba1+ microglia from motor cortex of 4-month-old wild-type (WT), C9orf72−/−, 5XFAD, and 5XFAD/C9orf72−/− mice. Scale bars: 25μm. (B) & (C) Quantification of CD68+ total number and volume in different genotypes. Volumes are expressed as pixel2/μm2 per microglia, n=3 mice per genotype, 10–24 microglia per animal per genotype, mean ±SEM, One-way ANOVA with Tukey’s multiple comparison test, **p<0.005, ***p<0.0005. (D) Images of neuronal morphology and neuronal tracings from motor cortex of Golgi stained 4-month-old WT, 5XFAD, and 5XFAD/C9orf72−/− animals. Scale bars: 20μm. (E) Sholl analysis, Two-way ANOVA, ****p<0.001, n=5–6 animals per genotype. (F) Total length of neurites in indicated genotypes, mean ±SEM, Ordinary One-way ANOVA, **p<0.05. (G) Immunostaining of vGLUT1 (green) and C1q (red) in motor cortex of 4-month-old WT, C9orf72−/−, 5XFAD, and 5XFAD/C9orf72−/− animals. Scale bars: 10μm. Rectangular box denotes magnified region. White arrows indicate vGLUT1 positive puncta either co-localized or next to C1q immunoreactive puncta. Scale bars: 5μm. (H) Quantification of total C1q immunoreactivity, n=4 per genotype. mean ±SEM, One-way ANOVA with Tukey’s multiple comparison test, *p<0.05, **p<0.005. (I) Quantification of C1q positive vGLUT1 puncta, mean ±SEM, One-way ANOVA with Tukey’s multiple comparison test, n=4 per genotype, *p<0.05, **p<0.005. (J) Confocal images showing PSD95+ structures within Iba+ microglia (white arrows) in motor cortex of WT, C9orf72−/−, 5XFAD, and 5XFAD/C9orf72−/− mice, scale bars 10μm and (K) quantification, mean ±SEM, n=3 per genotype. One-way ANOVA with Tukey’s multiple comparison test, **p<0.05, ***p<0.0005. (L) Barnes maze analysis of primary latency from 4-month-old WT, C9orf72−/−, 5XFAD, and 5XFAD/C9orf72−/− mice (n=7 per genotype), Two-way repeated measure ANOVA with Tukey’s multiple comparison test, time x genotype, F(12, 96)=1.972, p=0.0351, time effect: F(2.521, 60.51)=16.59, p<0.0001, genotype effect: F(3, 24)=9.832, p=0.0002, *p<0.05, **p<0.005, ***p<0.0005, ****p<0.0001. See also Figure S6.

Comment in

References

    1. ABO-RADY M, KALMBACH N, PAL A, SCHLUDI C, JANOSCH A, RICHTER T, FREITAG P, BICKLE M, KAHLERT AK, PETRI S, STEFANOV S, GLASS H, STAEGE S, JUST W, BHATNAGAR R, EDBAUER D, HERMANN A, WEGNER F & STERNECKERT JL 2020. Knocking out C9ORF72 Exacerbates Axonal Trafficking Defects Associated with Hexanucleotide Repeat Expansion and Reduces Levels of Heat Shock Proteins. Stem Cell Reports, 14, 390–405. - PMC - PubMed
    1. AFGAN E, BAKER D, BATUT B, VAN DEN BEEK M, BOUVIER D, CECH M, CHILTON J, CLEMENTS D, CORAOR N, GRUNING BA, GUERLER A, HILLMAN-JACKSON J, HILTEMANN S, JALILI V, RASCHE H, SORANZO N, GOECKS J, TAYLOR J, NEKRUTENKO A & BLANKENBERG D 2018. The Galaxy platform for accessible, reproducible and collaborative biomedical analyses: 2018 update. Nucleic Acids Res, 46, W537–W544. - PMC - PubMed
    1. ALMEIDA S & GAO FB 2016. Lost & found: C9ORF72 and the autophagy pathway in ALS/FTD. EMBO J, 35, 1251–3. - PMC - PubMed
    1. ATANASIO A, DECMAN V, WHITE D, RAMOS M, IKIZ B, LEE HC, SIAO CJ, BRYDGES S, LAROSA E, BAI Y, FURY W, BURFEIND P, ZAMFIROVA R, WARSHAW G, ORENGO J, OYEJIDE A, FRALISH M, AUERBACH W, POUEYMIROU W, FREUDENBERG J, GONG G, ZAMBROWICZ B, VALENZUELA D, YANCOPOULOS G, MURPHY A, THURSTON G & LAI KM 2016. C9orf72 ablation causes immune dysregulation characterized by leukocyte expansion, autoantibody production, and glomerulonephropathy in mice. Sci Rep, 6, 23204. - PMC - PubMed
    1. AW E, ZHANG Y & CARROLL M 2020. Microglial responses to peripheral type 1 interferon. J Neuroinflammation, 17, 340. - PMC - PubMed

Publication types