. 2021 Jun 16;7(25):eabh1007.
doi: 10.1126/sciadv.abh1007. Print 2021 Jun.

Abrupt Heinrich Stadial 1 cooling missing in Greenland oxygen isotopes

Affiliations

Abrupt Heinrich Stadial 1 cooling missing in Greenland oxygen isotopes

Chengfei He et al. Sci Adv. .

Abstract

Abrupt climate changes during the last deglaciation have been well preserved in proxy records across the globe. However, one long-standing puzzle is the apparent absence of the onset of the Heinrich Stadial 1 (HS1) cold event around 18 ka in Greenland ice core oxygen isotope δ18 O records, inconsistent with other proxies. Here, combining proxy records with an isotope-enabled transient deglacial simulation, we propose that a substantial HS1 cooling onset did indeed occur over the Arctic in winter. However, this cooling signal in the depleted oxygen isotopic composition is completely compensated by the enrichment because of the loss of winter precipitation in response to sea ice expansion associated with AMOC slowdown during extreme glacial climate. In contrast, the Arctic summer warmed during HS1 and YD because of increased insolation and greenhouse gases, consistent with snowline reconstructions. Our work suggests that Greenland δ18 O may substantially underestimate temperature variability during cold glacial conditions.


Figures

Fig. 1
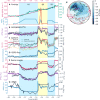
Fig. 1. Water isotope–climate evolution during the last deglaciation.
(A) Climate forcings including June solar insolation at 60°N (red), CO2 concentration (green), meltwater forcing at the Northern Hemisphere (blue) and the Southern Hemisphere (orange). ppm, parts per million. (B) Modeled (purple) and observed ice core δ18O at Greenland Ice Sheet Project 2 (GISP2) (black) (13) and GRIP (gray) (49). (C) As in (B) but for modeled (red) and reconstructed (see legends and text) temperature. (D) As in (B) but for modeled (blue) and reconstructed (black) (28) ice accumulation rate. (E) Modeled (red) and observed (black) SST at the Iberian margin. (F) Modeled (purple) and observed (black) (7) speleothem δ18Oc in Hulu Cave. (G) Modeled AMOC intensity (blue) and 231Pa/ 230Th in sediment core GGC5 as a proxy for AMOC intensity (black) (11). (H) Model global distribution of δ18O and temperature at Last Glacial Maximum (LGM). In (B, C, E, and F), the scales are the same in the model and observation but with an offset. In (D), the scale of reconstructed ice accumulation rate is 2.5 times larger than the modeled one. In (F), the modeled speleothem δ18Oc is calculated as δ18Oc = δ18O − 0.24ΔT, with ΔT as the annual temperature anomaly from LGM (18). In (H), red (green) contours represent temperature above (below) zero (counter interval, 5°C), with the white contour as 0°C. A five-decade running mean is applied to model time series.
Fig. 2
Fig. 2. Decomposition of ice core δ18O at Greenland (70° to 80°N, 50° to 30°W).
(A) Response of ice core δ18O (black, Δδ18O), decomposed into the terms from the precipitation seasonality effect (blue, ΔPs), annual mean of the isotopic composition (red, Δδ18Oann), and residual seasonality (yellow, Δδ18OPS; see Materials and Methods for the detailed definitions). (B) Δδ18Oann is further decomposed into summer [June, July, and August (JJA), solid] and winter (non-JJA, dotted) contributions. (C) Time series of total winter (September to May) precipitation (blue), surface air temperature (TS) (red) at Greenland, sea ice coverage (yellow), and SST over deep convection regions (green). (D) Same as (C) but for summer (JJA). In (B), the green stars correspond to the times of the moisture tagging experiments at LGM (20 ka), HS1 (15.5 ka), BA(13.2 ka), and YD(12.2 ka). In (C and D), deep convection is defined in the domain of 55° to 60°N, 40° to 20°W, where sea ice grows most in HS1 and YD, as shown in Fig. 3C.
Fig. 3
Fig. 3. Water isotope–climate–sea ice coherence in winter derived as first mode of MCA between δ18Owin and sea ice fraction.
(A) Normalized time expansion coefficients of the first MCA mode for δ18Owin (red), sea ice (blue), and winter SST in the deep convection region [red box in (C)]. (B) δ18Owin over Greenland regressed on the normalized time expansion coefficient of sea ice. (C to F) As in (B), but for sea ice fraction, surface air temperature, precipitation change percentage (Prcp) normalized by LGM climatology, and winter column weighted water vapor δ18Ov,win. Regression fields at 99% (P < 0.01) confidence level in two-tailed Student’s t test are plotted. In (C), the curves correspond to sea ice margin defined as the 15% sea ice fraction in the ocean at different periods (see legend). In (F), the column water vapor δ18Ov,win is weighted by the moisture in each layer. Prcp, Precipitation.

References

    1. Lynch-Stieglitz J., The Atlantic meridional overturning circulation and abrupt climate change. Ann. Rev. Mar. Sci. 9, 83–104 (2017). - PubMed
    1. Rahmstorf S., Ocean circulation and climate during the past 120,000 years. Nature 419, 207–214 (2002). - PubMed
    1. Alley R. B., Clark P. U., Keigwin L. D., Webb R. S., Making sense of millennial-scale climate change. Geophys. Monogr. Am. Geophys. Union 112, 385–394 (1999).
    1. Dansgaard W., Stable isotopes in precipitation. Tellus 16, 436–468 (1964).
    1. Böhm E., Lippold J., Gutjahr M., Frank M., Blaser P., Antz B., Fohlmeister J., Frank N., Andersen M. B., Deininger M., Strong and deep Atlantic meridional overturning circulation during the last glacial cycle. Nature 517, 73–76 (2015). - PubMed