. 2021 Jul 1;207(1):5-14.
doi: 10.4049/jimmunol.2100061. Epub 2021 Jun 16.

MHC Class II Presentation Is Affected by Polymorphism in the H2-Ob Gene and Additional Loci

Affiliations

MHC Class II Presentation Is Affected by Polymorphism in the H2-Ob Gene and Additional Loci

Emily Cullum et al. J Immunol. .

Abstract

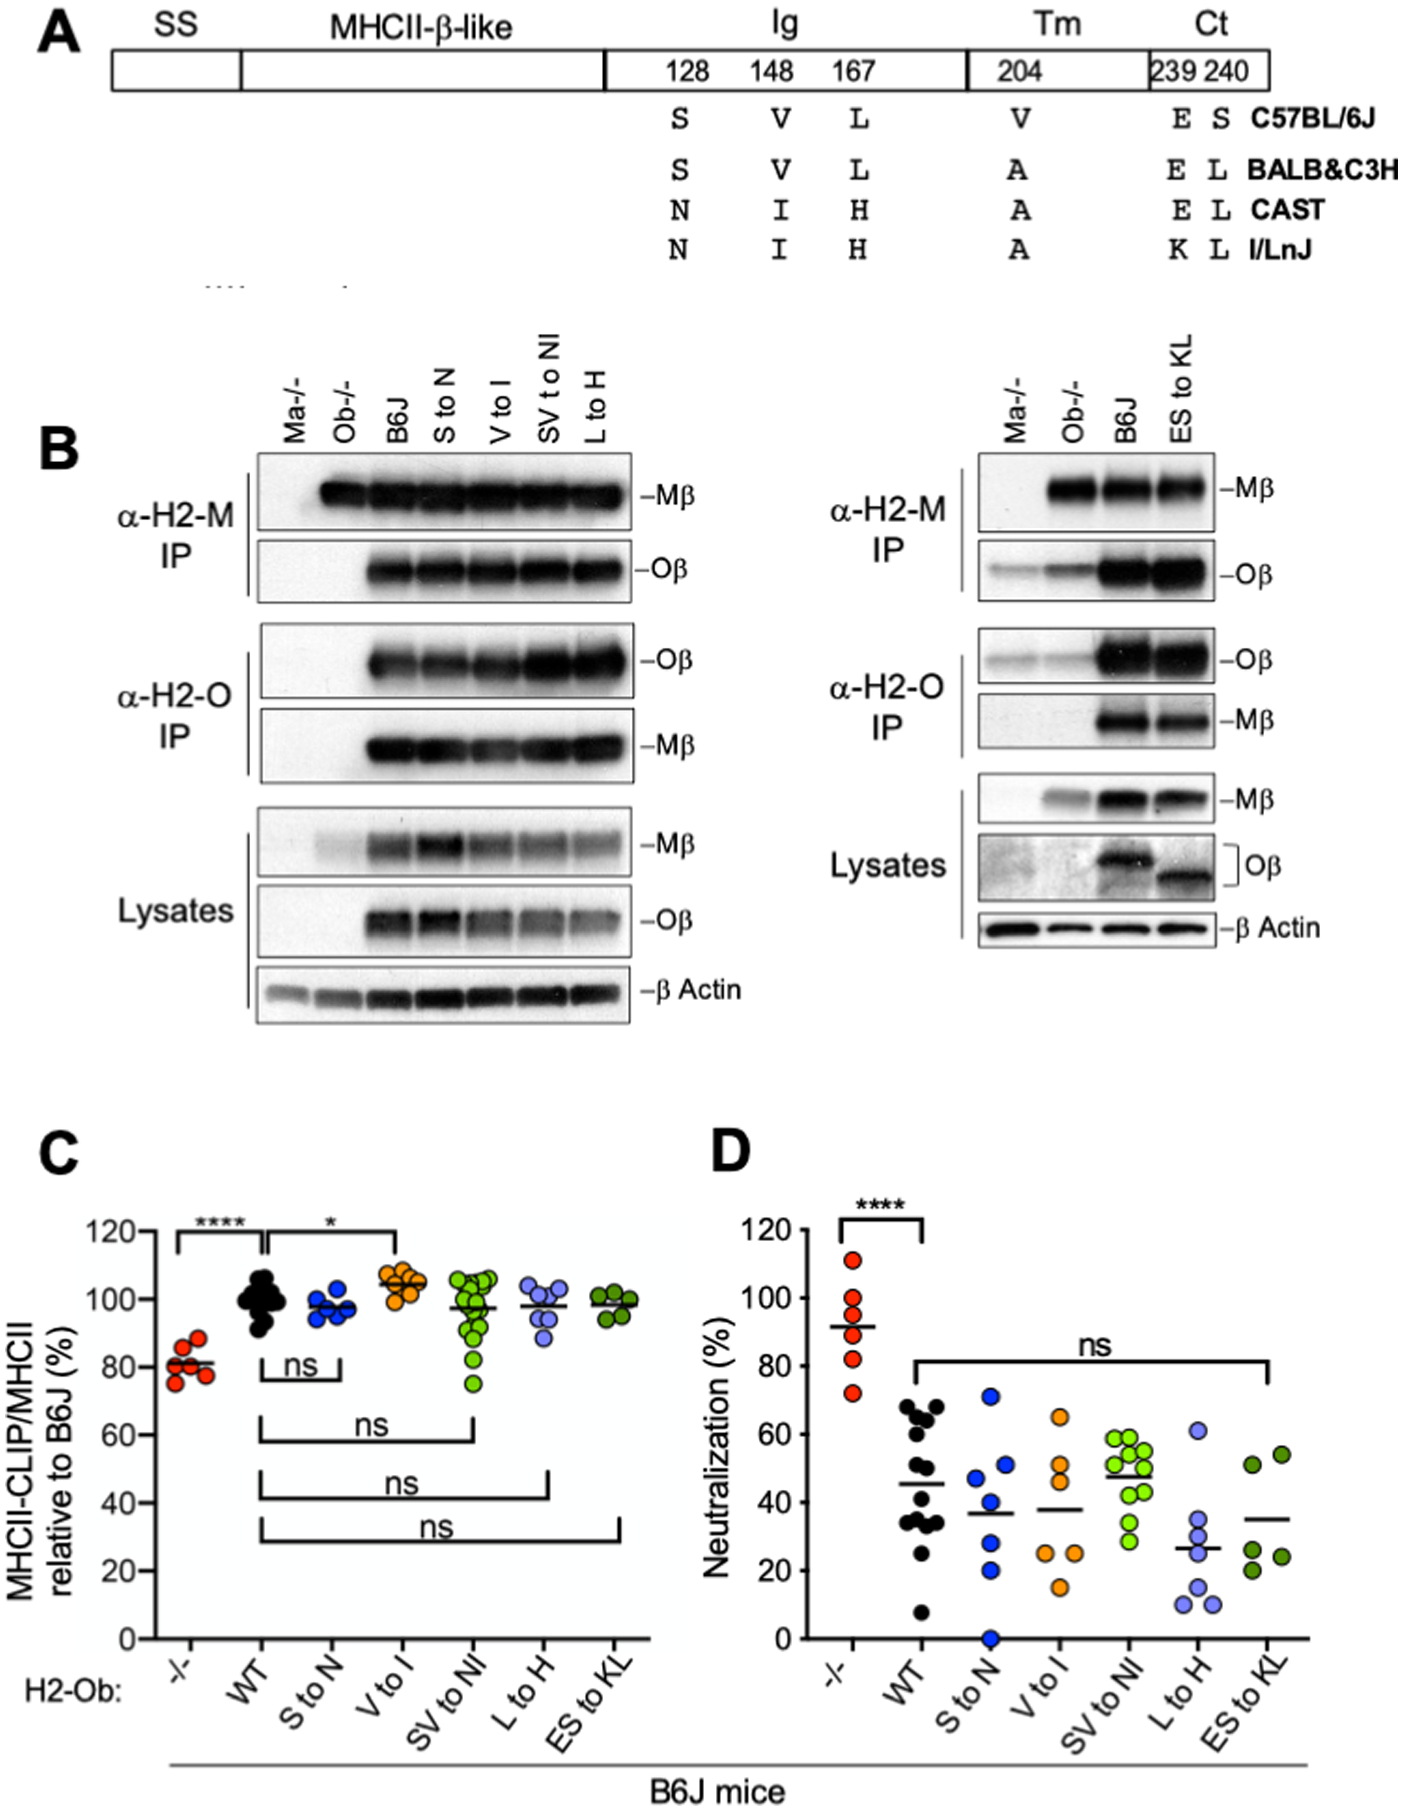
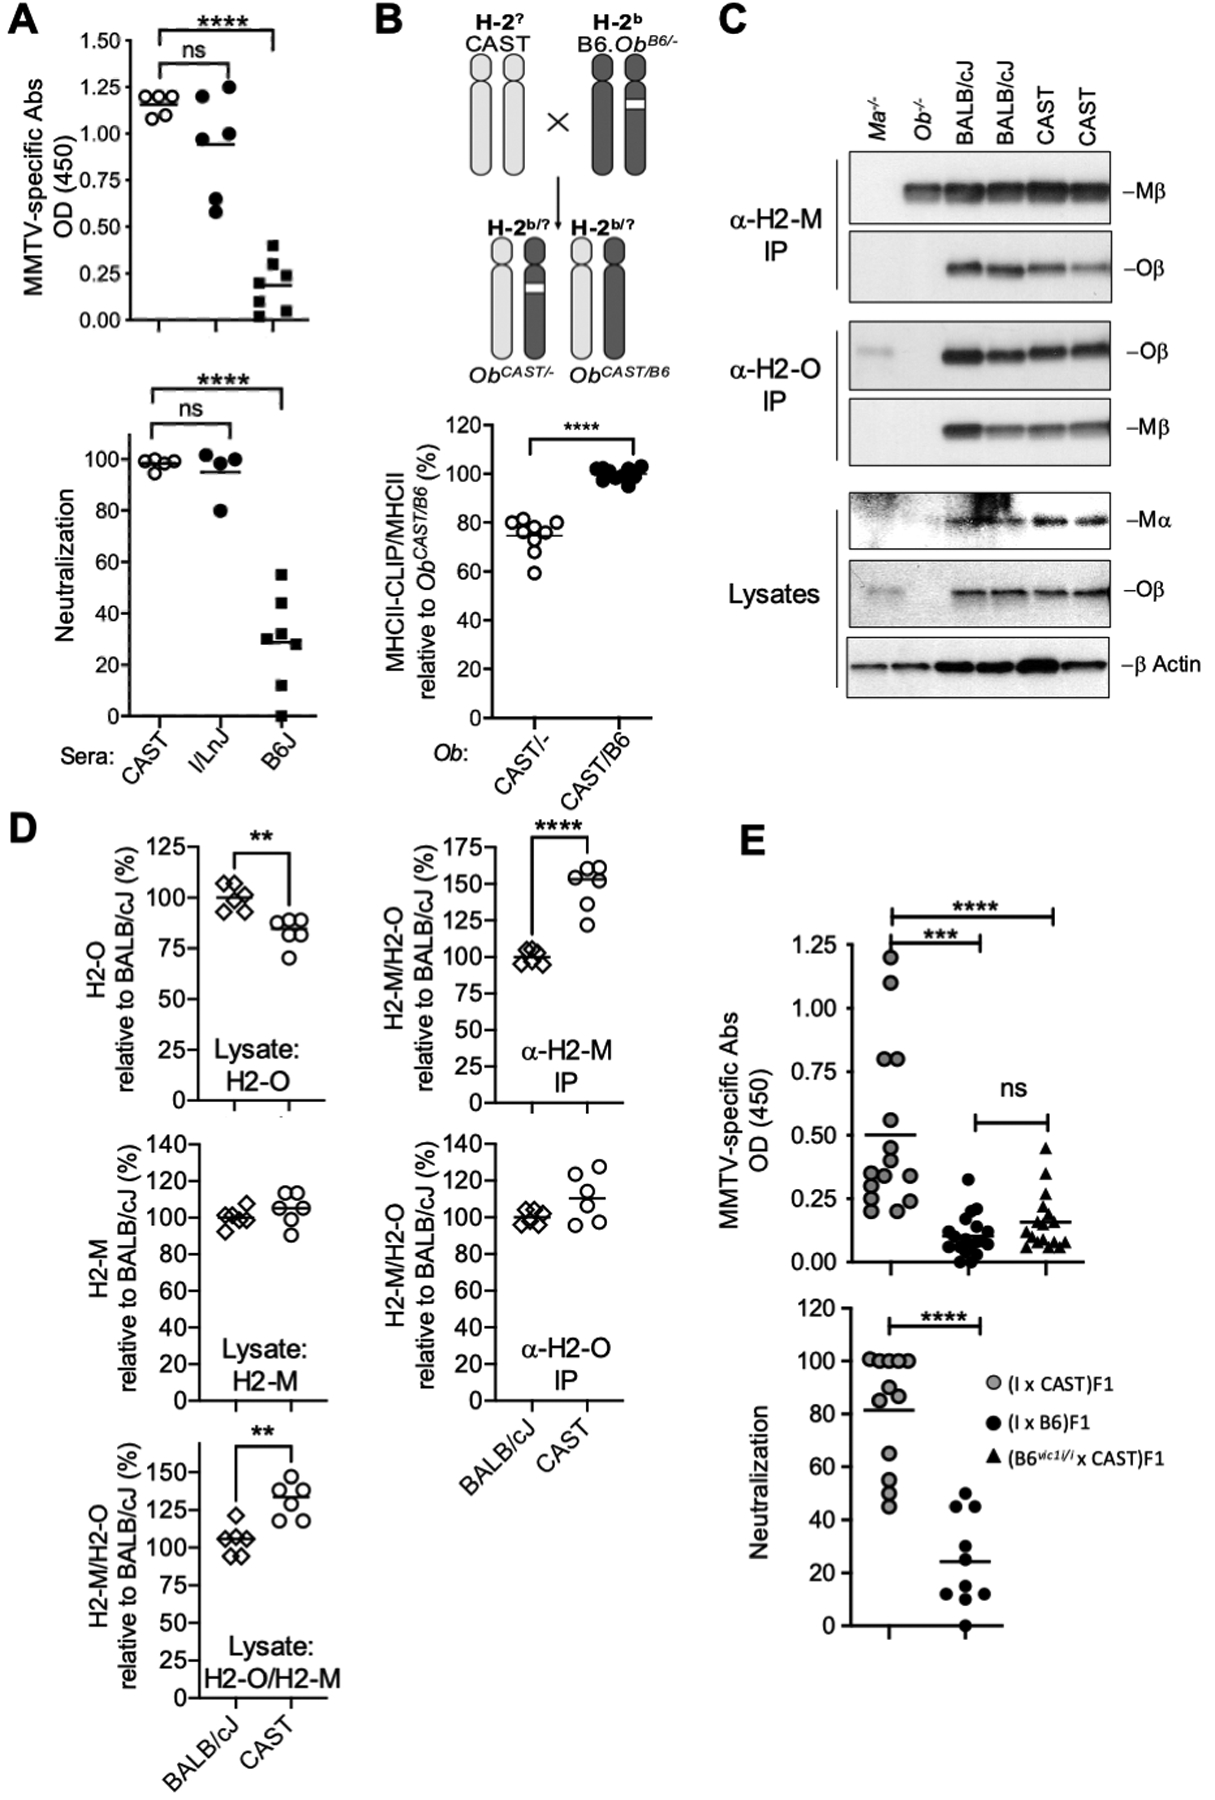
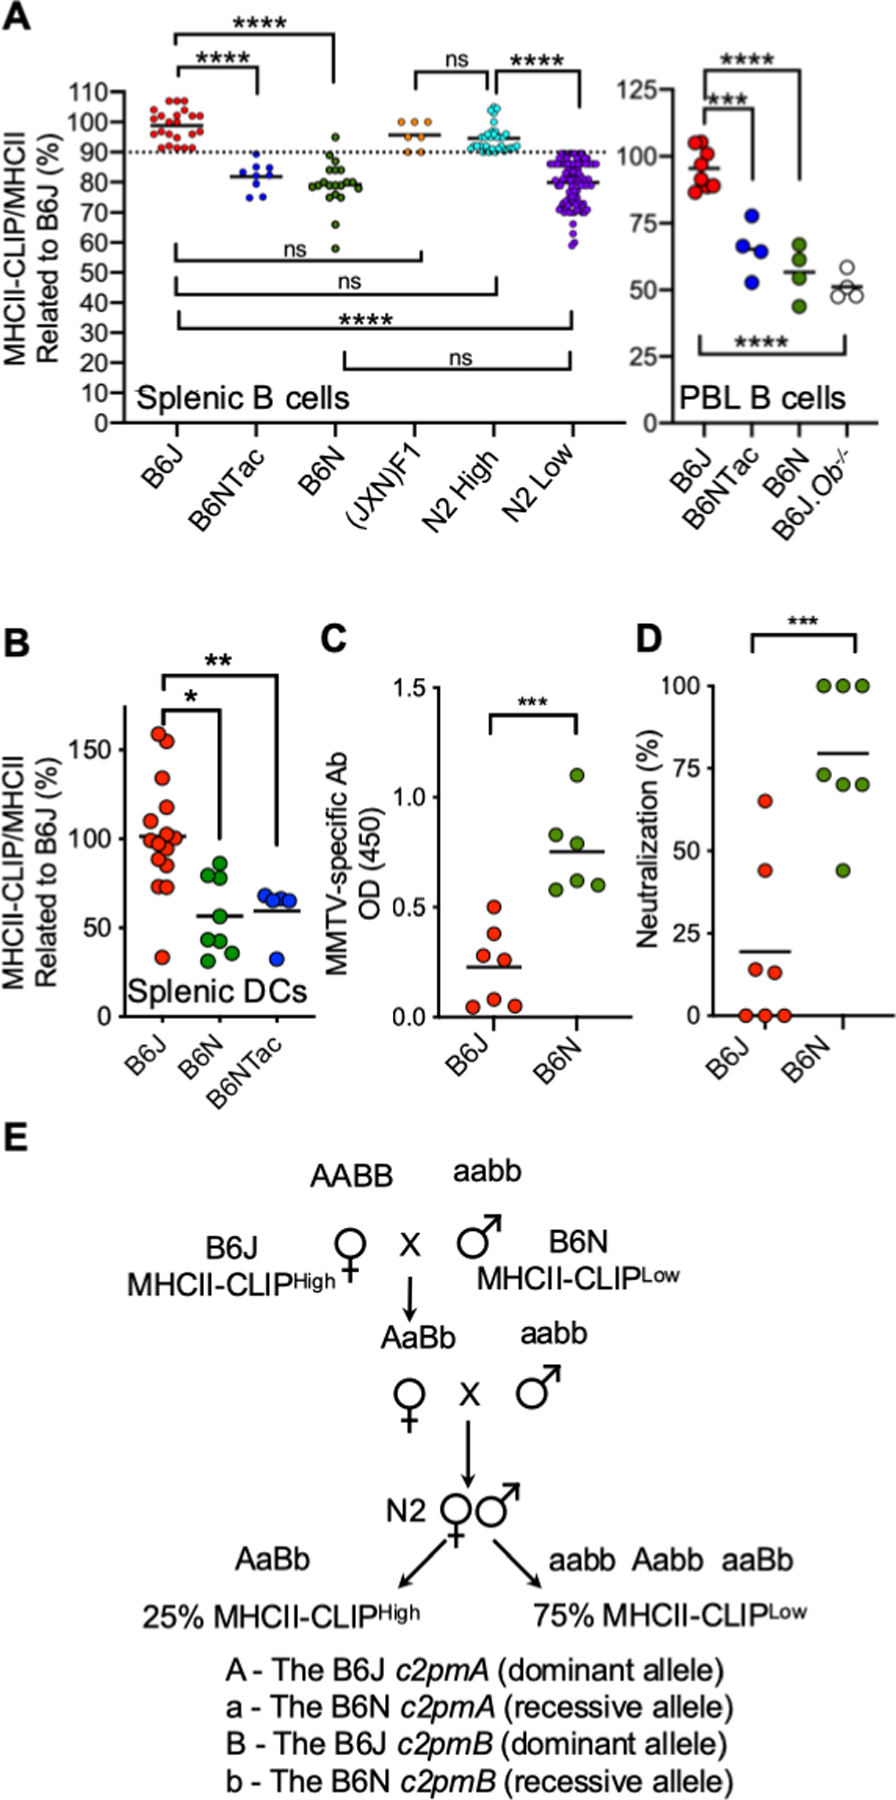
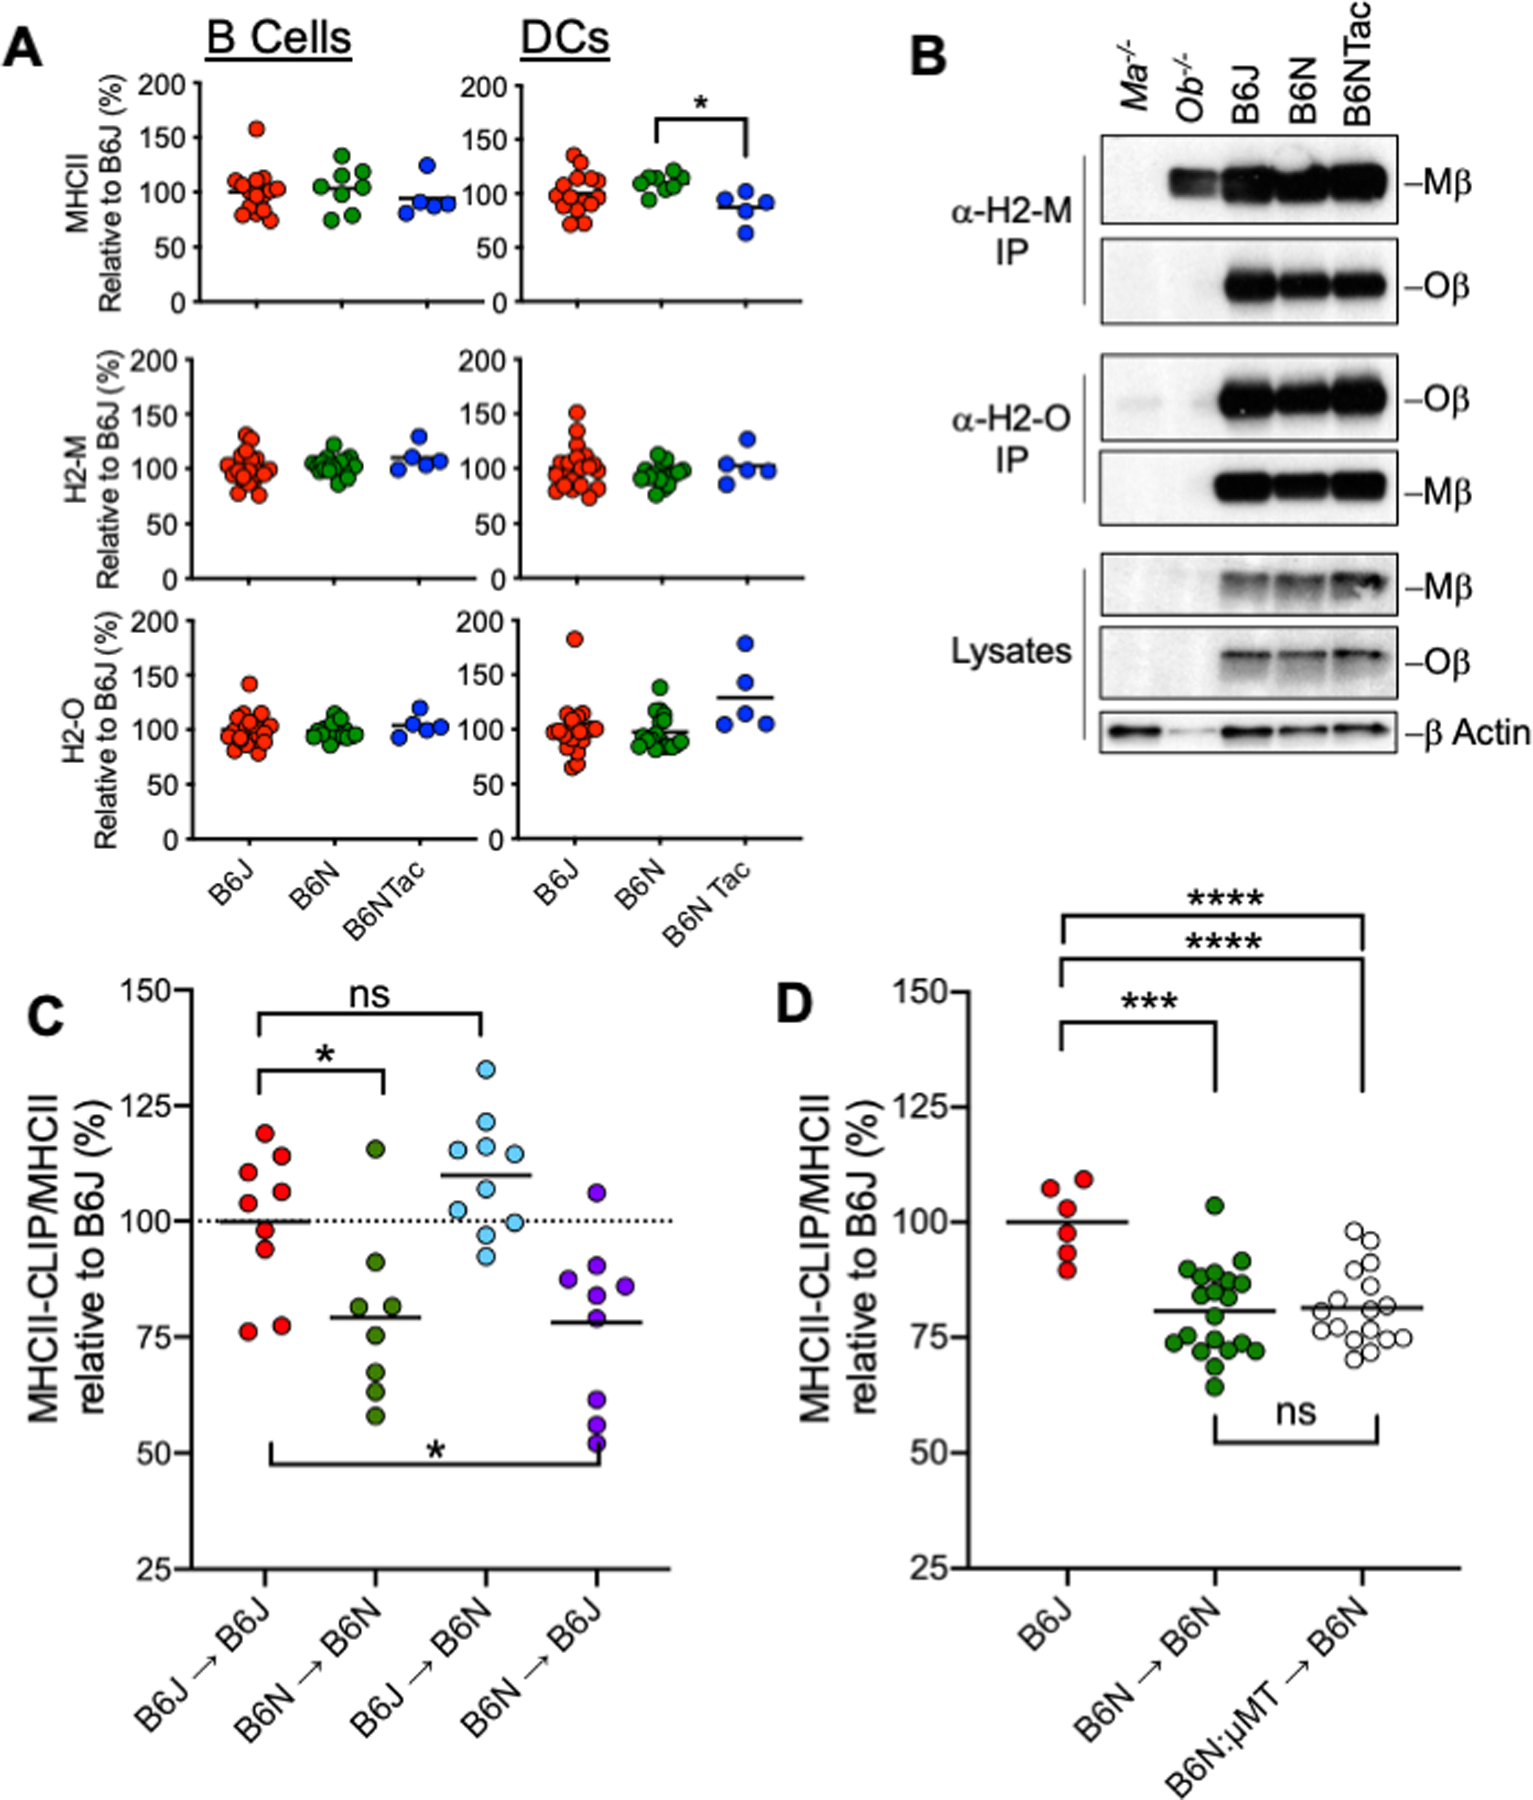
Pathogen-derived peptides are loaded on MHC class II (MHCII) and presented to CD4+ T cells for their activation. Peptide loading of MHCII occurs in specialized endosomal compartments and is controlled by the nonclassical MHCII molecules H2-M and H2-O, which are both constitutive αβ heterodimers. H2-M catalyzes MHCII peptide loading, whereas H2-O modulates H2-M activity by acting as an MHCII mimic. Recently, we discovered that the H2-Ob allele inherited by retrovirus-resistant I/LnJ mice results in nonfunctional H2-O. I/LnJ H2-O binds to but does not inhibit H2-M. Compared with H2-Oβ from virus-susceptible mice, H2-Oβ from I/LnJ mice has four unique amino acid substitutions, three in the Ig domain and one in the cytoplasmic tail. In this study we show that the three amino acids in the Ig domain of I/LnJ Oβ are critical for the H2-O inhibitory activity of H2-M. Unexpectedly, we found that MHCII presentation was significantly different in Ag-presenting cells from two closely related mouse strains, B6J and B6N, which carry identical alleles of MHCII, H2-O, and H2-M. Using a positional cloning approach, we have identified two loci, polymorphic between B6J and B6N, that mediate the difference in MHCII presentation. Collectively, these studies reveal extra complexity in MHCII/H2-M/H-2O interactions that likely involve yet to be identified modulators of the pathway.


Conflict of interest statement

Disclosures

The authors have no financial conflicts of interest.

Figures

Figure 1.
Figure 1.. Oβ proteins with single or double mutations in the Ig domain or cytoplasmic tail do not affect H2-O function.
(A) The domain structure of Oβ: SS, signal sequence; MHCII β-like, MHCII β like domain; Ig, immunoglobulin domain; Tm, transmembrane domain; Ct, cytoplasmic tail. Also shown: AA substitutions (and their positions) found in Oβ from various mice compared to Oβ of B6 mice. (B) Oβ and Mβ protein levels and H2-M/H2-O interactions in Ob.KI mice. H2-M or H-2O captured by immunoprecipitation from lysates of purified B6J, B6J.Ob S to N, B6J.Ob V to I, B6J.Ob SV to NI, B6J.Ob L to H, and B6J.Ob ES to KL splenic B cells were analyzed by western blotting with Abs specific for the Ct of Mβ and Oβ (left panel) or the Ct of Mβ and Oβ luminal domain (right panel) and also for β-actin (loading control). Purified B6J.Ma−/− and B6J.Ob−/− B cells were used as controls. Data are representative of 4 (left panel) and 4 (right panel) independent experiments. See Supplemental Figure 2 for quantification of results across all experiments. (C) Comparison of MHCII-CLIP levels on B cells of Ob.KI mice. Quantification of the geometric mean fluorescence intensity (gMFI) of I-Ab-CLIP on B cells, defined as CD19+ from homozygous Ob KI mice relative to that obtained for control WT (WT/WT and WT/KI) B6J B cells. To correct for small differences in total MHCII levels among different samples, the ratio of MHCII-CLIP:(total) MHCII was calculated by dividing the gMFI obtained for MHCII-CLIP by that obtained for MHCII for each sample. Graphs show quantification of the gMFI of MHCII-CLIP/MHCII for mice from the indicated strains relative to that obtained for B6J mice. Dots represent individual mice. The data are combined from multiple independent experiments. Horizontal lines indicate the mean of values obtained for each group of mice. (D) Mice with indicated genotypes were infected with MMTV at 8 weeks of age (via i.p. injection) and their sera were screened for capacity to neutralize virus at 3 months post-infection. Neutralization (%) was calculated as described in (5). Dots represent individual mice. Horizontal lines indicate the mean of values obtained for different mice from the same group. Significance was calculated using an unpaired t test. ****=p ≤0.0001; *=p≤ 0.05.
Figure 2.
Figure 2.. Identification of the combination of mutations within the immunoglobulin domain of Oβ that result in the loss-of-function H2-O.
(A) Similar to I/LnJ mice, MMTV-infected CAST mice produce virus-neutralizing Abs. CAST mice were infected with MMTV at 8 weeks of age (via i.p. injection), and their sera were screened for anti-virus IgGs (top panel) and for virus neutralization 3 months post-infection (bottom panel). OD 450, absorbance at 450 nm. Each symbol represents an individual mouse. Horizontal lines indicate the mean of values obtained for mice from the same group. (B) Like I/LnJ mice, CAST mice inherit loss-of-function H2-O. (B, top panel) Genetic cross to produce H-2?/b ObCAST/- and H-2?/bObCAST/B6 F1 mice, the CAST MHC haplotype is unknown. (B, bottom panel) Quantification of the gMFI of MHCII-CLIP on B cells, identified as CD19+ from F1.ObCAST/- mice relative to that obtained for F1.ObCAST/B6 B cells. To correct for small differences in total MHCII levels among different samples, the ratio of MHCII-CLIP:(total) MHCII was calculated by dividing the gMFI obtained for MHCII-CLIP by that obtained for MHCII for each sample. Graphs show quantification of the gMFI of MHCII-CLIP/MHCII for mice from both groups relative to that obtained for F1.ObCAST/B6 mice. Each symbol represents an individual mouse. Data are combined from two independent experiments. Horizontal lines indicate the mean of values obtained for each group of mice. (C) H2-O and H2-M protein levels and H2-M/H2-O interactions in CAST mice. H2-M or H2-O captured by immunoprecipitation from lysates of purified BALB/cJ and CAST splenic B cells were analyzed by western blotting with Abs specific for the Ct of Mβ and Oβ. Purified B6J.Ma−/− and B6J.Ob−/− B cells were used as controls. Total lysates were also probed by western blotting with Abs specific for Mα, the Ct of Oβ and β-actin (loading control). BALB/cJ and CAST Oβ proteins have identical Cts allowing for the use of Oβ Ab reagents specific for the Ct to perform these analyses. Data are representative of three independent experiments comprised of 2 BALB/cJ and 2 CAST mice each. (D) Quantification of total H2-O (top left) and H2-M (middle left) protein levels, the ratio of H2-M to H2-O (bottom left) in B cell lysates and H2-M:H2-O ratios measured after immunoprecipitation with H2-M (top right), or H2-O (bottom right) across the three independent experiments. Data are normalized to the levels obtained for BALB/cJ mice (see Materials and Methods for details). Each symbol represents an individual mouse and horizontal bars represent the mean of values obtained for different mice of the same group. (E) Newborn mice from the indicated crosses were fostered by MMTV(LA)-infected mothers. Four months post infection, mice were confirmed to be infected by measuring deletion of SAg-cognate T cells and were screened for anti-virus Abs by ELISA (top panel) and neutralization of MMTV (bottom panel). OD 450, absorbance at 450 nm. Neutralization (%) was calculated as described in (5). Results are expressed as mean of OD (top panel) or as mean of percent of neutralization (bottom panel) produced by sera from uninfected mice of the same cross. Significance was calculated using unpaired t tests. ****=p ≤0.0001, ***=P ≤ 0.001, **=P ≤ 0.01.
Figure 3.
Figure 3.. Low MHCII-CLIP levels on B cells and dendritic cells of B6N mice correlates with their ability to produce virus-neutralizing antibodies.
(A) Comparison of MHCII-CLIP levels on splenic B cells of B6N, B6J, F1, and N2 mice (left) and on B cells among peripheral blood lymphocytes (PBLs) (right). F1, mice obtained from crossing B6J to B6N mice. N2, mice obtained from backcrossing F1 mice to B6N mice. N2 mice were analyzed in groups (~10–20 mice per group) at 8 weeks of age along with age-matched B6J mice (3–5 mice per group) and their splenic B cells, identified as CD19+ were stained with 15G4 (MHCII-CLIP) or M5/114 (total MHCII). To correct for small differences in total MHCII levels among different samples, the ratio of MHCII-CLIP:(total) MHCII was calculated by diving the gMFI obtained for MHCII-CLIP by that obtained for MHCII for each sample. The averaged MHCII-CLIP/MHCII gMFI obtained for B6J mice was defined as 100%. Data for all mice are expressed as % of B6J gMFI. The values for B6J mice ranged from 91.4% to 107% (mean ± SD= 98.8 ± 5.3). The values for B6N ranged from 58% – 95% (mean ± SD= 79.3 ± 7.8). The values for (B6JxB6N)F1 mice ranged from 90%–110% (mean ± SD= 95.6 ± 4.5). With an arbitrary cut off at 90% (dotted line) all N2 MHCII-CLIPHIGH were at ≥ 90% and all N2 MHCII-CLIPLow are at ≤89.5% relative to B6J mice. The range of N2 MHCII-CLIPHigh was 90% – 105% (mean ± SD= 94.6 ± 4.4), whereas the range of N2 MHCII-CLIPLow was 59% – 89.5% (mean ± SD= 79.9±7.2). Dots represent individual mice. Horizontal lines indicate the mean of values obtained for different mice from the same group. (B) Quantification of the gMFI of Ab-CLIP on the cell surface of splenic DCs from mice of indicated strains and crosses. To correct for small differences in total MHCII levels among different samples, the ratio of MHCII-CLIP:(total) MHCII was calculated by dividing the gMFI obtained for MHCII-CLIP by that obtained for MHCII for each sample. Graphs show quantification of the gMFI of MHCII-CLIP/MHCII for mice from indicated strains/crosses relative to that obtained for B6J mice. B cells were defined as CD19+ and DCs as CD3 CD19 CD11c+. Dots represent individual mice. Horizontal lines indicate the mean of values obtained for each group of mice. (C) Unlike B6J mice, MMTV-infected B6N mice produce potent virus-neutralizing Abs. B6N and B6J mice were infected with MMTV at 8 weeks of age and screened for anti-virus IgGs 3 months later. OD 450, absorbance at 450 nm. Dots represent individual mice. Horizontal lines indicate the mean of values obtained for different mice from the same group (D) Sera from mice (shown in C) were tested for virus neutralization. Dots represent individual mice. Horizontal lines indicate the mean of values obtained for different mice form the same group. (E) Genetic cross used to produce N2 mice for c2pmA and c2pmB mapping.
Figure 4.
Figure 4.. c2pmA and c2pmB are expressed in the bone marrow compartment and function in B cells.
(A) MHCII, H2-M, and H2-O levels are similar in B6J, B6N, and B6Tac B cells and DCs. Splenic B cells were surface stained with fluorochrome labeled mAbs to identify B cells (CD3- CD11c- CD19+) or DCs (CD3- CD19- CD11c+) and for MHCII followed by fixation and permeabilization and intracellular staining with fluorochrome labeled mAbs specific for H2-O (mAb Mags.Ob3) and H2-M (mAb 2C3A) (see Supplemental Figure 3). Graphs show quantification of the geometric mean fluorescence intensity (gMFI) of MHCII, H2-O, or H2-M in indicated strains of mice relative to that obtained for B6J. Horizontal lines indicate the mean of values obtained for different mice from the same group. Dots represent individual mice. Data were combined from two (MHCII) or 3 (H2-O and H2-M) similar experiments. (B) c2pmA and c2pmB do not alter levels of H2-M, H2-O or MHCII. H2-M or H2-O captured by immunoprecipitation from lysates of purified B6J, B6N and B6NTac, B6J.Ob−/− or B6JMa−/− splenic B cells were analyzed by blotting with Abs specific for the cytoplasmic tails of Mβ or Oβ or β-actin. Blotting of lysates used for the IPs are included as controls. Data are representative of 2 similar experiments. See Supplemental Figure 3C for quantification of cumulative data. (C) c2pmA and c2pmB are expressed in cells of the bone marrow origin. Six-week-old B6J or B6N recipient mice were lethally irradiated and reconstituted with lin donor B6J or B6N BM. Nine weeks post-transplantation the levels of MHCII and MHCII-CLIP were measured on the surface of CD19+ splenic B cells from the chimeric mice. To correct for small differences in total MHCII levels among different samples, the ratio of MHCII-CLIP:(total) MHCII was calculated by dividing the gMFI obtained for MHCII-CLIP by that obtained for MHCII for each sample. Graphs show quantification of the gMFI of MHCII-CLIP/MHCII for mice from different groups relative to that obtained for B6J mice. Dots represent individual mice. Horizontal lines indicate the mean of values obtained for different mice from the same group. Data were pooled from two independent experiments. (D) c2pmA and c2pmB function in B cells. Six-week-old B6N recipient mice were lethally irradiated and reconstituted with lin donor B6N (control) BM or a 50:50 mix of lin BM from B6J.μMT (B-less mice) and B6N BM. Twelve weeks post-transplantation the levels of MHCII and MHCII-CLIP were measured on the surface of CD19+ peripheral blood B cells or splenic B cells (Supplemental Figure 4) from the chimeric mice. To normalize each sample’s MHCII-CLIP level to this sample’s level of MHCII, the gMFI obtained for 15G4 (MHCII-CLIP) was divided by the gMFI obtained for M5/114 (MHCII). Graphs show quantification of the gMFI of MHCII-CLIP/MHCII for mice from different groups relative to that obtained for B6J mice. Data were pooled from two independent transplantation experiments. Dots represent individual mice. Horizontal lines indicate the mean of values obtained for different mice of the same group. Significance was calculated using an unpaired t test. ***=p ≤0.001; ****=p ≤0.0001.

Similar articles

Cited by

References

    1. Purdy A, Case L, Duvall M, Overstrom-Coleman M, Monnier N, Chervonsky A, and Golovkina T. 2003. Unique resistance of I/LnJ mice to a retrovirus is due to sustained interferon gamma-dependent production of virus-neutralizing antibodies. J Exp Med 197: 233–243. - PMC - PubMed
    1. Case LK, Petell L, Yurkovetskiy L, Purdy A, Savage KJ, and Golovkina TV. 2008. Replication of beta- and gammaretroviruses is restricted in I/LnJ mice via the same genetic mechanism. Journal of virology 82: 1438–1447. - PMC - PubMed
    1. Kane M, Case LK, and Golovkina TV. 2011. Vital role for CD8+ cells in controlling retroviral infections. Journal of virology 85: 3415–3423. - PMC - PubMed
    1. Case LK, Purdy A, and Golovkina TV. 2005. Molecular and cellular basis of the retrovirus resistance in I/LnJ mice. J Immunol 175: 7543–7549. - PubMed
    1. Denzin LK, Khan AA, Virdis F, Wilks J, Kane M, Beilinson HA, Dikiy S, Case LK, Roopenian D, Witkowski M, Chervonsky AV, and Golovkina TV. 2017. Neutralizing Antibody Responses to Viral Infections Are Linked to the Non-classical MHC Class II Gene H2-Ob. Immunity 47: 310–322 e317. - PMC - PubMed

Publication types