. 2021 Jun 16;12(1):3653.
doi: 10.1038/s41467-021-23939-7.

Sensitive period for rescuing parvalbumin interneurons connectivity and social behavior deficits caused by TSC1 loss

Affiliations

Sensitive period for rescuing parvalbumin interneurons connectivity and social behavior deficits caused by TSC1 loss

Clara A Amegandjin et al. Nat Commun. .

Abstract

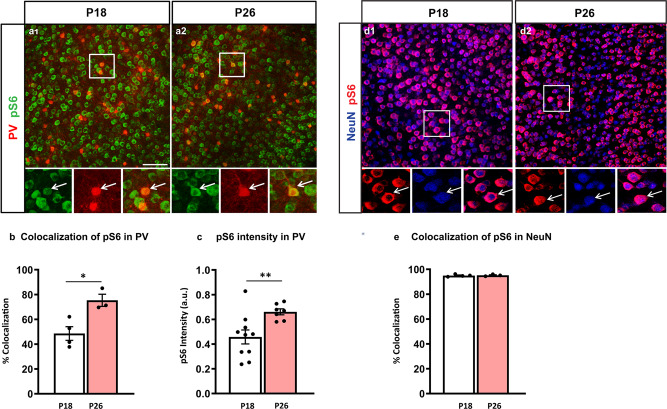
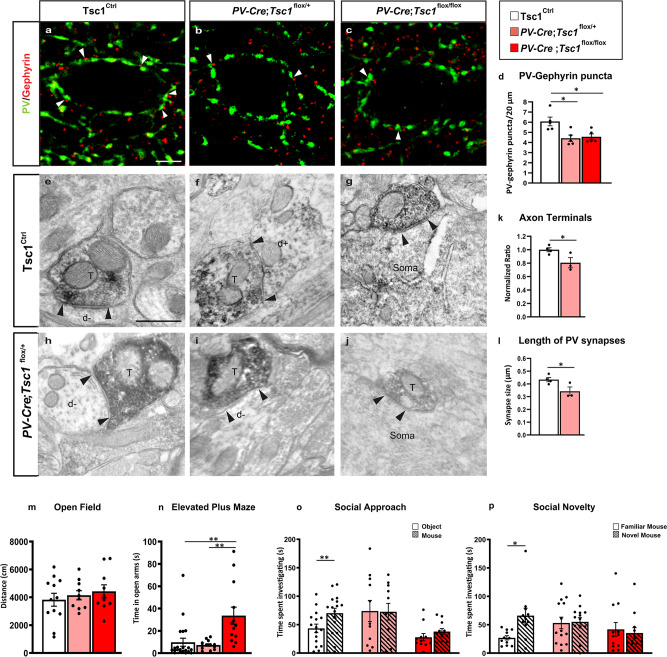
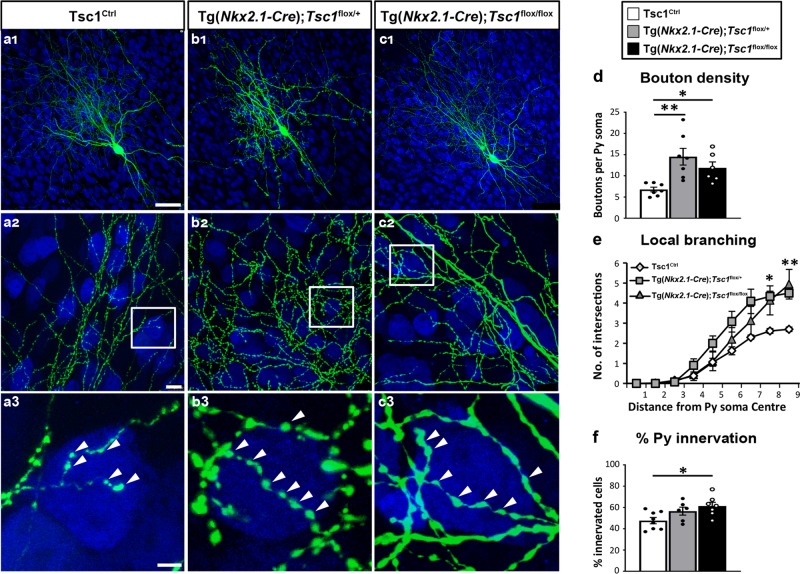
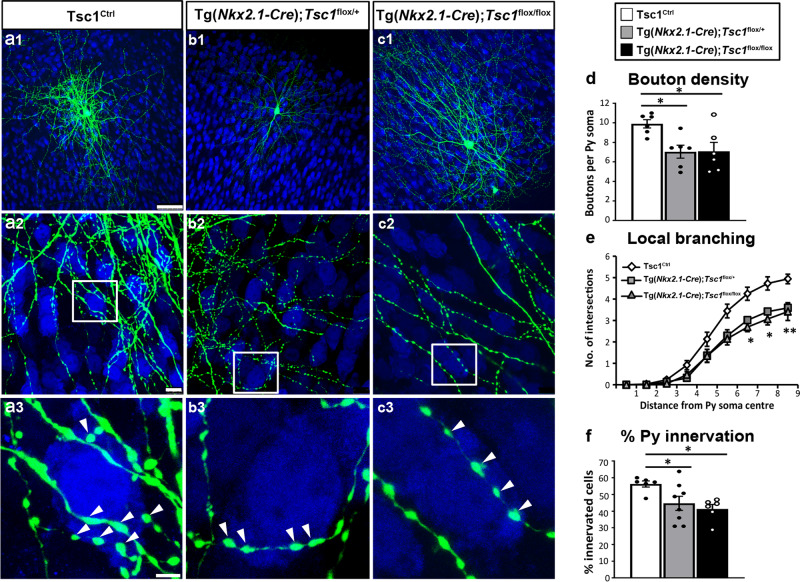
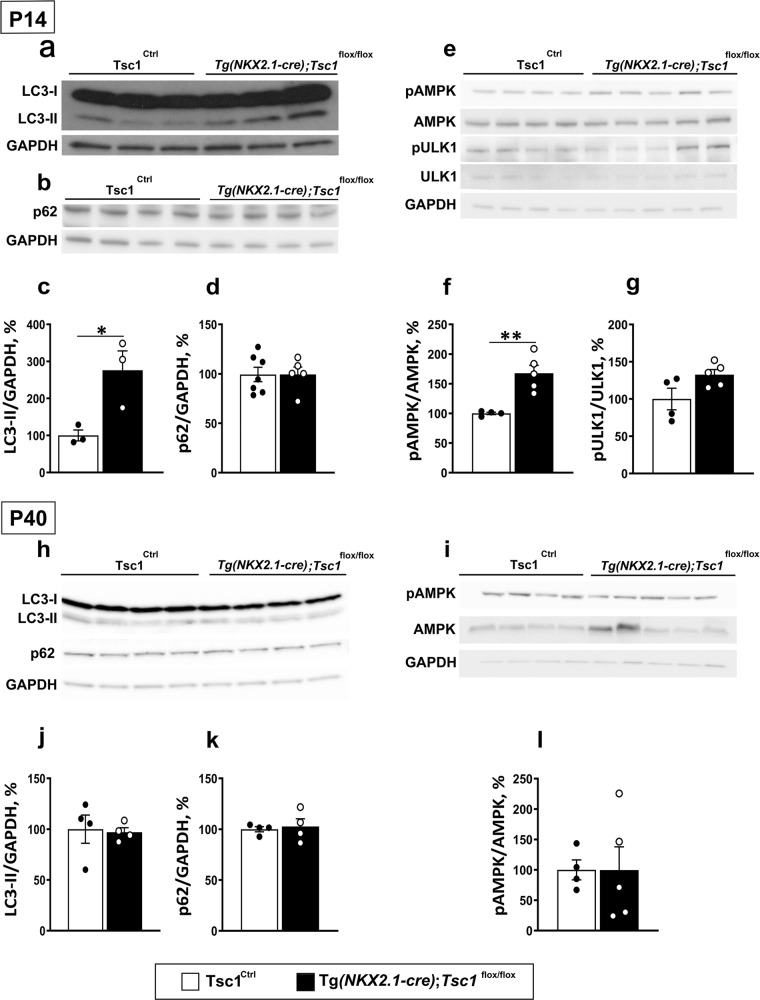
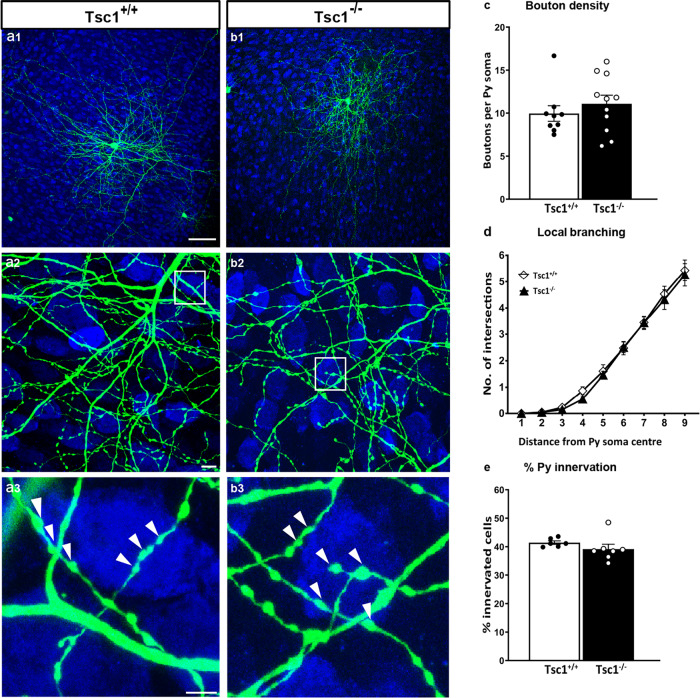
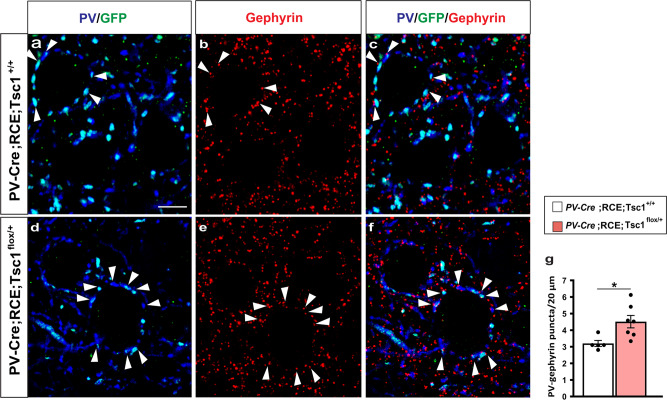
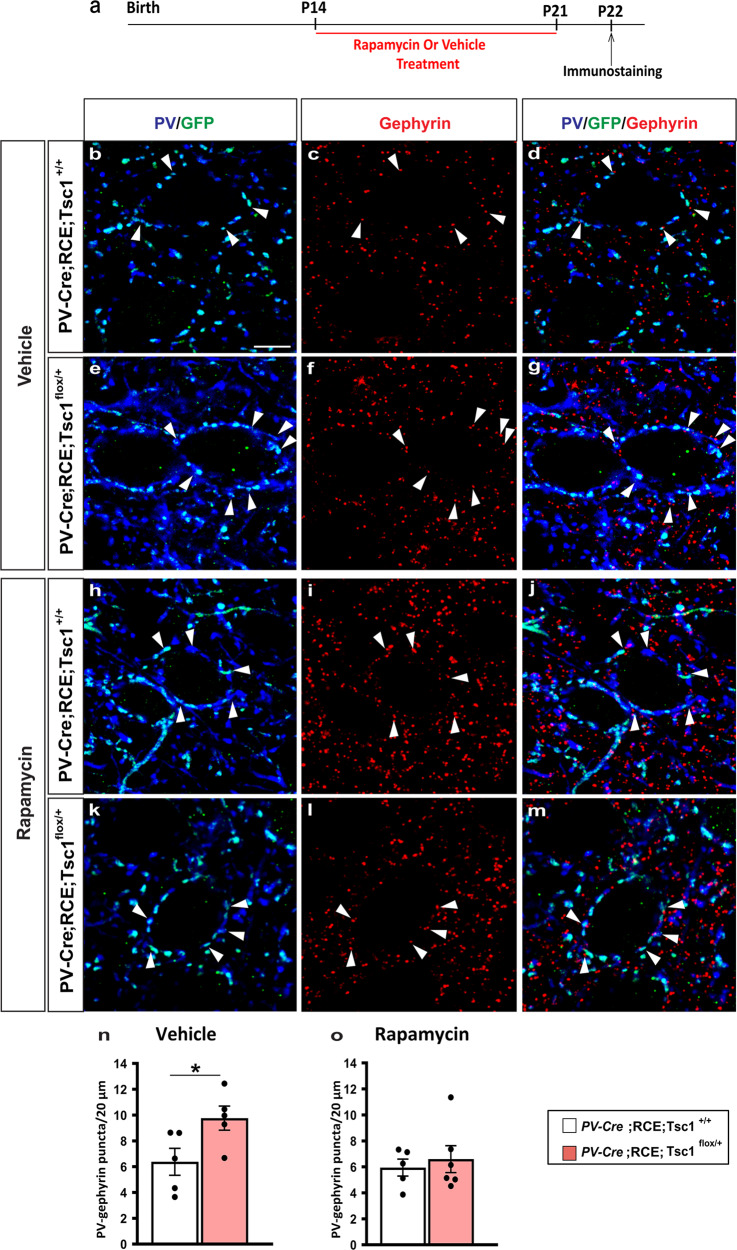
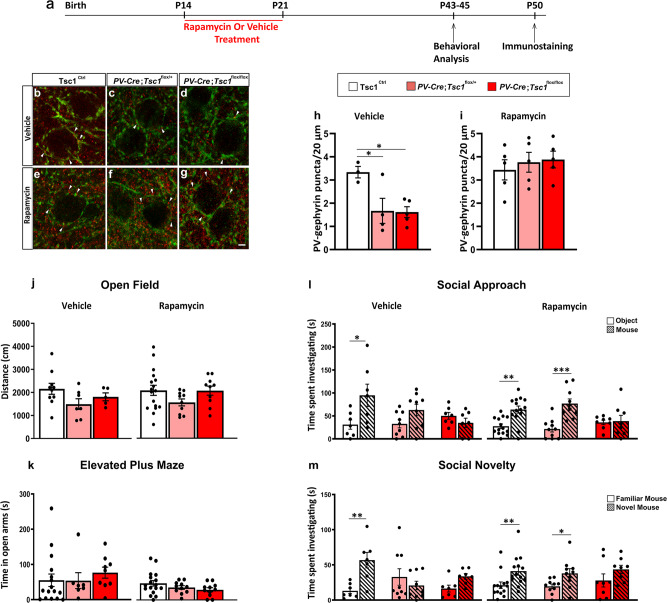
The Mechanistic Target Of Rapamycin Complex 1 (mTORC1) pathway controls several aspects of neuronal development. Mutations in regulators of mTORC1, such as Tsc1 and Tsc2, lead to neurodevelopmental disorders associated with autism, intellectual disabilities and epilepsy. The correct development of inhibitory interneurons is crucial for functional circuits. In particular, the axonal arborisation and synapse density of parvalbumin (PV)-positive GABAergic interneurons change in the postnatal brain. How and whether mTORC1 signaling affects PV cell development is unknown. Here, we show that Tsc1 haploinsufficiency causes a premature increase in terminal axonal branching and bouton density formed by mutant PV cells, followed by a loss of perisomatic innervation in adult mice. PV cell-restricted Tsc1 haploinsufficient and knockout mice show deficits in social behavior. Finally, we identify a sensitive period during the third postnatal week during which treatment with the mTOR inhibitor Rapamycin rescues deficits in both PV cell innervation and social behavior in adult conditional haploinsufficient mice. Our findings reveal a role of mTORC1 signaling in the regulation of the developmental time course and maintenance of cortical PV cell connectivity and support a mechanistic basis for the targeted rescue of autism-related behaviors in disorders associated with deregulated mTORC1 signaling.


Conflict of interest statement

The authors declare no competing interests.

Figures

Fig. 1
Fig. 1. pS6 expression levels increase specifically in PV cells between the second and fourth postnatal weeks.
a Coronal sections of mouse somatosensory cortex immunostained for pS6 (green) and PV (red) at P18 (a1) and P26 (a2). b Number of PV cells expressing detectable levels of pS6 increases during the second to fourth postnatal week (Welch’s t-test, *p = 0.0152). Number of mice; P18, n = 4; P26, n = 3. c Mean pS6 intensity in individual PV cells is significantly higher at P26 than at P18 (Welch’s t-test, **p = 0.0061). Number of mice; P18, n = 10; P26 n = 7. d Coronal sections of mouse somatosensory cortex immunostained for pS6 (red) and NeuN (blue) at P18 (d1) and P26 (d2). e Percentage of colocalization of pS6 and NeuN is not significantly different between the two developmental ages (Welch’s t-test, p = 0.7663). Number of mice; P18, n = 4; P26, n = 3. Scale bars in a1-a2, d1-d2, 75 µm. Data represent mean ± SEM. Source data are provided as a Source Data file.
Fig. 2
Fig. 2. Tsc1 knockout in PV cells causes PV cell hypo-connectivity and social behavioral deficits in young adult mice.
ac Somatosensory cortex coronal sections immunostained for PV (green) and gephyrin (red) from P60 Tsc1Ctrl (a), PV-Cre;Tsc1flox/+ (b), and PV-Cre;Tsc1flox/flox mice (c). White arrowheads indicate PV-gephyrin colocalized boutons. d PV/gephyrin colocalized puncta (one-way ANOVA, *p = 0.0096; Tukey’s multiple comparisons test: Tsc1Ctrl vs PV-Cre;Tsc1flox/+ *p = 0.0140; Tsc1Ctrl vs PV-Cre;Tsc1flox/flox *p = 0.0236), n = 5 mice for all genotypes. Scale bar: 10 µm. e-j PV-immunolabeled axon terminals in somatosensory cortex of Tsc1Ctrl (e, f, g) and PV-Cre;Tsc1flox/+ (h, i, j) mice. eg PV + axon terminals (T) make symmetric synaptic contact (flanked by arrowheads) with an unlabeled dendritic shaft (d−). f Rare symmetric synapse between PV + axon terminal and PV + dendrite (d+). g, j Synaptic contact between a PV + axon terminal (T) and an unlabeled cell soma. k Quantification of PV + axon terminals in PV-Cre;Tsc1flox/+ mice (Unpaired t-test, *p = 0.0453). l PV-Cre; Tsc1flox/+ mice have shorter synapses than Tsc1Ctrl (Unpaired t test, *p = 0.0464). Number of mice: Tsc1Ctrl n = 4; PV-Cre;Tsc1flox/+ n = 3. Scale bars: ej, 500 nm. m Open field test: distance traveled during exploratory activity in an open field arena (one-way ANOVA, p > 0.05; Tukey’s multiple comparisons test: Tsc1Ctrl vs PV-Cre;Tsc1flox/+ p = 0.8537; Tsc1Ctrl vs PV-Cre;Tsc1flox/flox p = 0.5794; PV-Cre;Tsc1flox/+ vs PV-Cre;Tsc1flox/flox p = 0.8956). Number of mice: Tsc1Ctrl n = 12; PV-Cre;Tsc1 flox/+ n = 10; PV-Cre;Tsc1flox/flox n = 10. n Elevated plus maze: Quantification of time spent in the open arms of elevated plus maze arena (one-way ANOVA, ***p = 0.0006; Tukey’s multiple comparisons test: Tsc1Ctrl vs PV-Cre;Tsc1flox/+ p = 0.9205; Tsc1Ctrl vs PV-Cre;Tsc1flox/flox **p = 0.0017; PV-Cre;Tsc1flox/+ vs PV-Cre;Tsc1flox/flox **p = 0.0018). Number of mice: Tsc1Ctrl n = 21; PV-Cre;Tsc1flox/+ n = 13; PV-Cre;Tsc1flox/flox n = 13. o, p Unlike Tsc1Ctrl mice, both PV-Cre;Tsc1flox/+ and PV-Cre;Tsc1flox/flox mice failed to show preference for a mouse vs an object (o) (two-way ANOVA, Fgenotype (2, 35) = 3.968 p = 0.0280, Ftime (1, 35) = 4.593 p = 0.0391, Fgenotype*time (2, 35) = 2.376 p = 0.1077; **p = 0.0089, Sidak’s multiple comparisons test) or for a novel mouse vs a familiar one (p) (two-way ANOVA, Fgenotype (2, 34) = 1.108 p = 0.3418, Ftime (1, 34) = 2.640 p = 0.1134, Fgenotype*time (2, 34) = 3.615 p = 0.0377; *p = 0.0147, Sidak’s multiple comparisons test); Number of mice: o Tsc1Ctrl n = 16; PV-Cre;Tsc1flox/+ n = 11; PV-Cre;Tsc1flox/flox n = 11. p Tsc1Ctrl n = 11; PV-Cre;Tsc1flox/+ n = 14; PV-Cre;Tsc1flox/flox n = 12. Data represent mean ± SEM. Source data are provided as a Source Data file.
Fig. 3
Fig. 3. Tsc1 knockout in single PV neurons causes a premature increase in axonal terminal branching and bouton density followed by excessive pruning.
a1 EP18 Tsc1+/+ PV cell showing characteristic branching (a2) and boutons (a3, arrowheads) on the postsynaptic somata identified by NeuN immunostaining (blue). b Tsc1−/− PV cells lacking both alleles (b1b3) of Tsc1 show significant increase in bouton density at EP18. c Control EP34 Tsc1+/+ PV cell. d1d3 EP34 Tsc1−/− PV cell showing significantly decreased axonal branching (c2 vs d2) and perisomatic boutons (c3 vs d3). e Tsc1−/− PV cells show an increase in bouton density at EP18 (Welch’s t-test, ****p < 0.0001) followed by a decrease at EP34 (Welch’s t-test, **p = 0.0091). Number of PV cells: At EP18; n = 16 for Tsc1+/+, n = 9 for Tsc1−/−. At EP34: n = 5 Tsc1+/+, n = 5 Tsc1−/−. f Tsc1−/− PV cells show more developed branching than Tsc1+/+ cells at EP18 (Welch’s t-test, **p = 0.0017 (radius 7), ****p < 0.0001 (radius 8), ***p = 0.0001 (radius 9)). g At EP34 Tsc1−/− PV cells are characterized by simpler axonal branching compared to controls (Welch’s t-test: *p = 0.0336 (radius 6), **p = 0.0016 (radius 7), **p = 0.0047 (radius 8), *p = 0.0232 (radius 9)). Number of PV cells: At EP18; n = 15 for Tsc1+/+, n = 9 for Tsc1−/−. At EP34: n = 5 Tsc1+/+, n = 5 Tsc1−/−. h Percentage of innervation is significantly increased in Tsc1−/− PV cells at EP18 and reduced at EP34 (Welch’s t-test: EP18, *p = 0.0114; EP34, ****p < 0.0001). Number of PV cells: At EP18; n = 14 for Tsc1+/+, n = 9 for Tsc1−/−. At EP34: n = 5 Tsc1+/+, n = 5 Tsc1−/−. i Schematic representation of bouton density during the postnatal maturation of Tsc1+/+ and Tsc1−/− PV cells Scale bars: a1–d1, 50 µm; a2–d2, 10 µm; a3–d3, 5 µm. Data represent mean ± SEM. Source data are provided as a Source Data file.
Fig. 4
Fig. 4. PV cells show prematurely rich perisomatic innervation in Tg(Nkx2.1-Cre);Tsc1flox/flox and Tg(Nkx2.1-Cre);Tsc1flox/+ mice at EP18.
a1 A PV cell (green) amongst NeuN immunostained neurons (in blue) in cortical organotypic culture from a Tsc1Ctrl mouse at EP18. a2 PV cell from Tsc1Ctrl slice shows characteristic branching and multiple boutons (arrowheads) on the postsynaptic somata (a3). PV cells from Tg(Nkx2.1-Cre);Tsc1flox/+ mice (b1b3) and Tg(Nkx2.1-Cre);Tsc1flox/flox mice (c1c3) show increased bouton density (d) (one-way ANOVA, **p = 0.0039; Holm–Sidak’s multiple comparisons: Tsc1Ctrl vs Tg(Nkx2.1-Cre);Tsc1flox/+ **p = 0.0023; Tsc1Ctrl vs Tg(Nkx2.1-Cre);Tsc1flox/flox *p = 0.0242). Number of mice: Tsc1Ctrl n = 7, Tg(Nkx2.1-Cre);Tsc1flox/+ n = 7, Tg(Nkx2.1-Cre); Tsc1flox/flox n = 6. e Local branching (one-way ANOVA *p = 0.0113 (Radius 8), **p = 0.0096 (Radius 9); Holm–Sidak’s multiple comparisons: (Radius 8) Tsc1Ctrl vs Tg(Nkx2.1-Cre); Tsc1flox/+ *p = 0,0155; Tsc1Ctrl vs Tg(Nkx2.1-Cre); Tsc1flox/flox *p = 0.0425, Tg(Nkx2.1-Cre); Tsc1flox/+ vs Tg(Nkx2.1-Cre); Tsc1flox/flox p = 0.8062; (Radius 9) Tsc1Ctrl vs Tg(Nkx2.1-Cre); Tsc1flox/+ *p = 0.0317; Tsc1Ctrl vs Tg(Nkx2.1-Cre); Tsc1flox/flox *p = 0.0148, Tg(Nkx2.1-Cre); Tsc1flox/+ vs Tg(Nkx2.1-Cre); Tsc1flox/flox p = 0.9738). Number of mice: Tsc1Ctrl n = 7, Tg(Nkx2.1-Cre);Tsc1flox/+ n = 5, Tg(Nkx2.1-Cre); Tsc1flox/flox n = 6. f Percentage of innervation (one-way ANOVA, *p = 0.0254; Holm–Sidak’s multiple comparisons: Tsc1Ctrl vs Tg(Nkx2.1-Cre); Tsc1flox/+ p = 0,0823; Tsc1Ctrl vs Tg(Nkx2.1-Cre); Tsc1flox/flox *p = 0.0168). Number of PV cells: Tsc1Ctrl n = 8, Tg(Nkx2.1-Cre); Tsc1flox/+ n = 6, Tg(Nkx2.1-Cre); Tsc1flox/flox n = 7. Scale bars: a1c1, 20 µm; a2c2, 10 µm, a3c3, 3 µm. Data represent mean ± SEM. Source data are provided as a Source Data file.
Fig. 5
Fig. 5. PV interneurons show significantly reduced perisomatic innervation in Tg(Nkx2.1-Cre);Tsc1flox/flox and Tg(Nkx2.1-Cre);Tsc1flox/+ mice at EP34.
a A PV cell (green) among NeuN immunostained neurons (blue) in cortical organotypic cultures from a Tsc1Ctrl mouse at EP34. b, c PV cells from Tg(Nkx2.1-Cre);Tsc1flox/+ mice (b1b3) or Tg(Nkx2.1-Cre);Tsc1flox/flox mice (c1c3) show decreased bouton density (d) (one-way ANOVA, *p = 0.0157; Holm–Sidak’s multiple comparisons: Tsc1Ctrl vs Tg(Nkx2.1-Cre);Tsc1flox/+ *p = 0,0214; Tsc1Ctrl vs Tg(Nkx2.1-Cre); Tsc1flox/flox *p = 0.0214). Local branching (e) (one-way ANOVA, **p = 0.0040 (Radius 7), *p = 0.0127 (Radius 8), **p = 0.0011 (Radius 9); Holm–Sidak’s multiple comparisons: (Radius 7) Tsc1Ctrl vs Tg(Nkx2.1-Cre);Tsc1flox/+ **p = 0.0032; Tsc1Ctrl vs Tg(Nkx2.1-Cre); Tsc1flox/flox *p = 0.0117; (Radius 8) Tsc1Ctrl vs Tg(Nkx2.1-Cre); Tsc1flox/+*p = 0.0126; Tsc1Ctrl vs Tg(Nkx2.1-Cre); Tsc1flox/flox *p = 0.0149; (Radius 9) Tsc1Ctrl vs Tg(Nkx2.1-Cre); Tsc1flox/+ ***p = 0.0008; Tsc1Ctrl vs Tg(Nkx2.1-Cre);Tsc1flox/flox **p = 0.0034). Number of mice: Tsc1Ctrl n = 6, Tg(Nkx2.1-Cre);Tsc1flx/+ n = 6, Tg(Nkx2.1-Cre); Tsc1flox/flox n = 6. f Percentage of innervation is also significantly lower for PV cells from Tg(Nkx2.1-Cre);Tsc1flox/+ and Tg(Nkx2.1-Cre); Tsc1flox/flox mice (one-way ANOVA, *p = 0.0212, Holm–Sidak’s multiple comparisons: Tsc1Ctrl vs Tg(Nkx2.1-Cre);Tsc1flox/+ *p = 0.0257; Tsc1Ctrl vs Tg(Nkx2.1-Cre); Tsc1flox/flox *p = 0.0179). Number of PV cells: Tsc1Ctrl n = 6, Tg(Nkx2.1-Cre);Tsc1flox/+ n = 8, Tg(Nkx2.1-Cre);Tsc1flox/flox n = 6. Arrowheads indicate boutons. Scale bars: a1c1, 20 µm; a2c2, 10 µm, a3c3, 3 µm. Data represent mean ± SEM. Source data are provided as a Source Data file.
Fig. 6
Fig. 6. Tsc1 deletion in GABAergic cells causes transient autophagy dysfunctions in adolescent mice.
Western blot representative bands of LC3-I, LC3-II (a), p62 proteins (b); pAMPK, AMPK, pULK1, and ULK1 (e). cg Quantification reveals that LC3-II and pAMPK/AMPK expressions are higher in P14 Tg(Nkx2.1-Cre);Tsc1flox/flox vs Tsc1Ctrl mice (c, f; Unpaired t-test: LC3-II *p = 0.0314; pAMPK/AMPK **p = 0.003), while p62 protein expression was unchanged and pULK1/ULK1 expressions showed a trend towards increased expression (d, g; Unpaired t-test: p62 p = 0.9937; pULK1/ULK1 p = 0.065). h, i Western blot representative bands of LC3-I, LC3-II, p62, pAMPK, and AMPK in adult mice and their quantification (j, k, l) show no differences between the two genotypes (Unpaired t-test: LC3-II p = 0.8446; p62 p = 0.7426; pAMPK/AMPK p = 0.9925). Molecular weight: LC3-I/II :17/14 kDa; p62: 62 kDa; pAMPK: 62 kDa; AMPK: ~62 kDa; ULK1:140 kDa; pULK1: ~150 kDa; GAPDH: 37 kDa. Number of mice at P14: LC3-II; Tsc1Ctrl n = 3, Tg(Nkx2.1-Cre);Tsc1flox/flox n = 3; p62, pAMPK, AMPK, pULK1, ULK1 Tsc1Ctrl n = 4, Tg(Nkx2.1-Cre);Tsc1flox/flox n = 5. Number of mice at P40: LC3-II and p62; Tsc1Ctrl n = 4, Tg(Nkx2.1-Cre);Tsc1flox/flox n = 4; pAMPK and AMPK; Tsc1Ctrl n = 4, Tg(Nkx2.1-Cre);Tsc1flox/flox n = 5. Data represent mean ± SEM. Source data are provided as a Source Data file.
Fig. 7
Fig. 7. Late-onset Tsc1 deletion in PV cells does not affect their innervation.
a1 EP 34 Tsc1+/+ and b1 Tsc1−/− PV cells show similar axonal branching (a2, b2) and perisomatic boutons (a3, b3, arrowheads). c Bouton density (Welch’s t-test, p = 0.4091; PV cells: n = 9 Tsc1+/+, n = 11 Tsc1−/−), d local branching (Welch’s t-test, p = 0.5789; PV cells: n = 9 Tsc1+/+, n = 11 Tsc1−/−), and e percentage of innervation (Welch’s t-test, p = 0.2448; PV cells: n = 6 Tsc1+/+, n = 7 Tsc1−/−) are not significantly different between the two groups. Scale bars: a1b1, 50 µm; a2b2, 10 µm, and a3b3, 5 µm. Data in represent mean ± SEM. Source data are provided as a Source Data file.
Fig. 8
Fig. 8. Postnatal onset of Tsc1 haploinsufficiency in PV cells induces premature putative synapse formation.
af Representative immunostained sections of somatosensory cortex labeled for PV/GFP (blue/green) and gephyrin (red) in P22 PV-Cre;RCE;Tsc1+/+ (ac) and PV-Cre;RCE;Tsc1flox/+ mice (df). White arrowheads indicate PV/Gephyrin colocalized puncta (c and f). Scale bar: 5 μm. g Quantification of PV/GFP-Gephyrin colocalized puncta (Welch’s t-test, *p = 0.0121). Number of mice: n = 5 for PV-Cre;RCE;Tsc1+/+ and n = 7 for PV-Cre;RCE;Tsc1flox/+. Data represent mean ± SEM. Source data are provided as a Source Data file.
Fig. 9
Fig. 9. Short term Rapamycin treatment rescues the premature increase of PV cell perisomatic innervation caused by Tsc1 haploinsufficiency.
a Schematic of the treatment paradigm. bm Representative immunostained sections of somatosensory cortex labeled for PV/GFP (blue/green) and gephyrin (red) in Vehicle (bg) and Rapamycin (im) treated P22 mice showing PV/GFP-Gephyrin colocalized boutons (arrowheads) (d, g and j, m). Scale bar: 5 μm. n, o PV/GFP-Gephyrin colocalized puncta in Vehicle-treated (n, Welch’s t-test, *p = 0.0423) and Rapamycin-treated mice (o, Welch’s t-test, p = 0.6088). Vehicle treatment: n = 5 for both PV-Cre;RCE;Tsc1+/+ and PV-Cre;RCE;Tsc1flox/+ mice. Rapamycin treatment: n = 5 PV-Cre;RCE;Tsc1+/+, n = 6 PV-Cre;RCE;Tsc1flox/+ mice. Data represent mean ± SEM. Source data are provided as a Source Data file.
Fig. 10
Fig. 10. Short term rapamycin treatment rescues loss of PV cell connectivity and social behavior deficits in adult heterozygous mutant mice.
a Schematic for treatment paradigm. bg Representative immunostained sections of somatosensory cortex labeled for PV (green) and gephyrin (red) in Vehicle (bd) and Rapamycin (eg) treated mice showing PV-Gephyrin colocalized boutons (arrowheads). h PV-Gephyrin colocalized puncta in Vehicle (one-way Anova, *p = 0.036; Tukey’s multiple comparisons test: Tsc1Ctrl vs PV-Cre; Tsc1flox/+ *p = 0.0401; Tsc1Ctrl vs PV-Cre; Tsc1flox/flox *p = 0.0281, PV-Cre; Tsc1flox/+ vs PV-Cre;Tsc1flox/flox *p = 0.9942) and i Rapamycin treated mice (one-way Anova, p = 0.7355; Tukey’s multiple comparisons test: Tsc1Ctrl vs PV-Cre;Tsc1flox/+ p = 0.8421; Tsc1Ctrl vs PV-Cre; Tsc1flox/flox p = 0.7298, PV-Cre; Tsc1flox/+ vs PV-Cre; Tsc1flox/flox p = 0.9774). Number of vehicle-treated mice: Tsc1Ctrl, n = 3; PV-Cre; Tsc1flox/+, n = 4; PV-Cre; Tsc1flox/flox, n = 5. Number of rapamycin treated mice: n = 5 for all the genotypes. j Open field test. Vehicle-treated mice: Tsc1Ctrl, n = 10; PV-Cre;Tsc1flox/+, n = 7; PV-Cre;Tsc1flox/flox, n = 5. Rapamycin-treated mice: Tsc1Ctrl, n = 17; PV-Cre;Tsc1flox/+, n = 10; PV-Cre;Tsc1flox/flox, n = 10. k Elevated plus maze test. Vehicle-treated mice: Tsc1Ctrl, n = 16; PV-Cre; Tsc1flox/+, n = 7; PV-Cre;Tsc1flox/flox, n = 9; Rapamycin-treated mice: Tsc1Ctrl, n = 17; PV-Cre;Tsc1flox/+, n = 11; PV-Cre;Tsc1flox/flox, n = 11. l, m Rapamycin treatment from P14-21 rescues social approach (l, two-way ANOVA vehicle, Fgenotype (2, 20) = 1.615 p = 0.2238, Ftime (1, 20) = 4.789 p = 0.0407, Fgenotype*time (2, 20) = 3.395 p = 0.0538; *p = 0.0230, Holm–Sidak’s multiple comparisons test. Two-way ANOVA rapamycin, Fgenotype (2, 29) = 1.027 p = 0.3709, Ftime (1, 29) = 22.08 p < 0.0001, Fgenotype*time (2, 29) = 4.580 p = 0.0187; **p = 0.0019, ***p = 0.0002, Holm-Sidak’s multiple comparisons test) and social novelty deficits (m, two-way ANOVA vehicle, Fgenotype (2, 20) = 0.8281 p = 0.4513, Ftime (1, 20) = 5.876 p = 0.0250, Fgenotype*time (2, 20) = 6.036 p = 0.0089; **p = 0.0053, Holm–Sidak’s multiple comparisons test. Two-way ANOVA rapamycin, Fgenotype (2, 29) = 0.4667 p = 0.6317, Ftime (1, 29) = 18.84 p = 0.0002, Fgenotype*time (2, 29) = 0.09351 p = 0.9110; **p = 0.0081, *p = 0.0336, Holm–Sidak’s multiple comparisons test) in PV-Cre; Tsc1flox/+, but not in PV-Cre;Tsc1flox/flox mice. Vehicle-treated mice: Tsc1Ctrl, n = 7; PV-Cre; Tsc1flox/+, n = 9; PV-Cre;Tsc1flox/flox, n = 7. Rapamycin-treated mice: Tsc1Ctrl, n = 14; PV-Cre;Tsc1flox/+, n = 10; PV-Cre;Tsc1flox/flox, n = 8. Scale bar: 5 µm. Data represent mean ± SEM. Source data are provided as a Source Data file.

References

    1. Saxton RA, Sabatini DM. mTOR signaling in growth, metabolism, and disease. Cell. 2017;169:361–371. doi: 10.1016/j.cell.2017.03.035. - DOI - PubMed
    1. Costa-Mattioli M, Monteggia LM. mTOR complexes in neurodevelopmental and neuropsychiatric disorders. Nat. Neurosci. 2013;16:1537–1543. doi: 10.1038/nn.3546. - DOI - PubMed
    1. Lipton JO, Sahin M. The neurology of mTOR. Neuron. 2014;84:275–291. doi: 10.1016/j.neuron.2014.09.034. - DOI - PMC - PubMed
    1. Crino PB, Nathanson KL, Henske EP. The tuberous sclerosis complex. N. Engl. J. Med. 2006;355:1345–1356. doi: 10.1056/NEJMra055323. - DOI - PubMed
    1. Rubenstein JL, Merzenich MM. Model of autism: increased ratio of excitation/inhibition in key neural systems. Genes Brain Behav. 2003;2:255–267. doi: 10.1034/j.1601-183X.2003.00037.x. - DOI - PMC - PubMed

Publication types

MeSH terms

Grants and funding

LinkOut - more resources