. 2021 Jun 16;12(1):3666.
doi: 10.1038/s41467-021-23894-3.

The long lives of primates and the 'invariant rate of ageing' hypothesis

Affiliations

The long lives of primates and the 'invariant rate of ageing' hypothesis

Fernando Colchero et al. Nat Commun. .

Abstract

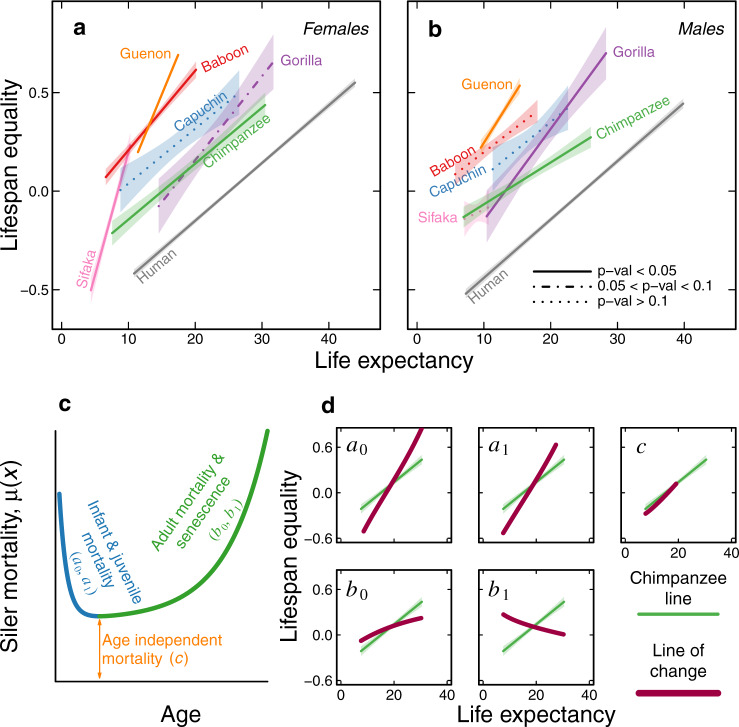
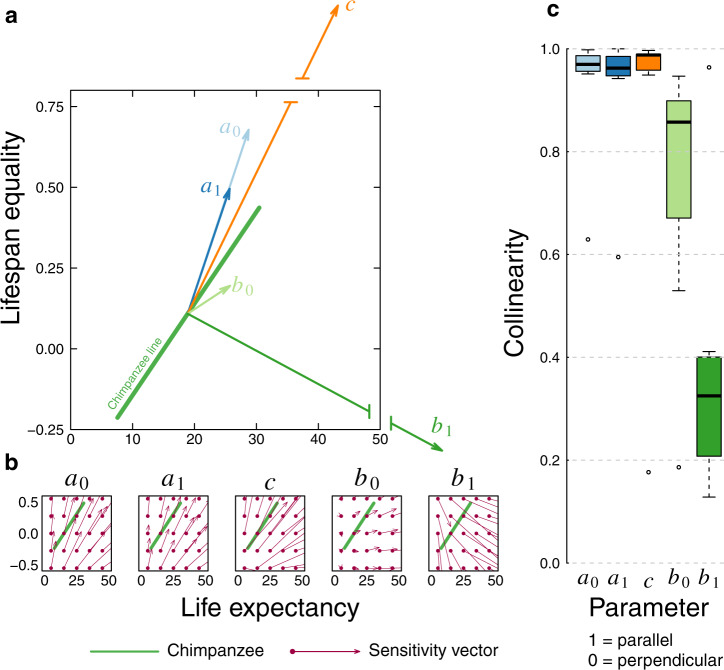
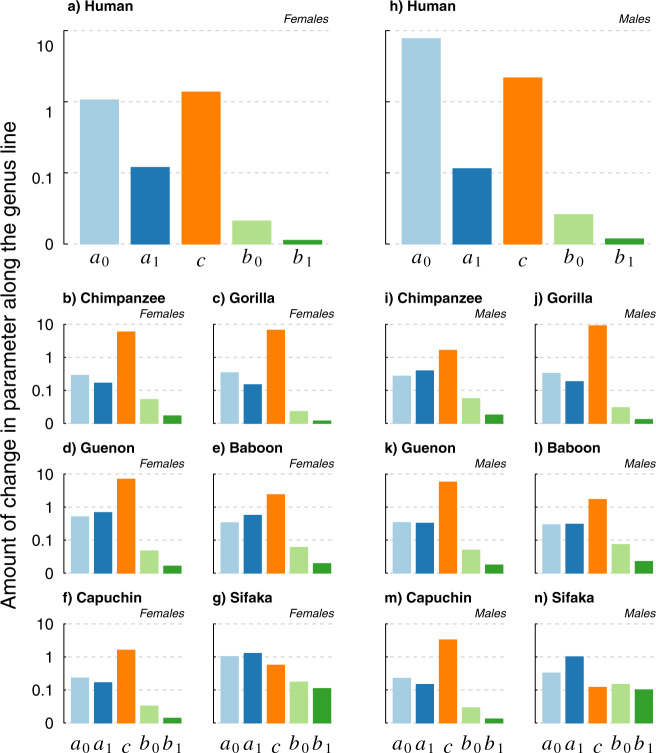
Is it possible to slow the rate of ageing, or do biological constraints limit its plasticity? We test the 'invariant rate of ageing' hypothesis, which posits that the rate of ageing is relatively fixed within species, with a collection of 39 human and nonhuman primate datasets across seven genera. We first recapitulate, in nonhuman primates, the highly regular relationship between life expectancy and lifespan equality seen in humans. We next demonstrate that variation in the rate of ageing within genera is orders of magnitude smaller than variation in pre-adult and age-independent mortality. Finally, we demonstrate that changes in the rate of ageing, but not other mortality parameters, produce striking, species-atypical changes in mortality patterns. Our results support the invariant rate of ageing hypothesis, implying biological constraints on how much the human rate of ageing can be slowed.


Conflict of interest statement

The authors declare no competing interests.

Figures

Fig. 1
Fig. 1. The life expectancy–lifespan equality landscape for seven genera of primates for for both sexes.
a Life expectancy and lifespan equality regression lines for females; each species is represented by a different colour. b Life expectancy and lifespan equality regression lines for males. Each genus is characterised by a relatively constrained relationship between life expectancy and lifespan equality, and thus a distinct regression line; colours as in a. The central lines are the predicted fitted values of the regression and the type of line (e.g. continuous, dashed, or dotted) depicts three levels for the p values of the slopes (how significantly different from 0 they are, two-sided t test, H0: β1 = 0, Supplementary Table 1), while the shaded polygons show the 95% confidence intervals of the regressions. c The relationship between the Siler mortality parameters and the resulting mortality function, given by the equation μ(x) = exp(a0 – a1 x) + c + exp(b0 + b1 x), where infant and juvenile mortality (blue) are controlled by parameters a0 and a1, age-independent mortality (orange) is captured by c, and senescent mortality (green) is captured by b0 (initial adult mortality) and b1 (rate of ageing). d Each box shows how gradual changes in each Siler mortality parameter modify the life expectancy and lifespan equality values (thick purple lines). The green line in each box corresponds to the regression line for female chimpanzees, shown for reference to illustrate the general trends among all genus lines. The purple curves show the changes in life expectancy and lifespan equality after varying individual Siler parameters while holding the other parameters constant. Note the striking change in life expectancy and lifespan equality that would result from changes in the ageing parameters, particularly b1. See Supplementary Fig. S3 for plots that include individual points for each population. Source data to generate the regression lines are available in Supplementary Data 3.
Fig. 2
Fig. 2. Sensitivities of life expectancy and lifespan equality to changes in mortality parameters.
a Using the female chimpanzee line (bright green) as an example, vectors depict the sensitivity at the mid-point of the genus line. Each vector depicts the direction and magnitude of change in life expectancy and lifespan equality for a unit change in the corresponding Siler mortality parameter. The x- and y-axes show the life expectancy and lifespan equality values of the sensitivity vectors for a0 (light blue), a1 (dark blue), and b0 (light green); vectors for c (orange) and b1 (dark green) are particularly large, represented by broken lines (Source data are provided as a Source Data File and available in Supplementary Table 2). b Gradient field of sensitivities of life expectancy and lifespan equality to changes in each mortality parameter, showing the direction of change any population would experience for a given change in the parameter, from any starting point in the landscape. The green chimpanzee line is provided for reference. Each sensitivity vector (bright purple) can be interpreted as those in A, but calculated from different points on the landscape). c Boxplots representing the values of the seven collinearity values (one for each genus) for each of the Siler parameters for n = 7 independent genera. Collinearity is calculated between the mid-point of the genus line and the sensitivity vector for each parameter; a value of 1 would imply that the vector is parallel, a value of 0 would imply that it is perpendicular. Note the relatively large collinearity values for a0 (light blue), a1 (dark blue), and c (orange), the intermediate value for b0 (light green) and the relatively small value for b1 (dark green). The boxplots indicate median (horizontal black line), 25th and 75th percentiles (box), the whiskers are extend to 1.5 the interquartile range, and the open points are extreme values (Source data are provided as a Source Data File and available in Supplementary Table 3).
Fig. 3
Fig. 3. Relative magnitude of change of each parameter along the genus lines.
Pre-adult and age-independent mortality parameters (a0 a1, and c) vary several orders of magnitude more, within each genus, than the ageing parameters (b0 and b1). Colours: a0 (light blue) a1, (dark blue), c (orange), b0 (light green) and b1 (dark green). Values were calculated by numerically solving the path integral in Eq. (9) (see ‘Material and Methods’) for each parameter along each genus line. The y-axes were scaled by the logarithm base 10 to improve interpretability. ag depict results for females, and hn for males (Source data are provided as a Source Data File and available in Supplementary Table 4).

References

    1. Oeppen J, Vaupel J. Broken limits to life expectancy. Science. 2002;296:1029–1031. doi: 10.1126/science.1069675. - DOI - PubMed
    1. Zuo W, Jiang S, Guo Z, Feldman MW, Tuljapurkar S. Advancing front of old-age human survival. Proc. Natl Acad. Sci. USA. 2018;115:11209–11214. doi: 10.1073/pnas.1812337115. - DOI - PMC - PubMed
    1. Aburto JM, Villavicencio F, Basellini U, Kjærgaard S, Vaupel JW. Dynamics of life expectancy and life span equality. Proc. Natl Acad. Sci. USA. 2020;117:5250–5259. doi: 10.1073/pnas.1915884117. - DOI - PMC - PubMed
    1. Vaupel JW, Villavicencio F, Bergeron-Boucher M-P. Demographic perspectives on the rise of longevity. Proc. Natl Acad. Sci. USA. 2021;118:e2019536118. doi: 10.1073/pnas.2019536118. - DOI - PMC - PubMed
    1. Jones OR, et al. Senescence rates are determined by ranking on the fast-slow life-history continuum. Ecol. Lett. 2008;11:664–673. doi: 10.1111/j.1461-0248.2008.01187.x. - DOI - PubMed

Publication types